. 2022 Mar 2;12(1):3463.
doi: 10.1038/s41598-022-07314-0.

Detection of COVID-19 using multimodal data from a wearable device: results from the first TemPredict Study

Affiliations

Detection of COVID-19 using multimodal data from a wearable device: results from the first TemPredict Study

Ashley E Mason et al. Sci Rep. .

Erratum in

  • Author Correction: Detection of COVID-19 using multimodal data from a wearable device: results from the first TemPredict Study.
    Mason AE, Hecht FM, Davis SK, Natale JL, Hartogensis W, Damaso N, Claypool KT, Dilchert S, Dasgupta S, Purawat S, Viswanath VK, Klein A, Chowdhary A, Fisher SM, Anglo C, Puldon KY, Veasna D, Prather JG, Pandya LS, Fox LM, Busch M, Giordano C, Mercado BK, Song J, Jaimes R, Baum BS, Telfer BA, Philipson CW, Collins PP, Rao AA, Wang EJ, Bandi RH, Choe BJ, Epel ES, Epstein SK, Krasnoff JB, Lee MB, Lee SW, Lopez GM, Mehta A, Melville LD, Moon TS, Mujica-Parodi LR, Noel KM, Orosco MA, Rideout JM, Robishaw JD, Rodriguez RM, Shah KH, Siegal JH, Gupta A, Altintas I, Smarr BL. Mason AE, et al. Sci Rep. 2022 Mar 16;12(1):4568. doi: 10.1038/s41598-022-08723-x. Sci Rep. 2022. PMID: 35296773 Free PMC article. No abstract available.

Abstract

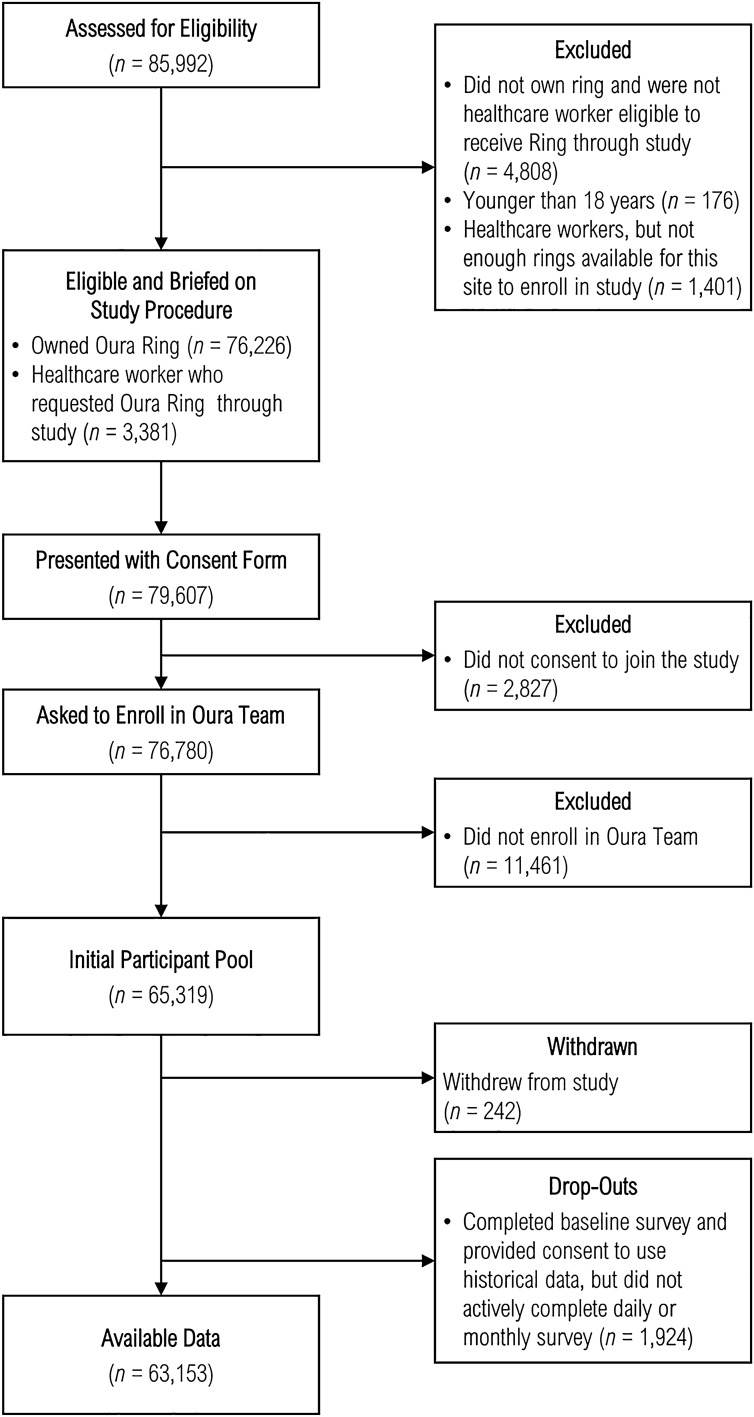
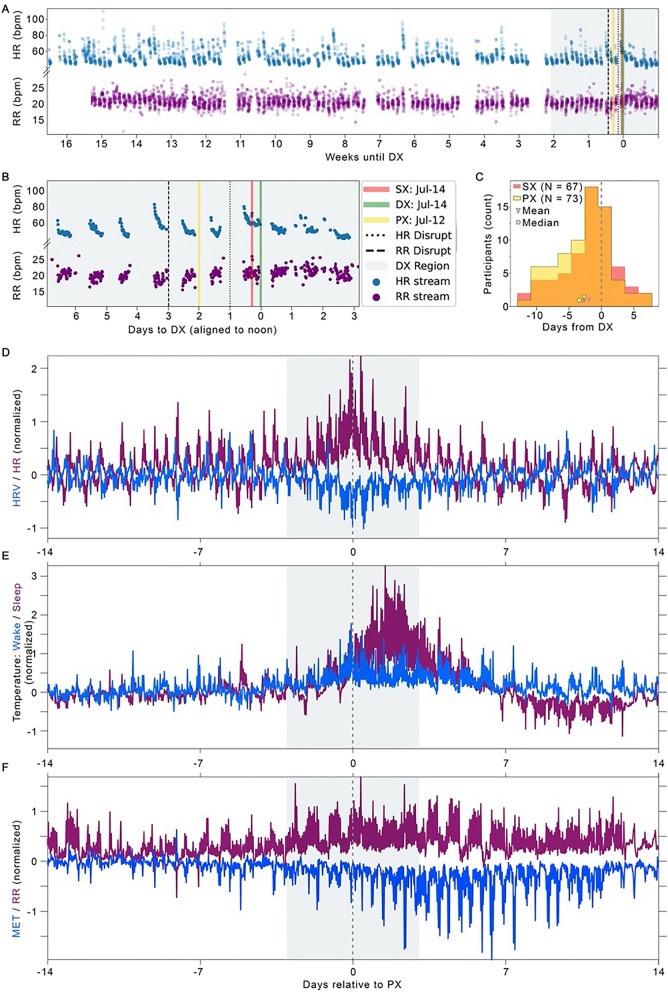
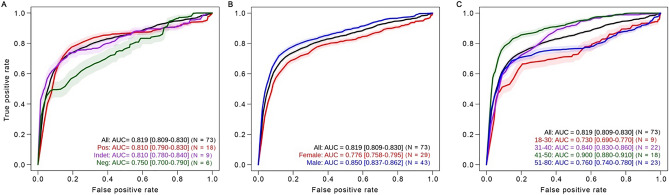
Early detection of diseases such as COVID-19 could be a critical tool in reducing disease transmission by helping individuals recognize when they should self-isolate, seek testing, and obtain early medical intervention. Consumer wearable devices that continuously measure physiological metrics hold promise as tools for early illness detection. We gathered daily questionnaire data and physiological data using a consumer wearable (Oura Ring) from 63,153 participants, of whom 704 self-reported possible COVID-19 disease. We selected 73 of these 704 participants with reliable confirmation of COVID-19 by PCR testing and high-quality physiological data for algorithm training to identify onset of COVID-19 using machine learning classification. The algorithm identified COVID-19 an average of 2.75 days before participants sought diagnostic testing with a sensitivity of 82% and specificity of 63%. The receiving operating characteristic (ROC) area under the curve (AUC) was 0.819 (95% CI [0.809, 0.830]). Including continuous temperature yielded an AUC 4.9% higher than without this feature. For further validation, we obtained SARS CoV-2 antibody in a subset of participants and identified 10 additional participants who self-reported COVID-19 disease with antibody confirmation. The algorithm had an overall ROC AUC of 0.819 (95% CI [0.809, 0.830]), with a sensitivity of 90% and specificity of 80% in these additional participants. Finally, we observed substantial variation in accuracy based on age and biological sex. Findings highlight the importance of including temperature assessment, using continuous physiological features for alignment, and including diverse populations in algorithm development to optimize accuracy in COVID-19 detection from wearables.


Conflict of interest statement

Co-Authors Affiliated with the MIT Lincoln Laboratory: Patent US 10332638 was issued to MIT in June 2019 and covers aspects of the physiological data pre-processing and classifier training and testing. Patent inventors: A. Swiston, T. Patel, L. Milechin, J. Fleischman, W. Pratt, and A. Honko. None of the patent inventors are authors on this manuscript. Elissa S. Epel, PhD Dr. Epel has received loaned equipment from Oura Health to conduct research using Oura Rings. Ashley Mason, PhD, and Benjamin Smarr, PhD Patent applications US App. No. 17/357,922, US App. No. 17/357,930, and PCT App. No. PCT/US21/39260 have been filed as of July 2021 by Ōura Health Oy on behalf of UCSD. All applications cover use of wearable device data to detect illness onset. Authors A. Mason and B. Smarr are listed as co-inventors on these applications. Benjamin Smarr, PhD Dr. Smarr has received remuneration for consulting work from, and has a financial interest in Oura Ring Inc. Other authors declare no competing interests.

Figures

Figure 1
Figure 1
Enrollment and follow-up.
Figure 2
Figure 2
Algorithms aligned by PX can be used to classify COVID-19 infection. Each panel shows a set of receiver operator curves (ROC) with shading indicating  ±  95% CI. PX = date of maximal change from average over the 21-day DX region; SX = date of onset of one of four core symptoms of COVID-19; DX = date of diagnostic testing for COVID-19; HR = heart rate, HRV = heart rate variability, and RR = respiratory rate. Numbers in relationship to PX, SX, and DX refer to number of days before (negative numbers) or after (positive numbers) each of these dates. Models trained by alignment to PX were more accurate as the evaluation window approached PX (A; from red pre-PX to blue post-PX; n = 73; in all cases, the number of negative training samples was 179,010; the number of positive training samples were: 8678, 9059, 9527, 9719, and 9705, respectively), with a peak accuracy at the window of PX + 0: PX + 2 days. ROC curves generated from models trained by alignment to DX performed best when evaluated relative to PX (B; n = 41, restricted to the subset of individuals with reliable symptom onset reports). Models trained by alignment to PX, SX, and DX performed comparably when evaluated at PX + 0: PX + 2 days (C; n = 41). Exclusion of any physiological measure lowers performance, with the ROC AUC dropping the most when HRV was omitted (D; n = 73).
Figure 3
Figure 3
Continuous physiology data allow more precise alignment for machine learning training, sickness profiling. We analyzed continuous heart rate (HR, beats per min, blue) and respiratory rate (RR, breaths per min, purple) within the presumptive illness window of DX-2 weeks: DX + 1 week (grey shaded region) to detect statistical deviations (A, dashed lines; zoom in B); the average location of the two detections defined PX (yellow). On average, distance from PX to DX was 1 day longer than SX to DX (C); SX (n = 67) relies on report, and so is missing in some cases when PX (n = 73) is present. Profiles of physiological data aligned by PX from the n = 73 cohort for heart rate (HR) and heart rate variability (HRV; D), dermal temperature during wake and sleep (E) and estimated metabolic equivalents (MET) of physical activity and respiratory rate (RR; F). See Fig. 2 and Methods for definitions of DX, PX, and SX.
Figure 4
Figure 4
Accuracy changes across different populations. The model trained at PX + 0: PX + 2 showed different performance accuracy (ROC AUC) when we segregated participants by antibody test result (A), sex (B) and age group (C); [95% CI] (N). Each panel uses the participants (n = 73) who reported positive diagnostic tests for SARS CoV-2 and were included in algorithm training. Pos = positive, Indet = indeterminate, Neg = negative antibody test. The algorithm performed as expected on individuals with positive antibody tests (red), who were very similar to individuals with indeterminate antibody tests (purple). The algorithm was less accurate for individuals with negative antibody tests (green), consistent with the algorithm showing COVID-19 specificity. The ROC AUC for women was lower than the ROC AUC for men. Age groups showed different levels of overall accuracy that were not merely proportional to N.

References

    1. Karjalainen J, Viitasalo M. Fever and cardiac rhythm. Arch. Intern. Med. 1986;146:1169–1171. doi: 10.1001/archinte.1986.00360180179026. - DOI - PubMed
    1. Ahmad S, Tejuja A, Newman KD, Zarychanski R, Seely AJ. Clinical Review: A Review and Analysis of Heart Rate Variability and the Diagnosis and Prognosis of Infection. Critical Care (London, England). 2009;13:232. doi: 10.1186/cc8132. - DOI - PMC - PubMed
    1. Kluger MJ. Is fever beneficial? Yale J Biol Med. 1986;59:89–95. - PMC - PubMed
    1. Miller DJ, Capodilupo JV, Lastella M, Sargent C, Roach GD, Lee VH, Capodilupo ER. Analyzing changes in respiratory rate to predict the risk of COVID-19 infection. PLoS ONE. 2020;15:e0243693. doi: 10.1371/journal.pone.0243693. - DOI - PMC - PubMed
    1. Mishra T, Wang M, Metwally AA, Bogu GK, Brooks AW, Bahmani A, Alavi A, Celli A, Higgs E, Dagan-Rosenfeld O. Pre-symptomatic detection of COVID-19 from smartwatch data. Nat. Biomed. Eng. 2020;4:1208–1220. doi: 10.1038/s41551-020-00640-6. - DOI - PMC - PubMed

Publication types

LinkOut - more resources