. 2022 Mar;603(7900):309-314.
doi: 10.1038/s41586-022-04461-2. Epub 2022 Mar 2.

Molecular hallmarks of heterochronic parabiosis at single-cell resolution

Collaborators, Affiliations

Molecular hallmarks of heterochronic parabiosis at single-cell resolution

Róbert Pálovics et al. Nature. 2022 Mar.

Abstract

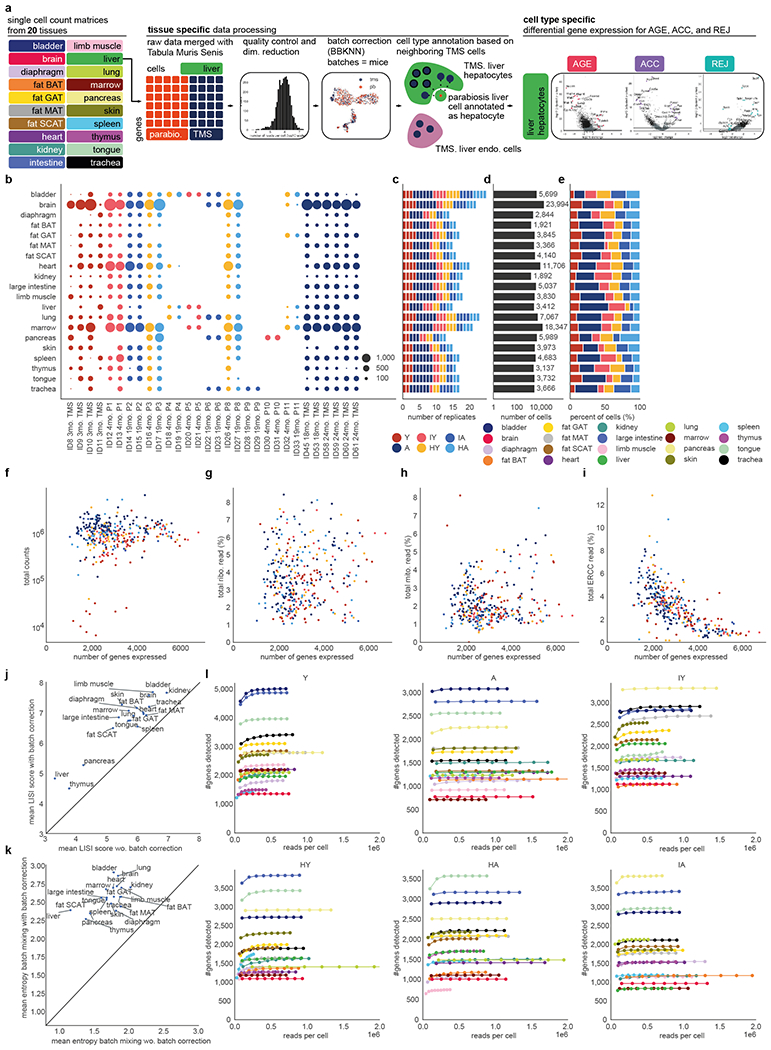
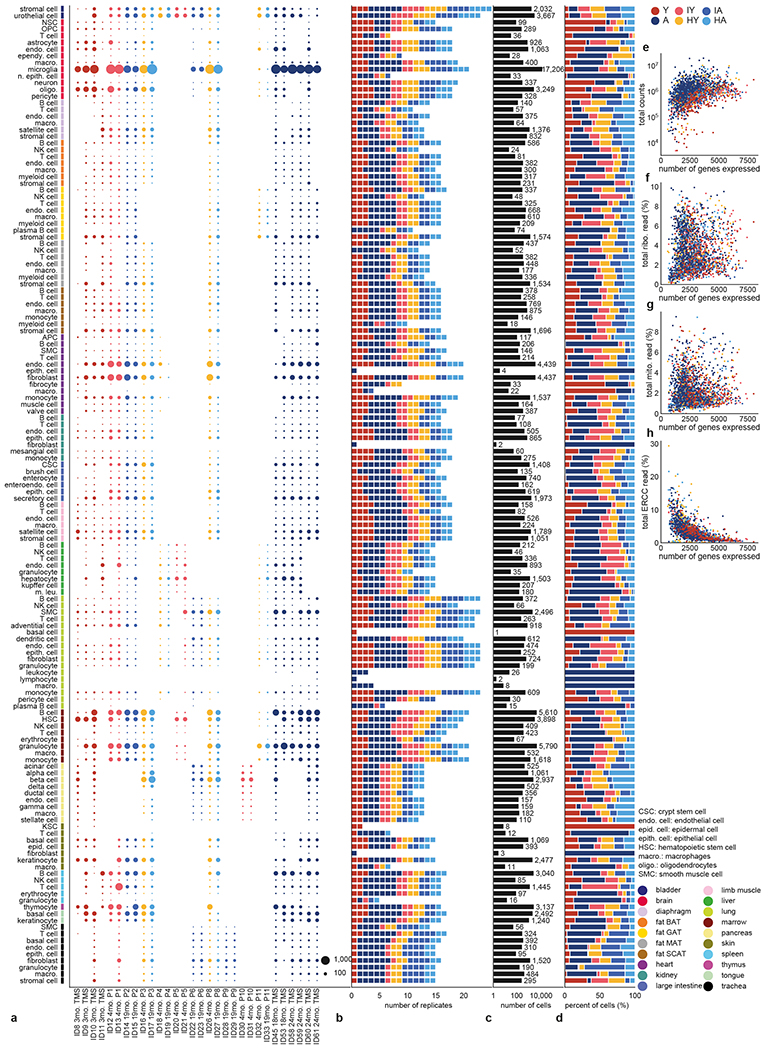
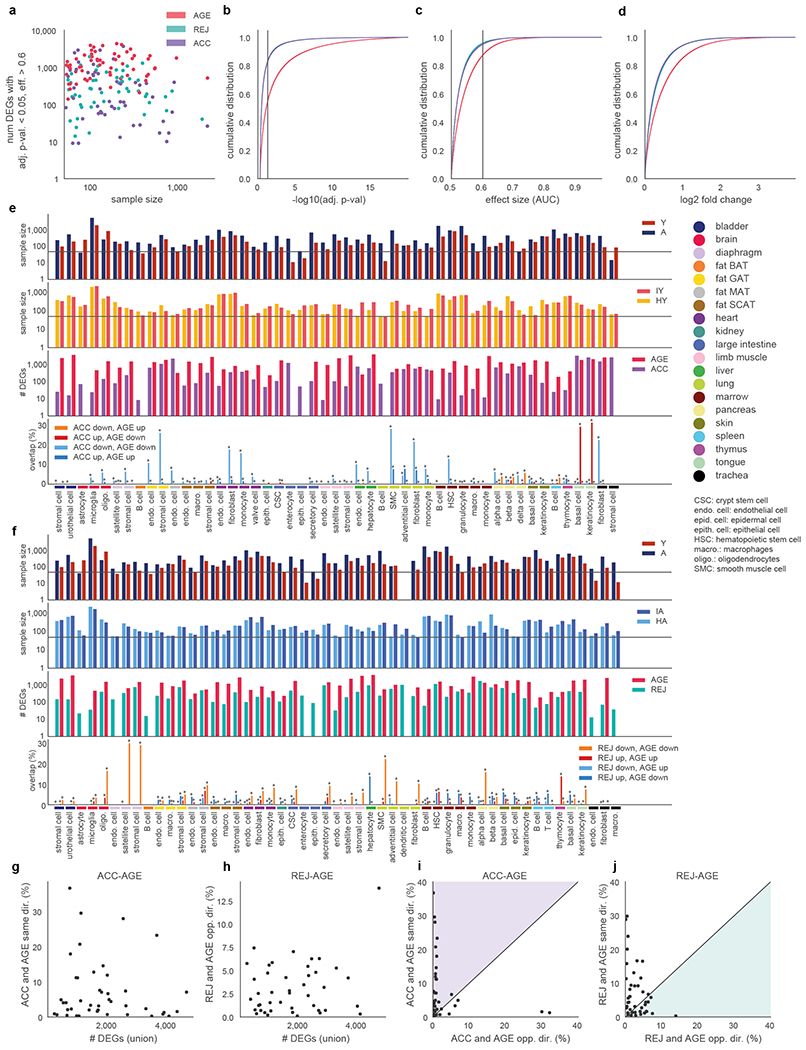
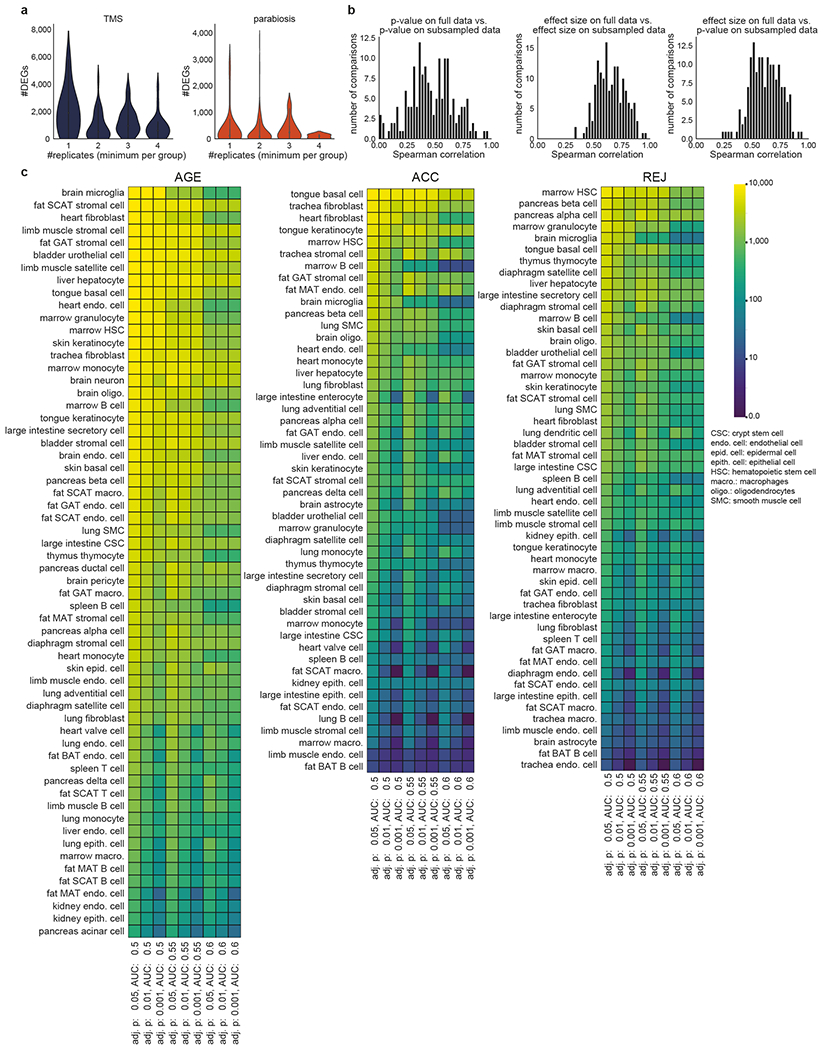
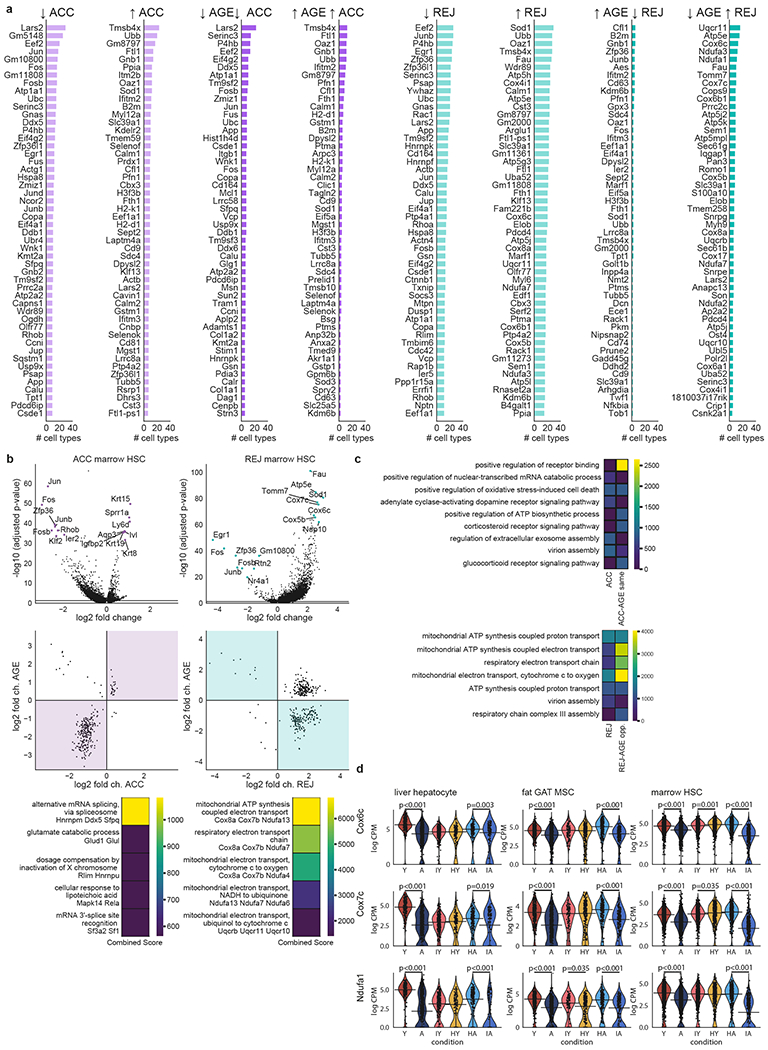
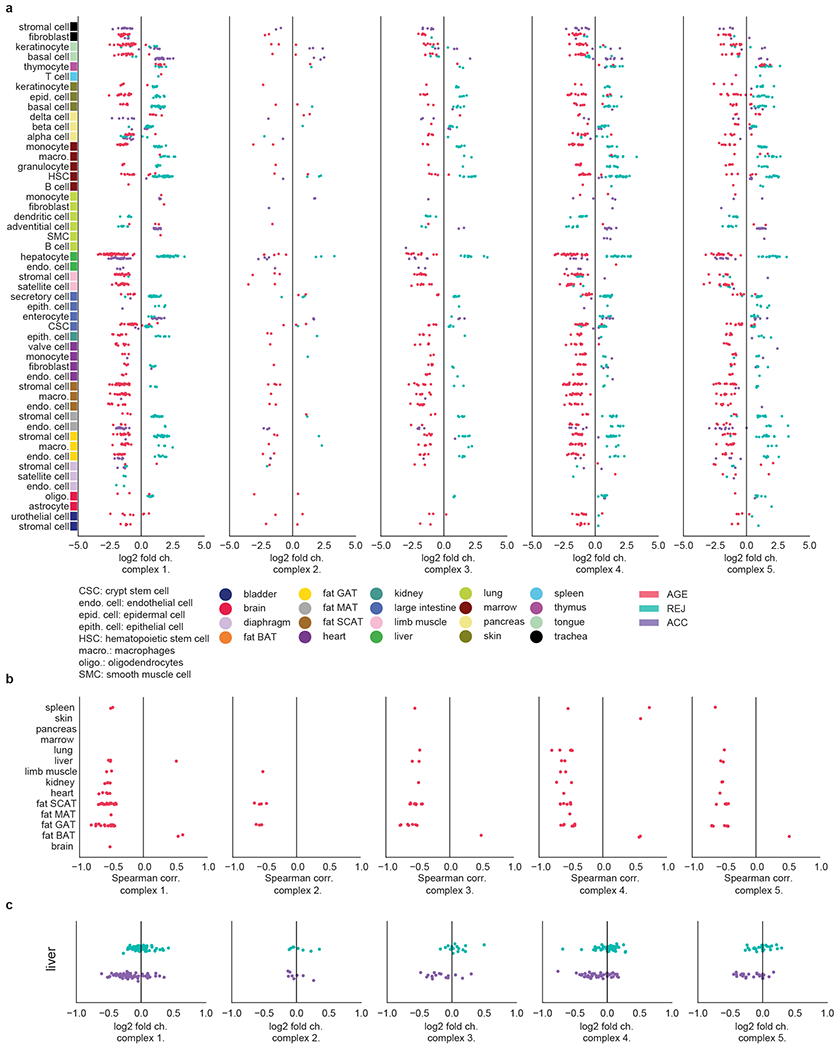
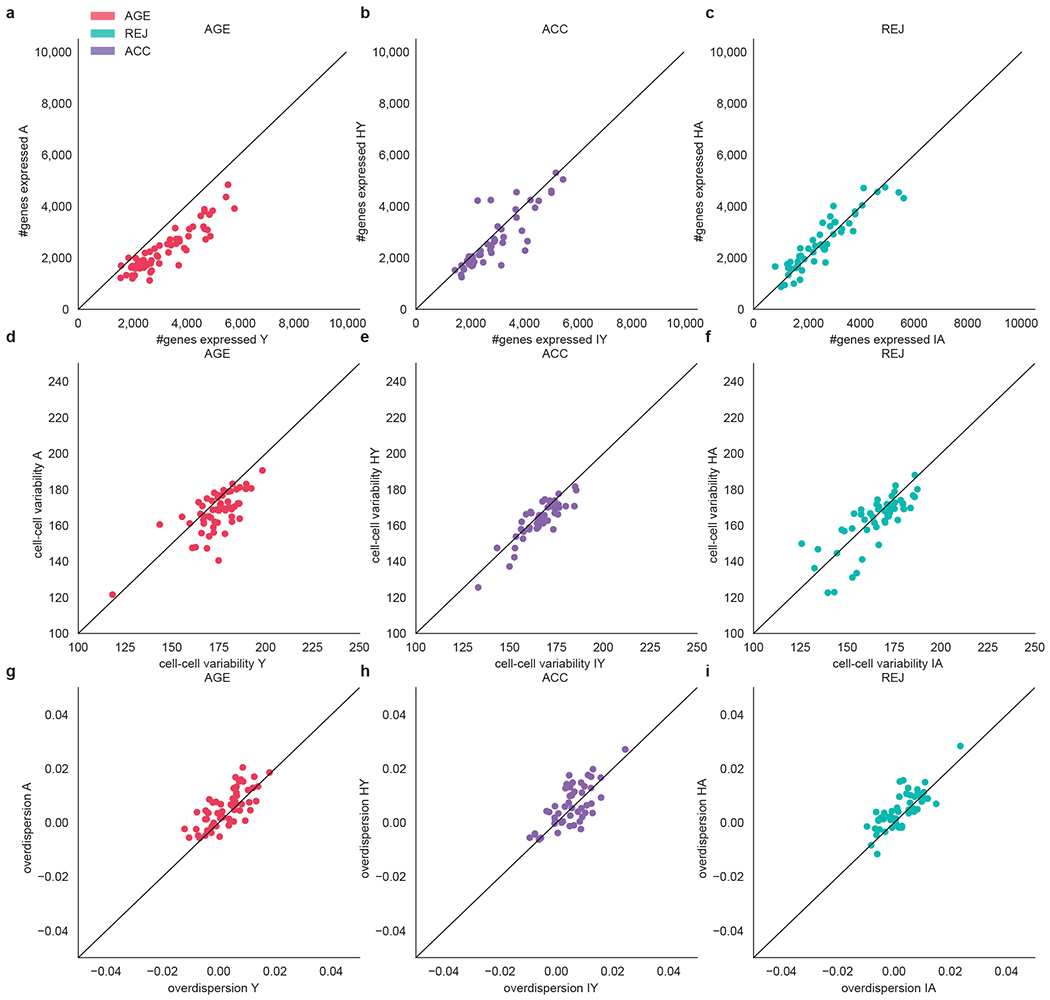
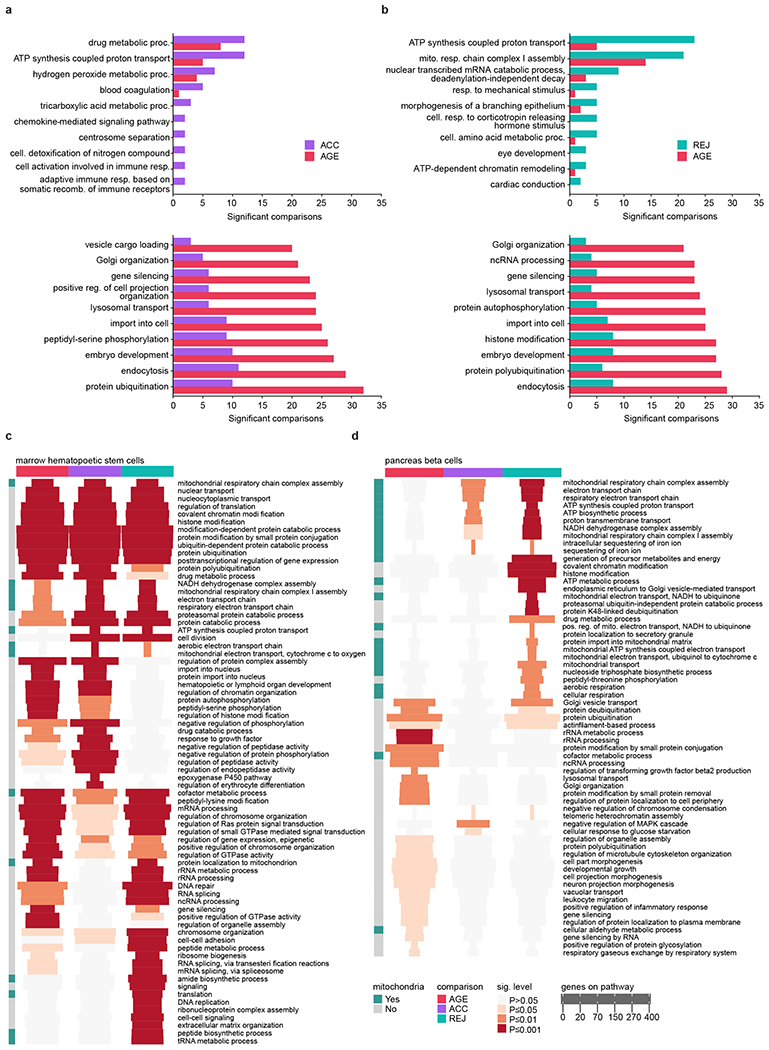
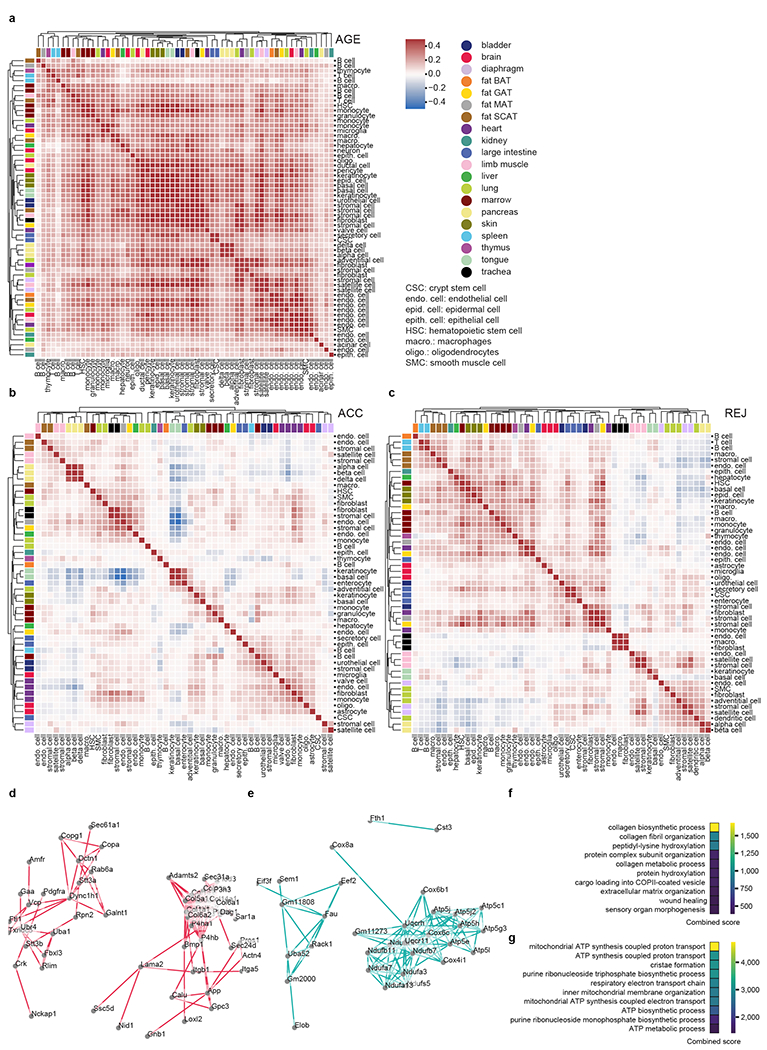
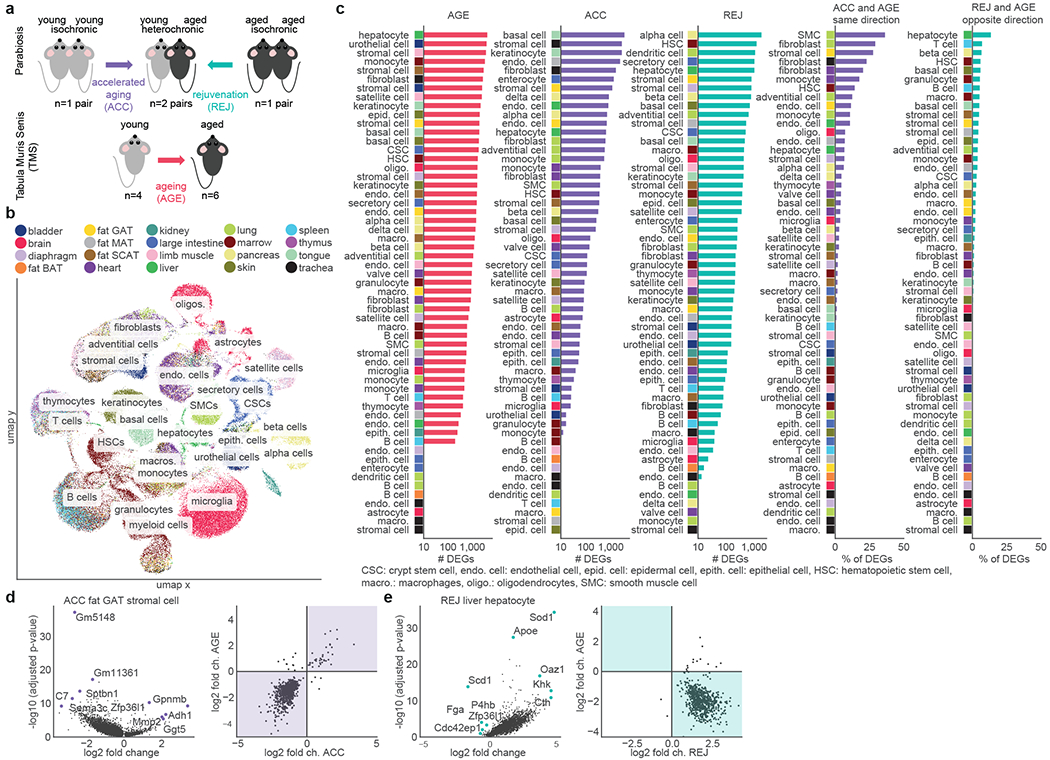
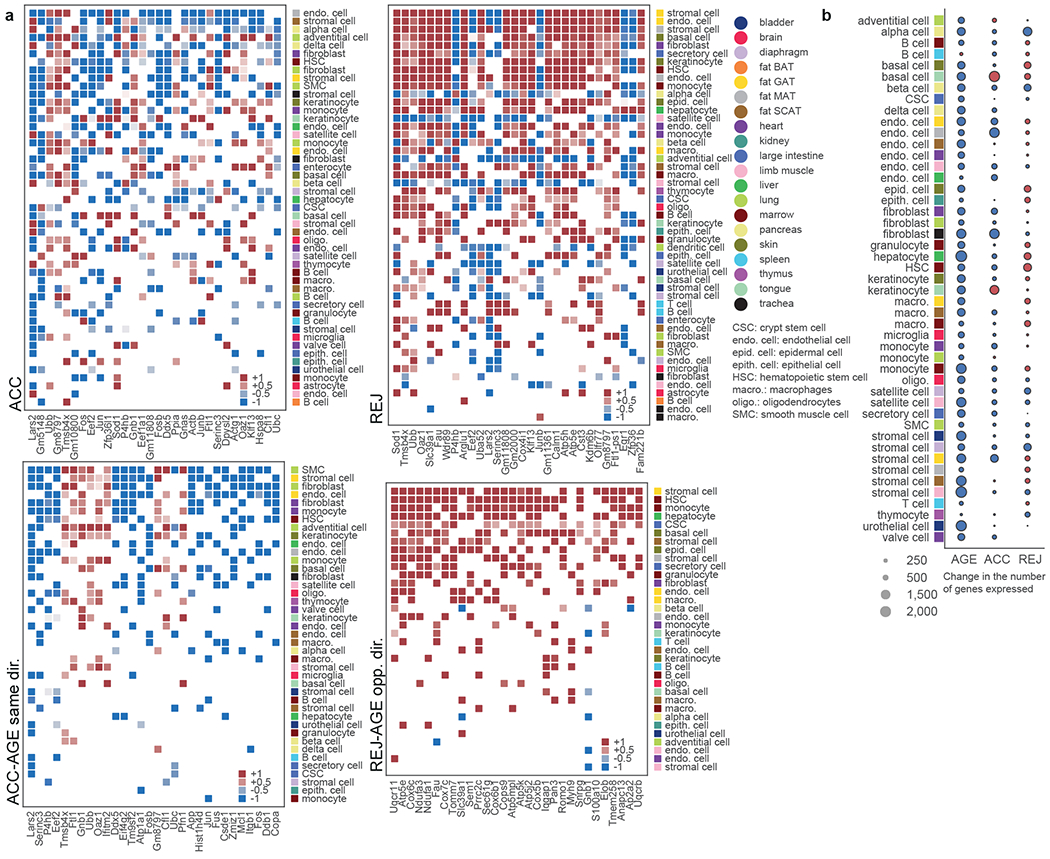
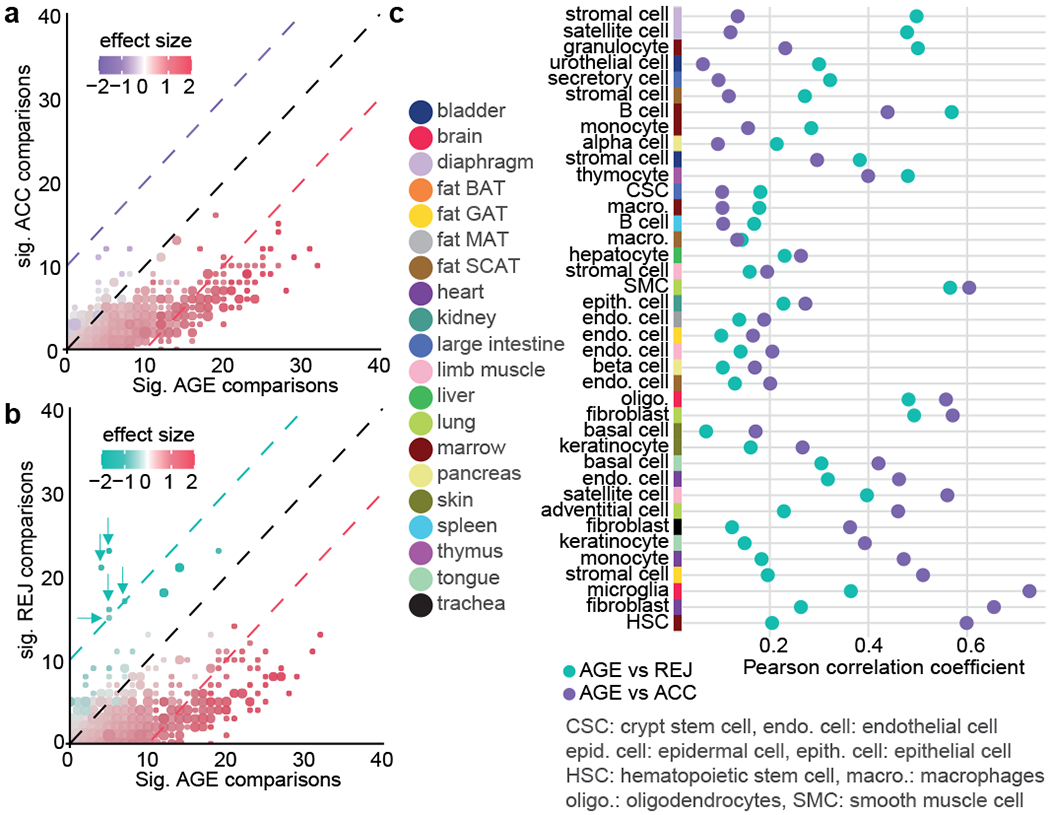
The ability to slow or reverse biological ageing would have major implications for mitigating disease risk and maintaining vitality1. Although an increasing number of interventions show promise for rejuvenation2, their effectiveness on disparate cell types across the body and the molecular pathways susceptible to rejuvenation remain largely unexplored. Here we performed single-cell RNA sequencing on 20 organs to reveal cell-type-specific responses to young and aged blood in heterochronic parabiosis. Adipose mesenchymal stromal cells, haematopoietic stem cells and hepatocytes are among those cell types that are especially responsive. On the pathway level, young blood invokes new gene sets in addition to reversing established ageing patterns, with the global rescue of genes encoding electron transport chain subunits pinpointing a prominent role of mitochondrial function in parabiosis-mediated rejuvenation. We observed an almost universal loss of gene expression with age that is largely mimicked by parabiosis: aged blood reduces global gene expression, and young blood restores it in select cell types. Together, these data lay the groundwork for a systemic understanding of the interplay between blood-borne factors and cellular integrity.


Conflict of interest statement

Competing interests

The authors declare no competing financial interests. Readers are welcome to comment on the online version of the paper.

Figures

Extended Data Fig. 1.
Extended Data Fig. 1.. Outline of data analyses and tissue specific data overview
a, Outline of computational analyses. Single-cell count data are processed per tissue, see Methods ‘Quality control’-’Cell type annotation’. Differential gene expression is then conducted per cell type and comparison (AGE, ACC, REJ) within each tissue, see Methods ‘Differential gene expression’. All of the next panels present data after quality control. b, Number of cells per tissue and replicate. Replicates are colored by their condition. c, Number of replicates per tissue. Replicates are colored by their condition. d, Total number of cells per tissue. e, Fraction of cells within each condition per tissue. f-i, For each experimental condition within each tissue: total read counts (f), the percent of reads mapped to ribosomal genes (g), mitochondrial genes (h), and ERCC spike-ins (i) plotted against the mean number of genes expressed. j, Average LISI scores of mouse replicates calculated over the batch corrected tissue specific UMAP embeddings plotted against the mean LISI scores of tissue specific UMAP embeddings calculated from neighborhood graphs without batch correction. k, Mean entropy batch mixing of mouse replicates calculated over the tissue specific batch-corrected neighborhood graph plotted against the mean entropy batch mixing calculated from neighborhood graphs without batch correction. l, Result of saturation analyses shown per condition (Y, A, IY, HY, IA, HA). Downsampling was carried out per condition within each tissue separately. Results indicate the number of detected genes as the function of the downsampled total counts.
Extended Data Fig. 2.
Extended Data Fig. 2.. Cell type specific data overview
All panels present data after quality control. a, Number of cells per cell type and replicate. Replicates are colored by their condition. b, Number of replicates per cell type. Replicates are colored by their condition. c, Total number of cells per cell type. d, Fraction of cells within each condition per cell type. e-h, For each experimental condition within each cell type, total read counts (e), the percent of reads mapped to ribosomal genes (f), mitochondrial genes (g), and ERCC spike-ins (h) plotted against the mean number of genes expressed.
Extended Data Fig. 3.
Extended Data Fig. 3.. Validation of differential gene expression analysis
a, Number of DEGs plotted against the total number of cells within the control and treatment groups. Each dot represents a DGE comparison of a cell type. b-d, Cumulative distributions of the calculated effect size (b), −log10(adj. p-value) (c) and log2 fold change values (d). Distributions are shown separately for ACC, REJ and AGE DGE. Vertical lines indicate the cutoffs applied throughout the study. e, Summary of ACC DGE results. Each cell type that has at least 50 cells in IY and HY is studied in the context of ACC and hence shown. From top to bottom: control and treatment sample sizes indicated separately for AGE and ACC, the number of genes differentially expressed in AGE and ACC, overlaps between AGE and ACC. Overlaps are normalized by the number of DEGs in the union of ACC and AGE DEGs. f, Summary of REJ DGE results. Each cell type that has at least 50 cells in IA and HA is studied in the context of REJ and hence shown. From top to bottom: control and treatment sample sizes indicated separately for AGE and REJ, the number of genes differentially expressed in AGE and REJ, overlaps between AGE and REJ. Overlaps are normalized by the number of DEGs in the union of REJ and AGE DEGs. g, Percent of DEGs that change in the same direction with AGE and ACC are plotted against the total number of DEGs within AGE and ACC for each comparison. Percentages are based on the union of DEGs as defined in (e) h, Percent of DEGs that change in the opposite direction with AGE and REJ are plotted against the total number of DEGs within AGE and REJ for each comparison. Percentages are based on the union of DEGs as defined in (f). i, Fraction of DEGs changing in the same direction with AGE and ACC plotted against the fraction of DEGs changing in the opposite direction with AGE and ACC. Each dot represents a cell type of the study. Colored area indicates where more DEGs change in the same direction than in the opposite direction. j, Fraction of DEGs changing in the same direction with AGE and REJ plotted against the fraction of DEGs changing in the opposite direction with AGE and REJ. Each dot represents a cell type of the study. Colored area indicates where more DEGs change in the opposite direction than in the same direction.
Extended Data Fig. 4.
Extended Data Fig. 4.. Validation of differential gene expression analysis
a, Violin plots showing the number of differentially expressed genes as the function of the number of replicates per comparison. The number of replicates are defined as the minimum number of replicates within the control and treatment groups. Results are shown separately for TMS (left) and parabiosis (right). b, Comparison of differential gene expression results with and without subsampling in case of each cell type specific comparison. Spearman correlation values indicate (dis)similarities between: p-values derived from the original and subsampled data (left), effect sizes calculated from the original and subsampled data (middle), and effect sizes calculated on the original data and p-values derived from the subsampled datasets. c, Number of DEGs identified at different p-value and effect size cutoffs per comparison in AGE (left), ACC (middle), and REJ (right).
Extended Data Fig. 5.
Extended Data Fig. 5.. Differential gene expression results
a, Top list of the 50 most frequent DEGs identified for ACC and REJ. Results are shown separately for up and downregulation. Columns with darker bars indicate top lists where only changes consistent with AGE are shown. These include genes changing in the same direction with ACC and AGE, as well as genes changing in the opposite direction with REJ and AGE. b, DGE results for marrow HSCs for ACC (left) and for REJ (right). from top to bottom: volcano plots (top) show top DEGs. Comparisons of log2-fold changes (middle) show changes with parabiosis on the x-axis and with normal ageing on the y-axis. DEGs with adj. p-value<0.05, eff. size>0.6 are shown. Areas where ACC and AGE change in the same direction as well as where REJ and AGE change in the opposite direction are highlighted. Top pathways (GO Biological Process) with highest ‘Combined scores’ defined as in Enrichr are shown at the bottom. c, Most enriched pathways (GO Biological Process) among the 100 most frequent DEGs shared across multiple cell types. Results shown for ACC and ACC-AGE same direction (top), and REJ and REJ-AGE opposite direction (bottom). Combined scores are defined as in Enrichr. d, Gene expression violin plots for liver hepatocytes, GAT MSCs and marrow HSCs of select genes encoding proteins of the electron transport chain. Significance values show the adj. p-values of the Wilcoxon–Mann–Whitney test (two-sided) based differential gene expression, see Methods: ‘Differential gene expression’.
Extended Data Fig. 6.
Extended Data Fig. 6.. Analyses of genes associated with the 5 OXPHOS complexes
a, Log2-fold changes with AGE, ACC and REJ of genes associated with the 5 OXPHOS complexes. Changes with adj. p-val.<0.05 and eff. size>0.6 are shown. Each column corresponds to one complex and the three separate colors distinguish between AGE, ACC and REJ. b, Spearman correlation of gene expression values with age in case of genes associated with the 5 OXPHOS complexes in the Tabula Muris Senis bulk dataset. Data has been analyzed as in. Correlation values with adj. p-value <0.05 are shown. c, Log2-fold changes with ACC and REJ of genes associated with the 5 OXPHOS complexes in the bulk parabiosis dataset.
Extended Data Fig. 7.
Extended Data Fig. 7.. Analysis of transcriptional noise
a-c, Mean number of genes expressed within each cell type, x and y axes indicate Y and A (a), IY and HY (b) and IA and HA (c), each dot represents a cell type. d-f, Cell-cell variability within each cell type in Y and A (d), IY and HY (e) and IA and HA (f), each dot represents a cell type. g-i, Overdispersion within each cell type in Y and A (g), IY and HY (h) and IA and HA (i), each dot represents a cell type.
Extended Data Fig. 8.
Extended Data Fig. 8.. Pathway analysis
a, Top 10 most differently affected pathways over all ACC tissues and cell types (top, largest difference at the top) and top 10 most differently affected pathways over all AGE (bottom, largest difference at the bottom) tissues and cell types. b, Same as for a, comparing REJ and AGE pathways. c, Heatmap showing the top 30 most strongly affected pathways in AGE, ACC and REJ in hematopoietic stem cells (HSCs) of the marrow. Pathways related to mitochondria are highlighted in green on the left. Each entry of the heatmap shows the significance level and the number of genes associated with the pathway. d, Same as for c, showing the top 30 most strongly affected pathways for beta cells of the pancreas.
Extended Data Fig. 9.
Extended Data Fig. 9.. Ageing and rejuvenation similarity analysis
a-c, AGE (a), ACC (b), and REJ (c) DGE based cosine similarity matrices of the cell types studied, see Methods section ‘Ageing and rejuvenation similarity analysis’. All matrices are clustered with complete link hierarchical clustering. d, Force-directed network visualization of the STRING links between DEGs common to MSCs from GAT, MAT, SCAT, bladder, limb muscle, and diaphragm. e, Force-directed network visualization of the STRING links between DEGs common to MSCs (GAT and MAT), hepatocytes, basal and epidermal cells (skin), and HSCs and macrophages (marrow). All links with >0.9 STRING confidence score (scale from 0-1) are queried and shown. f-g Most enriched pathways (GO Biological Process) among the nodes of the networks shown in (d-e), combined scores are defined as in Enrichr.
Fig. 1.
Fig. 1.. Cell type-specific differential gene expression
a, Experimental outline. Single cell transcriptomic data were collected from the indicated mice and tissues, see Methods. b, Uniform manifold approximation and projection visualization of the entire dataset. Cells are colored by tissue origin, see Methods ‘Data extraction’-‘Global UMAP visualization’. c, Cell types ranked by the percent/number of differentially expressed genes (DEGs) as indicated above each column (Wilcoxon–Mann–Whitney test with two-sided, adj. p-value<0.05, eff size>0.6), see Methods ‘Differential gene expression’ and ‘Analysis of the overlap of differentially expressed gene sets’. d-e, Differential gene expression results of ACC in fat GAT stromal cells (d), and REJ in liver hepatocytes (e). Volcano plots (left) show top DEGs. Comparisons of log2-fold changes (right) show changes with parabiosis on the x-axis and with normal ageing on the y-axis. Areas where ACC and AGE change in the same direction as well as where REJ and AGE change in the opposite direction are highlighted.
Fig. 2.
Fig. 2.. Young blood reverses mitochondrial & global gene expression loss
a, Most frequent DEGs shared across multiple cell types (Wilcoxon–Mann–Whitney test with two-sided adj. p-value<0.05, eff. size>0.6) and their log2-fold changes indicated for ACC (top left) and REJ (top right). DEGs shared with AGE are indicated at the bottom where: DEGs changing in the same direction with AGE and ACC (bottom left) and DEGs changing in the opposite direction with AGE and REJ (bottom right) are shown separately. b, Change of the mean number of genes expressed with AGE, ACC and REJ in case of each cell type, see Methods ‘Analysis of changes in the number of genes expressed’.
Fig. 3.
Fig. 3.. Structured responses to parabiosis
a, Scatter plot showing the number of cell types where pathways are significantly affected in ACC (y-axis) and AGE (x-axis). Pathways affected in the same number of comparisons on the x-axis and y-axis are grouped together, dot sizes show the size of the groups, see Methods ‘Pathway analysis’. b, Same as for a, comparing significantly affected pathways in REJ and AGE. Mitochondria related pathways in REJ are highlighted by arrows. c, Pearson correlation coefficient for each tissue and cell type comparing pathway profiles between indicated groups.
Fig. 4.
Fig. 4.. Coordinated, organism-wide cellular responses to ageing and parabiosis
Histograms shown of pairwise cosine similarities that are calculated between each cell type based on the cell type specific DGE signatures of AGE, ACC, and REJ, see Methods ‘Ageing and rejuvenation similarity analysis’. Each cell type is connected to its most similar cell type. Cell types of the same tissue are listed vertically, while similar cell types with different tissue of origin are listed horizontally.

References

    1. López-Otín C, Blasco MA, Partridge L, Serrano M & Kroemer G The hallmarks of aging. Cell 153, 1194 (2013). - PMC - PubMed
    1. Mahmoudi S, Xu L, & Brunet A Turning back time with emerging rejuvenation strategies. Nature cell biology, 21(1), 32–43 (2019). - PMC - PubMed
    1. Schaum N et al. Single-cell transcriptomics of 20 mouse organs creates a Tabula Muris. Nature 562, 367–372 (2018). - PMC - PubMed
    1. Schaum N et al. Ageing hallmarks exhibit organ-specific temporal signatures. Nature (2020). doi:10.1038/s41586-020-2499-y - DOI - PMC - PubMed
    1. Almanzar N et al. A single-cell transcriptomic atlas characterizes ageing tissues in the mouse. Nature 583, 590–595 (2020). - PMC - PubMed

Methods References

    1. Villeda SA et al. Young blood reverses age-related impairments in cognitive function and synaptic plasticity in mice. Nat. Med 20, 659–663 (2014). - PMC - PubMed
    1. Picelli S et al. Full-length RNA-seq from single cells using Smart-seq2. Nat. Protoc 9, 171–181 (2014). - PubMed
    1. Darmanis S et al. A survey of human brain transcriptome diversity at the single cell level. Proc. Natl. Acad. Sci. U. S. A 112, 7285–7290 (2015). - PMC - PubMed
    1. Picelli S et al. Tn5 transposase and tagmentation procedures for massively scaled sequencing projects. Genome Res. 24, 2033–2040 (2014). - PMC - PubMed
    1. Hennig BP et al. Large-scale low-cost NGS library preparation using a robust Tn5 purification and tagmentation protocol. G3 Genes, Genomes, Genet. 8, 79–89 (2018). - PMC - PubMed

Publication types