. 2022 Feb 14:15:817277.
doi: 10.3389/fncel.2021.817277. eCollection 2021.

Vav3-Deficient Astrocytes Enhance the Dendritic Development of Hippocampal Neurons in an Indirect Co-culture System

Affiliations

Vav3-Deficient Astrocytes Enhance the Dendritic Development of Hippocampal Neurons in an Indirect Co-culture System

David Wegrzyn et al. Front Cell Neurosci. .

Abstract

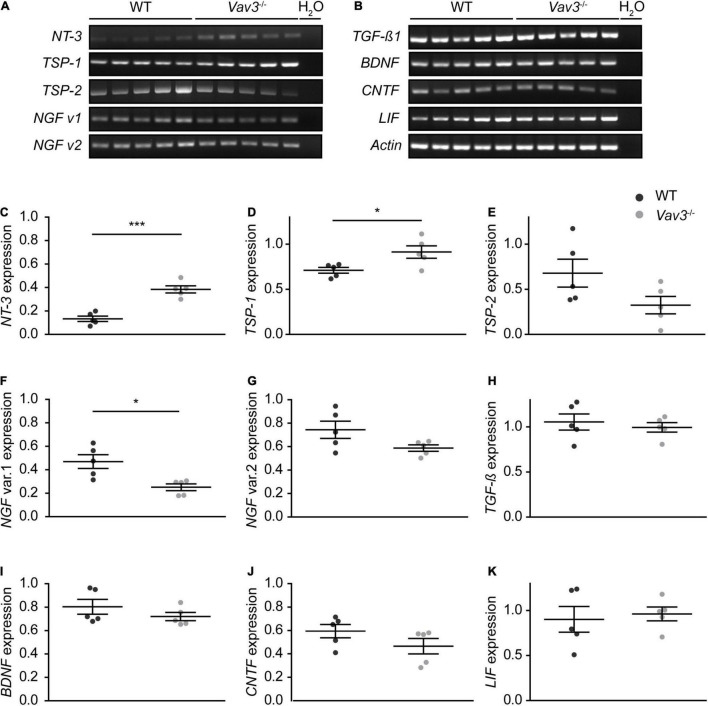
Vav proteins belong to the class of guanine nucleotide exchange factors (GEFs) that catalyze the exchange of guanosine diphosphate (GDP) by guanosine triphosphate (GTP) on their target proteins. Here, especially the members of the small GTPase family, Ras homolog family member A (RhoA), Ras-related C3 botulinum toxin substrate 1 (Rac1) and cell division control protein 42 homolog (Cdc42) can be brought into an activated state by the catalytic activity of Vav-GEFs. In the central nervous system (CNS) of rodents Vav3 shows the strongest expression pattern in comparison to Vav2 and Vav1, which is restricted to the hematopoietic system. Several studies revealed an important role of Vav3 for the elongation and branching of neurites. However, little is known about the function of Vav3 for other cell types of the CNS, like astrocytes. Therefore, the following study analyzed the effects of a Vav3 knockout on several astrocytic parameters as well as the influence of Vav3-deficient astrocytes on the dendritic development of cultured neurons. For this purpose, an indirect co-culture system of native hippocampal neurons and Vav3-deficient cortical astrocytes was used. Interestingly, neurons cultured in an indirect contact with Vav3-deficient astrocytes showed a significant increase in the dendritic complexity and length after 12 and 17 days in vitro (DIV). Furthermore, Vav3-deficient astrocytes showed an enhanced regeneration in the scratch wound heal assay as well as an altered profile of released cytokines with a complete lack of CXCL11, reduced levels of IL-6 and an increased release of CCL5. Based on these observations, we suppose that Vav3 plays an important role for the development of dendrites by regulating the expression and the release of neurotrophic factors and cytokines in astrocytes.

Keywords: CCL5; Rho-GTPases; Vav3; astrocytes; cytokines; guanine nucleotide exchange factor; hippocampal neurons; neuron-astrocyte interaction.


Conflict of interest statement

The authors declare that the research was conducted in the absence of any commercial or financial relationships that could be construed as a potential conflict of interest.

Figures

FIGURE 1
FIGURE 1
(A) Primary hippocampal neurons were cultured in an indirect co-culture setup with cortical astrocytes. In order to analyze the influence of a Vav3 deficiency in neurons and astrocytes, different combinations of Vav3 knockout neurons and astrocytes were used. First, wildtype neurons were cultured with wildtype astrocytes and served as the control condition. Furthermore, Vav3–/– neurons were combined with wildtype astrocytes for the analysis of neuron-specific effects induced by the Vav3 knockout. Last, wildtype neurons were cultured with Vav3–/– astrocytes to investigate possible positive or negative effects for native neurons. (B–D) Neurons were kept in culture for 12 days in completely defined medium without serum and formed a highly complex network. Native neurons cultured with Vav3–/– astrocytes appeared slightly more complex in comparison to the other culture combinations. (B’–D’) Additionally, neurons were cultured for a longer culturing time of 17 days since the dendrites become longer and more complex at this point in time. Scale bar: 200 μm.
FIGURE 2
FIGURE 2
(A–A”, B–B”, C–C”) After a culturing time of 12 days neurons were immunocytochemically stained with specific antibodies against the dendritic marker Map2 and the interneuron marker GAD65/67. Furthermore DAPI was used for the visualization of nuclei. The GAD65/67 positive neurons were excluded from the analysis since interneurons have a highly differing morphology in comparison to pyramidal neurons and might falsify the experimental outcome. Three exemplary neurons are depicted per condition. (A”’–C”’) A Sholl analysis was performed for determining the dendritic complexity. The projections depict the skeletonized dendrites and red areas represent a high number of intersections while blue regions represent a low number of intersections, (D–F) The quantification of the Sholl analysis could show that especially wildtype neurons cultured with Vav3–/– astrocytes developed more complex dendrites than neurons of both other conditions. (G) The quantification of the dendritic lengths revealed a significant increase in Vav3–/– neurons cultured with wildtype astrocytes and in native neurons cultured with Vav3–/– astrocytes in comparison to the controls. Dots are representing single analyzed dendrites. (H) In contrast, the number of dendrites was slightly reduced in the cultures consisting of wildtype neurons combined with Vav3–/– astrocytes. Dots are representing individual neurons analyzed regarding their number of dendrites. Statistics: For the Sholl analysis five experimental repetitions (N = 5) were performed for the culture combinations WT(N)/WT(A) and Vav3–/– (N)/WT(A) while three experimental repetitions (N = 3) were performed for the combination WT(N)/Vav3–/– (A). Furthermore, 40 neurons (n = 40) were recorded and analyzed per experimental repetition. For the dendritic lengths and numbers 3 experimental repetitions (N = 3) were performed with 20 quantified neurons (n = 20) per repetition. Kruskal-Wallis test with a following Dunn’s multiple comparison test; *p ≤ 0.05, **p ≤ 0.01 and ***p ≤ 0.001, data are represented as mean ± SEM. Scale bar: 50 μm.
FIGURE 3
FIGURE 3
(A–A”,B–B”,C–C”) Neurons of the different combinations were fixed after a culturing time of 17 days and immunostained against Map2 and GAD65/67. As previously mentioned GAD65/67 positive neurons were excluded from the analysis since interneurons possess a strongly differing morphology compared to pyramidal neurons. DAPI was utilized for the visualization of nuclei. Three exemplary neurons are shown per condition. (A”’–C”’) The Sholl projection represents the skeletonized dendrites and depicts highly branched regions with a red labeling while less branched regions are marked by a blue labeling. (D–F) After a culturing time of 17 days in vitro wildtype neurons which were kept in culture with Vav3–/– astrocytes showed a significantly increase in the number of intersections at nearly all analyzed distances from the soma. Furthermore, Vav3–/– neurons developed a higher number of intersections in the distal part of the dendrites. (G) Vav3–/– neurons cultured with wildtype astrocytes showed a significantly reduced dendritic length in comparison to both other conditions. Dots are representing single analyzed dendrites. (H) The quantification of the number of dendrites revealed no significant differences between all analyzed conditions. Dots are representing individual neurons analyzed for their number of dendrites. As already described in Figure 2 five experimental repetitions (N = 5) were performed for the culture combinations WT(N)/WT(A) and Vav3–/–(N)/WT(A) while three experimental repetitions (N = 3) were performed for the combination WT(N)/Vav3–/–(A) for the Sholl analysis. Furthermore, 40 neurons (n = 40) were recorded and analyzed per experimental repetition. For the dendritic lengths and numbers 3 experimental repetitions (N = 3) were performed with 20 quantified neurons (n = 20) per repetition. Kruskal-Wallis test with a following Dunn’s multiple comparison test; *p ≤ 0.05, **p ≤ 0.01 and ***p ≤ 0.001, data are represented as mean ± SEM. Scale bar: 50 μm.
FIGURE 4
FIGURE 4
(A,B) Wildtype and Vav3–/– astrocytes were lysed and a RT-PCR analysis with primers for different neurotrophic factors was performed. The signal intensity of NT-3 appeared stronger in Vav3–/– astrocytes compared to wildtype astrocytes. Furthermore, there was a slightly reduced signal intensity of the transcript variant 1 of NGF in Vav3–/– astrocytes. (C–K) The signal intensity of the PCR bands was set in relation to the actin positive control and compared between both groups. The quantification revealed a significantly increased expression of NT-3 and TSP-1 while the transcript variant of NGF was reduced. The expression of all other analyzed neurotrophic factors was unchanged in the knockout condition. Individual dots are representing the signal intensity of every sample in relation to actin Statistics: in total, five independent experimental repetitions (N = 5) were performed and one lysed sample (n = 1) per repetition was used for the PCRs. Unpaired t-test; *p ≤ 0.05, **p ≤ 0.01 and ***p ≤ 0.001, data are represented as mean ± SEM.
FIGURE 5
FIGURE 5
(A) Serum-free neuronal medium was conditioned for 24 h with the secreted factors of wildtype and Vav3–/– astrocytes. Then, cytokine arrays were used in order to determine the cytokine and chemokine profiles of both groups. The conditioned medium of Vav3–/– astrocytes revealed an altered profile with a lack of CXCL11, reduced levels of IL-6 and increased levels of CCL5 (indicated by red boxes). (B) A total number of 20 cytokines and chemokines could be detected in the supernatants and are depicted in the heatmap. The individual numbers on the membranes are defined by the corresponding cytokine and chemokine names in the heatmap. A low cytokine level is represented by a white color while a strong level is represented by dark red colors. As indicated by the bold boxes, the conditioned medium of Vav3–/– astrocytes showed a lack of CXCL11, increased concentrations of CCL5 and reduced levels of IL-6. (C–Q) The statistical analysis of the cytokine array confirmed these observations. Since the concentrations of Trem1, CCL1, G-CSF, M-CSF, and CCL12 were exceedingly low in the supernatants they were shown in detail by diagrams. The exact values can be found in the result part 3.3. Statistics: Three experimental repetitions (N = 3) were performed, and two technical replicates (n = 2) were considered per repetition. Unpaired t-test, *p ≤ 0.05, **p ≤ 0.01 and ***p ≤ 0.001, data are represented as mean ± SEM.
FIGURE 6
FIGURE 6
(A–D,A’–D’) Wildtype and Vav3–/– astrocytes were tested regarding their migration behavior in a scratch wound healing assay. Phase contrast images were taken immediately after performing the scratch (0 h) and after 24, 48, and 72 h. (E–H) The scratch area was visibly smaller in the Vav3–/– astrocyte cultures after 24 and 72 h, although the initially performed scratch was greater in these cultures. (I) RT-PCR analysis confirmed the absence of Vav3–/– in cultured astrocytes. (J) Furthermore, the expression of Vav3 was significantly reduced in wildtype cultures after performing the scratch. Statistics: In total, five experimental repetitions (N = 5) were performed for the scratch wound healing assay. Here, 6 phase contrast images (n = 6) were recorded and quantified per experimental repetition. For the Vav3 RT-PCR also five experimental repetitions (N = 5) and one sample per preparation (n = 1) were used. Unpaired t-test, *p ≤ 0.05, **p ≤ 0.01 and ***p ≤ 0.001, data are represented as mean ± SEM. Scale bar: 200 μm.
FIGURE 7
FIGURE 7
The graphical abstract depicts that Vav3–/– astrocytes promote the branching and the elongation of dendrites on wildtype neurons in an indirect co-culture system. Knockout astrocytes show a higher secretion of the chemokine CCL5 which has a neurotropic potential. Contrary, the pro-inflammatory cytokine IL-6 is released in lower amounts. In contrast to wildtype astrocytes, Vav3–/– astrocytes do not release CXCL11. On mRNA level Vav3–/– astrocytes express more NT-3 and TSP-1.

Similar articles

Cited by

References

    1. Ahnert-Hilger G., Höltje M., Grosse G., Pickert G., Mucke C., Nixdorf-Bergweiler B., et al. (2004). Differential effects of Rho GTPases on axonal and dendritic development in hippocampal neurones. J. Neurochem. 90 9–18. 10.1111/j.1471-4159.2004.02475.x - DOI - PubMed
    1. Ajoy R., Lo Y.-C., Ho M.-H., Chen Y.-Y., Wang Y., Chen Y.-H., et al. (2021). CCL5 promotion of bioenergy metabolism is crucial for hippocampal synapse complex and memory formation. Mol. Psychiatry 26 6451–6468. 10.1038/s41380-021-01103-3 - DOI - PMC - PubMed
    1. Aleksic B., Kushima I., Hashimoto R., Ohi K., Ikeda M., Yoshimi A., et al. (2013). Analysis of the VAV3 as candidate gene for schizophrenia: evidences from voxel-based morphometry and mutation screening. Schizophr. Bull. 39 720–728. 10.1093/schbul/sbs038 - DOI - PMC - PubMed
    1. Aoki K., Nakamura T., Fujikawa K., Matsuda M. (2005). Local phosphatidylinositol 3,4,5-trisphosphate accumulation recruits Vav2 and Vav3 to activate Rac1/Cdc42 and initiate neurite outgrowth in nerve growth factor-stimulated PC12 cells. Mol. Biol. Cell 16 2207–2217. 10.1091/mbc.e04-10-0904 - DOI - PMC - PubMed
    1. Bardehle S., Krüger M., Buggenthin F., Schwausch J., Ninkovic J., Clevers H., et al. (2013). Live imaging of astrocyte responses to acute injury reveals selective juxtavascular proliferation. Nat. Neurosci. 16 580–586. 10.1038/nn.3371 - DOI - PubMed