. 2022 Feb 14:13:815968.
doi: 10.3389/fendo.2022.815968. eCollection 2022.

Effects of Androgen Excess-Related Metabolic Disturbances on Granulosa Cell Function and Follicular Development

Affiliations

Effects of Androgen Excess-Related Metabolic Disturbances on Granulosa Cell Function and Follicular Development

Baoying Liao et al. Front Endocrinol (Lausanne). .

Abstract

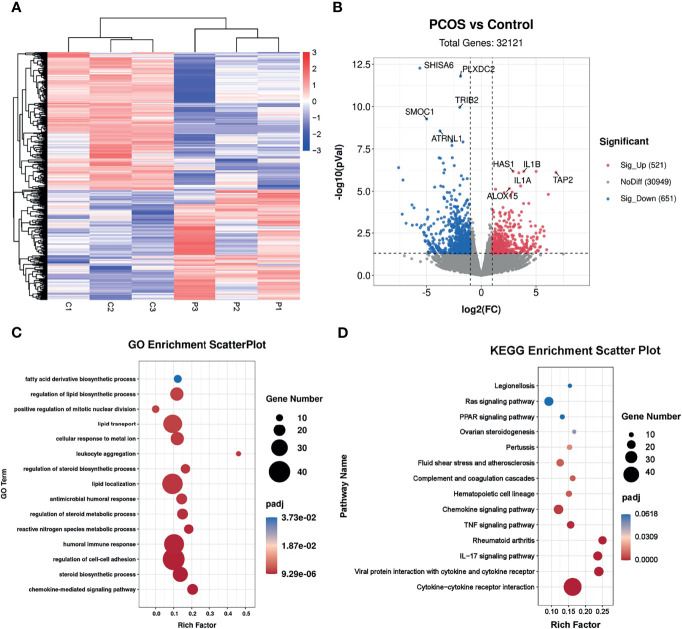
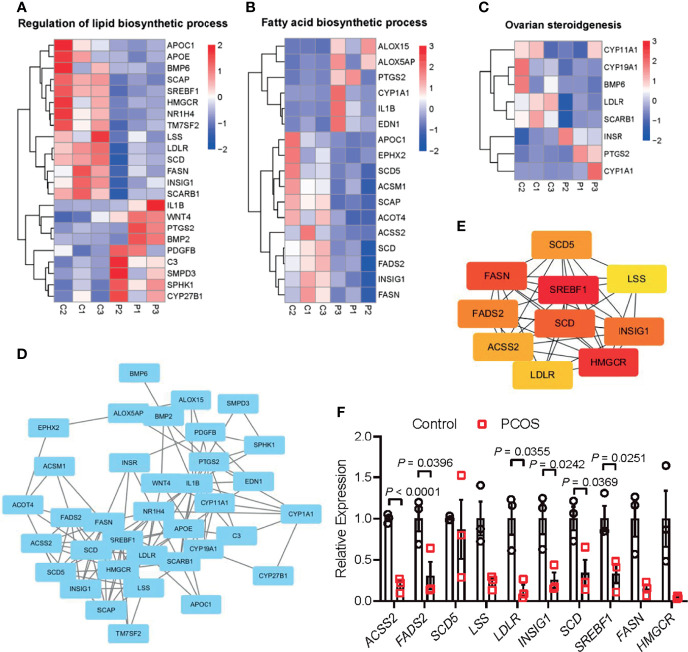
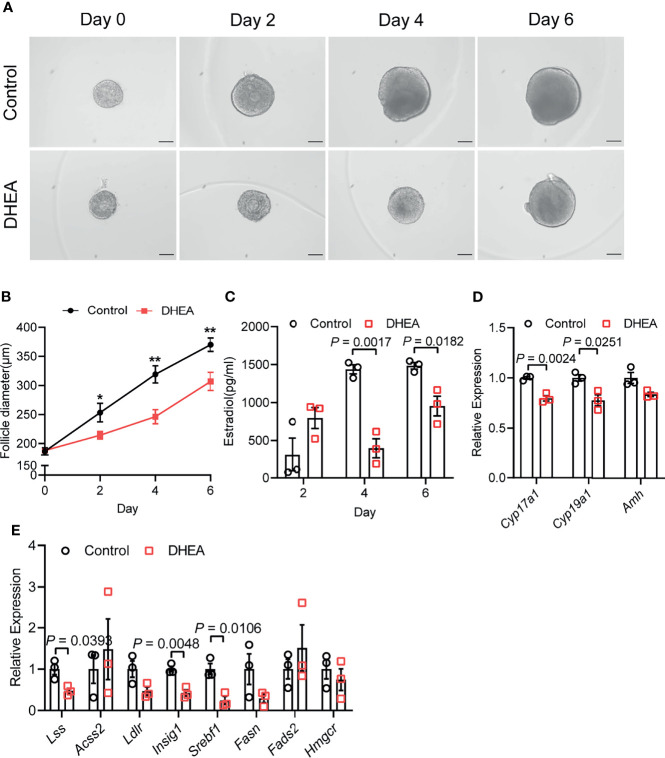
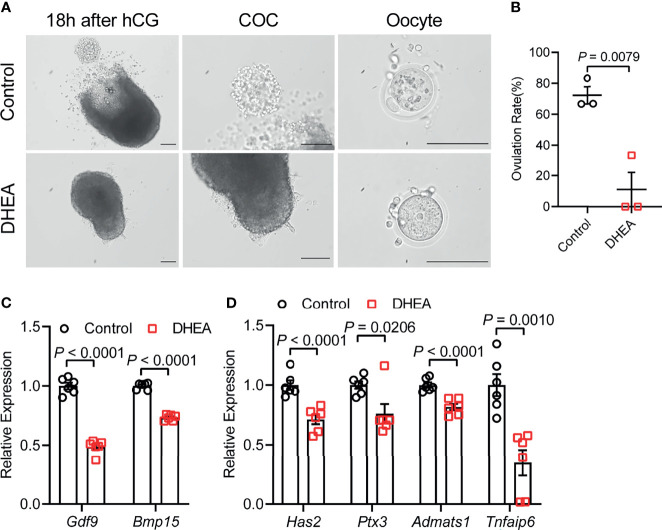
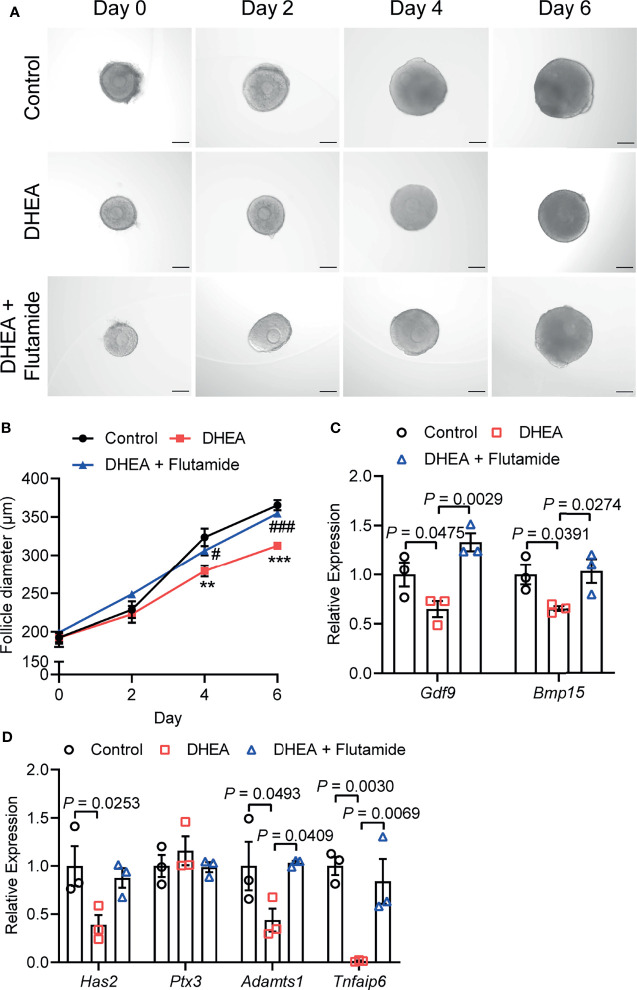
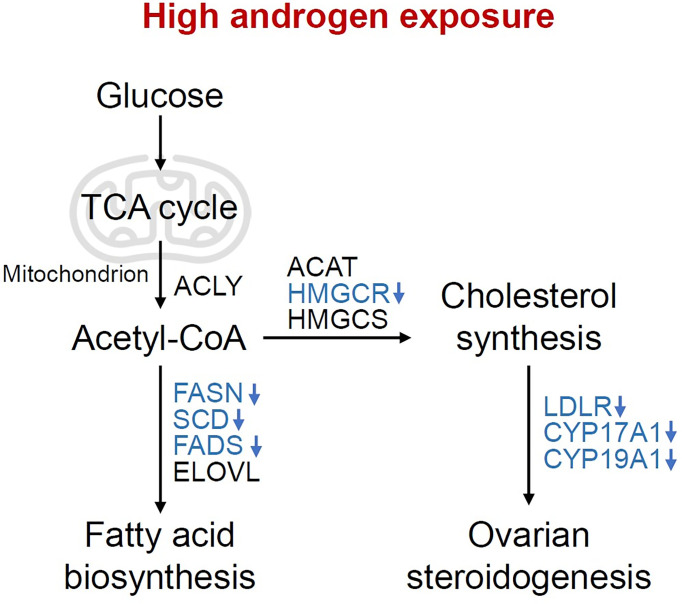
Polycystic ovary syndrome (PCOS) is a common reproductive endocrine disease in women of reproductive age. Ovarian dysfunction including abnormal steroid hormone synthesis and follicular arrest play a vital role in PCOS pathogenesis. Hyperandrogenemia is one of the important characteristics of PCOS. However, the mechanism of regulation and interaction between hyperandrogenism and ovulation abnormalities are not clear. To investigate androgen-related metabolic state in granulosa cells of PCOS patients, we identified the transcriptome characteristics of PCOS granulosa cells by RNA-seq. Gene ontology (GO) and Kyoto Encyclopedia of Genes and Genomes (KEGG) analysis of differentially expressed genes (DEGs) revealed that genes enriched in lipid metabolism pathway, fatty acid biosynthetic process and ovarian steroidogenesis pathway were abnormally expressed in PCOS granulosa cells in comparison with that in control. There are close interactions among these three pathways as identified by analysis of the protein-protein interaction (PPI) network of DEGs. Furthermore, in vitro mouse follicle culture system was established to explore the effect of high androgen and its related metabolic dysfunction on follicular growth and ovulation. RT-qPCR results showed that follicles cultured with dehydroepiandrosterone (DHEA) exhibited decreased expression levels of cumulus expansion-related genes (Has2, Ptx3, Tnfaip6 and Adamts1) and oocyte maturation-related genes (Gdf9 and Bmp15), which may be caused by impaired steroid hormone synthesis and lipid metabolism, thus inhibited follicular development and ovulation. Furthermore, the inhibition effect of DHEA on follicle development and ovulation was ameliorated by flutamide, an androgen receptor (AR) antagonist, suggesting the involvement of AR signaling. In summary, our study offers new insights into understanding the role of androgen excess induced granulosa cell metabolic disorder in ovarian dysfunction of PCOS patients.

Keywords: follicular development; in vitro follicle culture; metabolic disorders; ovarian dysfunction; polycystic ovary syndrome.


Conflict of interest statement

The authors declare that the research was conducted in the absence of any commercial or financial relationships that could be construed as a potential conflict of interest.

Figures

Figure 1
Figure 1
Identification of the transcriptional landscapes of PCOS granulosa cells. (A) Heatmap of differential expressed genes in the control and PCOS granulosa cells. (B) Volcano plot showing transcriptomic landscapes in control and PCOS group. Significant differentially expressed genes (DEGs) were examined with padj (adjusted p-value) < 0.05. Meanwhile, log2 fold change >1 was set as the threshold for significant differential expression. (C) GO enrichment analysis showing 15 pathways from the top 50 pathways enriched in PCOS granulosa cells; (D) KEGG pathway analysis showing the top 15 pathways involved in PCOS pathogenesis.
Figure 2
Figure 2
Interaction between metabolic disorders and ovarian steroidogenesis in PCOS granulosa cells. (A) Heatmap of differential expressed genes involved in the fatty acid biosynthetic process, (B) lipid metabolism, (C) ovarian steroidogenesis in the PCOS group and control group. (D) Protein–protein interaction (PPI) network between fatty acid biosynthetic process, lipid metabolism, and ovarian steroidogenesis. (E) Ten hub genes (SREBF1, HMGCR, FASN, SCD, INSIG1, FADS2, SCD5, ACSS2, LDLR, and LSS) in the PPI network. (F) mRNA expression levels of 10 hub genes (SREBF1, HMGCR, FASN, SCD, INSIG1, FADS2, SCD5, ACSS2, LDLR, and LSS) in granulosa cells from control and women with PCOS, N = 3. Data were analyzed by two-tailed Student’s t-test (F). All data are presented as the Mean ± SEM.
Figure 3
Figure 3
DHEA impaired mouse follicular growth and steroidogenesis in vitro. (A) Representative micrograph of mouse follicles cultured in vitro. (B) Follicle diameters in control and DHEA group, N = 9. (C) Estradiol levels in the supernatant of control and DHEA-treated follicles, N = 3. (D) mRNA expression levels of Cyp17a1, Cyp19a1, and Amh in follicles cultured in vitro, N = 3. (E) mRNA expression levels of Lss, Acss2, Ldlr, Insig1, Srebf1, Fasn, Fads2, and Hmgcr in follicles cultured in vitro, N = 3. Scale bar: 100 μm. Data were analyzed by two-tailed Student’s t-test (B–E). All data are presented as the Mean ± SEM. *P < 0.05, **P < 0.01.
Figure 4
Figure 4
Supplementation of DHEA inhibited ovulation via obstructing cumulus expansion. (A) The representative micrograph of follicles, ovulated COCs and oocytes after 18 h of maturation. Oocyte with first polar body extrusion was classified as mature oocyte. (B) Ovulation rate of in vitro cultured follicles, N = 3. (C) mRNA expression levels of Gdf9, Bmp15 and (D) Has2, Ptx3, Tnfaip6 and Adamts1 in follicles cultured in vitro, N = 6. Scale bar: 100 μm. Data were analyzed by two-tailed Mann–Whitney U-test or the Kruskal–Wallis test followed by Dunn’s post hoc test (B) and two-tailed Student’s t-test (C, D). All data are presented as the Mean ± SEM.
Figure 5
Figure 5
Flutamide reversed DHEA-induced impairment of mouse follicular growth and ovulation in vitro. (A) Representative micrograph of mouse follicles cultured in vitro. (B) Follicle diameters in control, DHEA and DHEA + Flutamide group, N = 7. **P < 0.01, ***P < 0.001 versus Control; #P < 0.05, ###P < 0.001 versus DHEA. (C) mRNA expression levels of Gdf9, Bmp15 and (D) Has2, Ptx3, Tnfaip6 and Adamts1 in follicles cultured in vitro, N = 3. Scale bar: 100 μm. Data were analyzed by one-way ANOVA with Tukey’s post hoc test (B–D). All data are presented as the Mean ± SEM.
Figure 6
Figure 6
Changes of metabolic pathways in granulosa cells under high androgen exposure. Overview of the pathways and enzymes involved in the synthesis of fatty acids, cholesterol and ovarian steroid hormone. The enzymes enriched in the present study are indicated in blue. TCA cycle, tricarboxylic acid cycle; ACLY, ATP-citrate lyase; ACAT, acetyl-CoA acetyltransferase; HMGCR, 3-hydroxy-3-methylglutaryl-CoA reductase; HMGCS, 3-hydroxy-3-methylglutaryl-CoA synthase; FASN, fatty acid synthase; SCD, stearoyl-CoA desaturase; FADS, fatty acid desaturase; ELOVL, fatty acid elongase; LDLR, Low density lipoprotein receptor; CYP17A1, Cytochrome P450 17A1; CYP19A1, Cytochrome P450 19A1.

Similar articles

Cited by

References

    1. Norman RJ, Dewailly D, Legro RS, Hickey TE. Polycystic Ovary Syndrome. Lancet (2007) 370(9588):685–97. doi: 10.1016/S0140-6736(07)61345-2 - DOI - PubMed
    1. Escobar-Morreale HF. Polycystic Ovary Syndrome: Definition, Aetiology, Diagnosis and Treatment. Nat Rev Endocrinol (2018) 14(5):270–84. doi: 10.1038/nrendo.2018.24 - DOI - PubMed
    1. El-Hayek S, Yang Q, Abbassi L, FitzHarris G, Clarke HJ. Mammalian Oocytes Locally Remodel Follicular Architecture to Provide the Foundation for Germline-Soma Communication. Curr Biol (2018) 28(7):1124–31.e3. doi: 10.1016/j.cub.2018.02.039 - DOI - PMC - PubMed
    1. Li R, Albertini DF. The Road to Maturation: Somatic Cell Interaction and Self-Organization of the Mammalian Oocyte. Nat Rev Mol Cell Biol (2013) 14(3):141–52. doi: 10.1038/nrm3531 - DOI - PubMed
    1. Li L, Zhu S, Shu W, Guo Y, Guan Y, Zeng J, et al. . Characterization of Metabolic Patterns in Mouse Oocytes During Meiotic Maturation. Mol Cell (2020) 80(3):525–40.e9. doi: 10.1016/j.molcel.2020.09.022 - DOI - PMC - PubMed

Publication types