. 2022 Feb 14:13:839796.
doi: 10.3389/fimmu.2022.839796. eCollection 2022.

Activation of RARα Receptor Attenuates Neuroinflammation After SAH via Promoting M1-to-M2 Phenotypic Polarization of Microglia and Regulating Mafb/Msr1/PI3K-Akt/NF-κB Pathway

Affiliations

Activation of RARα Receptor Attenuates Neuroinflammation After SAH via Promoting M1-to-M2 Phenotypic Polarization of Microglia and Regulating Mafb/Msr1/PI3K-Akt/NF-κB Pathway

Yang Tian et al. Front Immunol. .

Abstract

Background and purpose: Subarachnoid hemorrhage (SAH) is a life-threatening subtype of stroke with high rates of mortality. In the early stages of SAH, neuroinflammation is one of the important mechanisms leading to brain injury after SAH. In various central nervous system diseases, activation of RARα receptor has been proven to demonstrate neuroprotective effects. This study aimed to investigate the anti-inflammatory effects of RARα receptor activation after SAH.

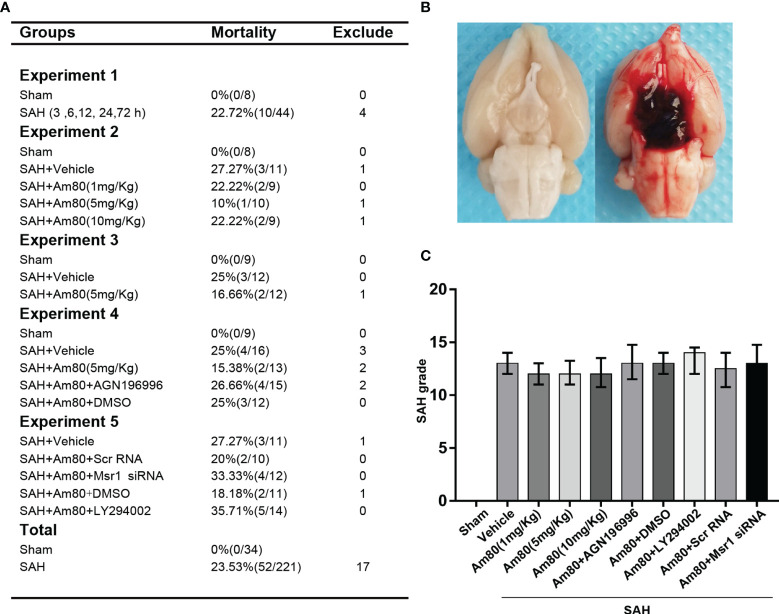
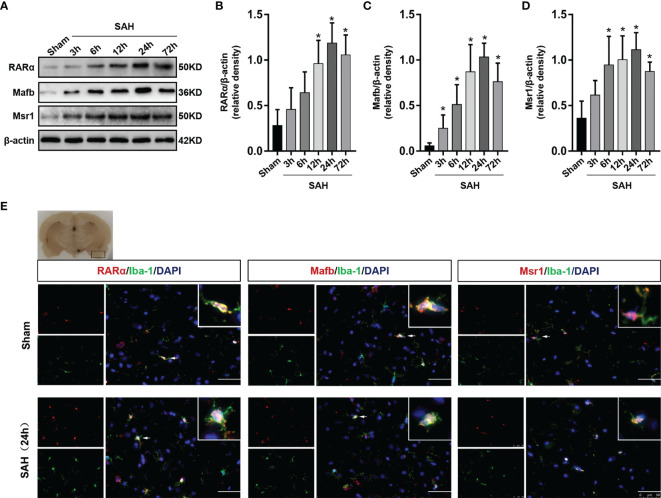
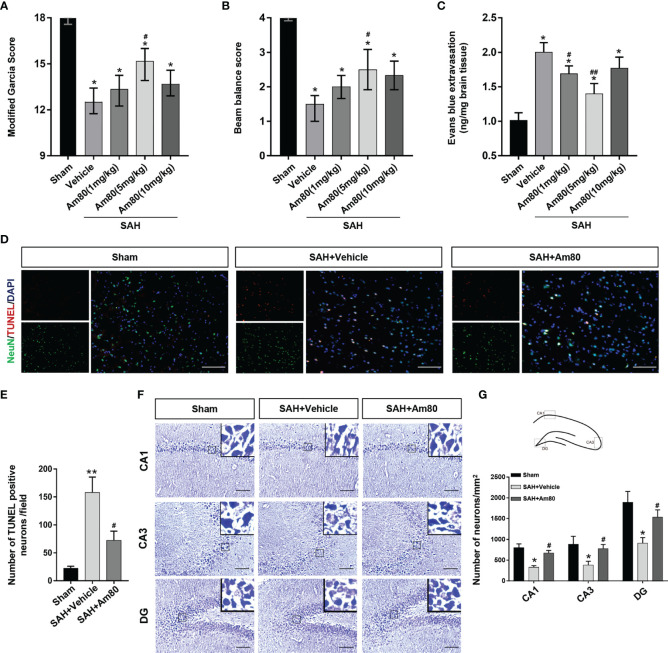
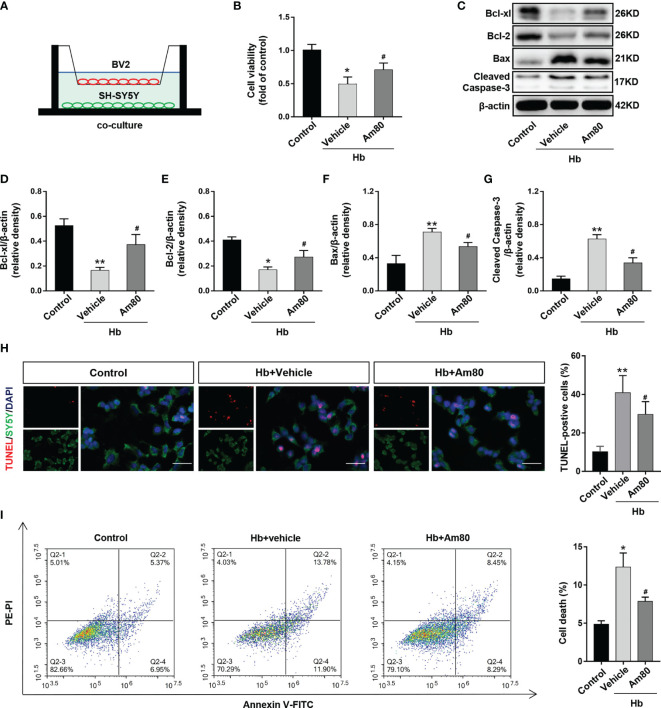
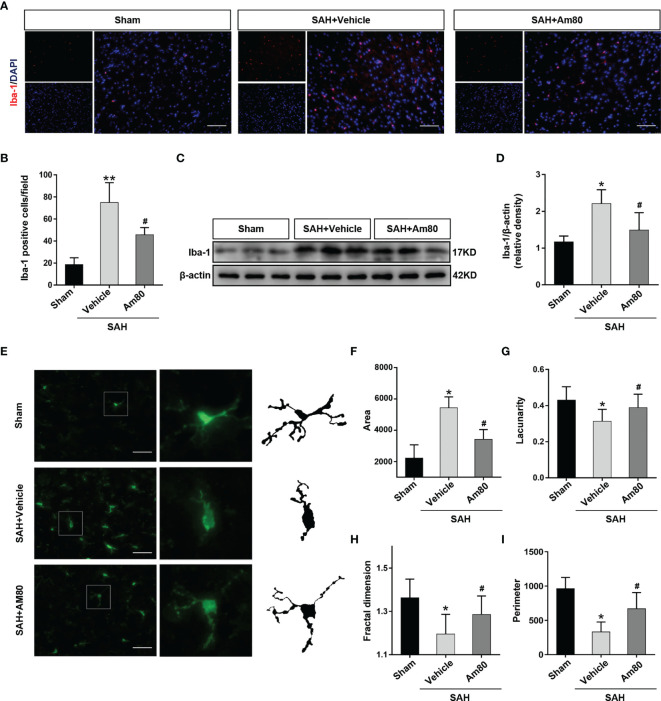
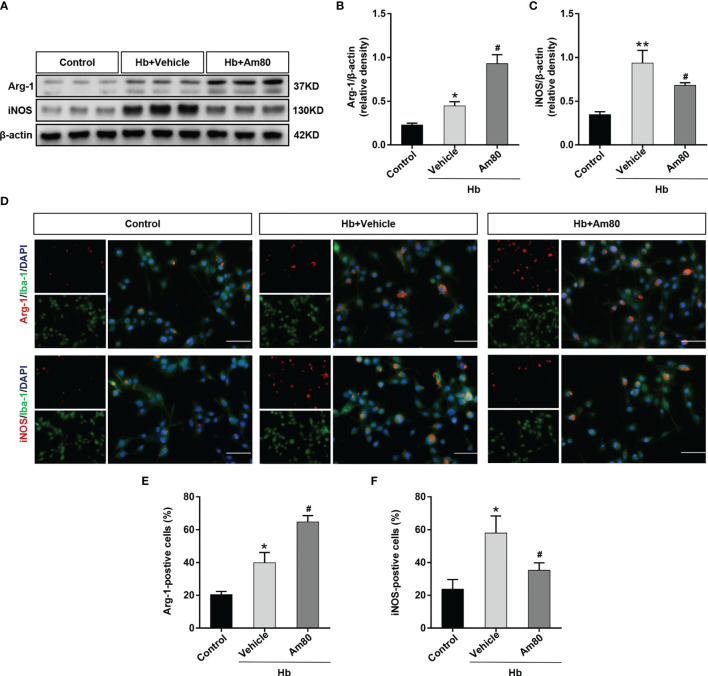
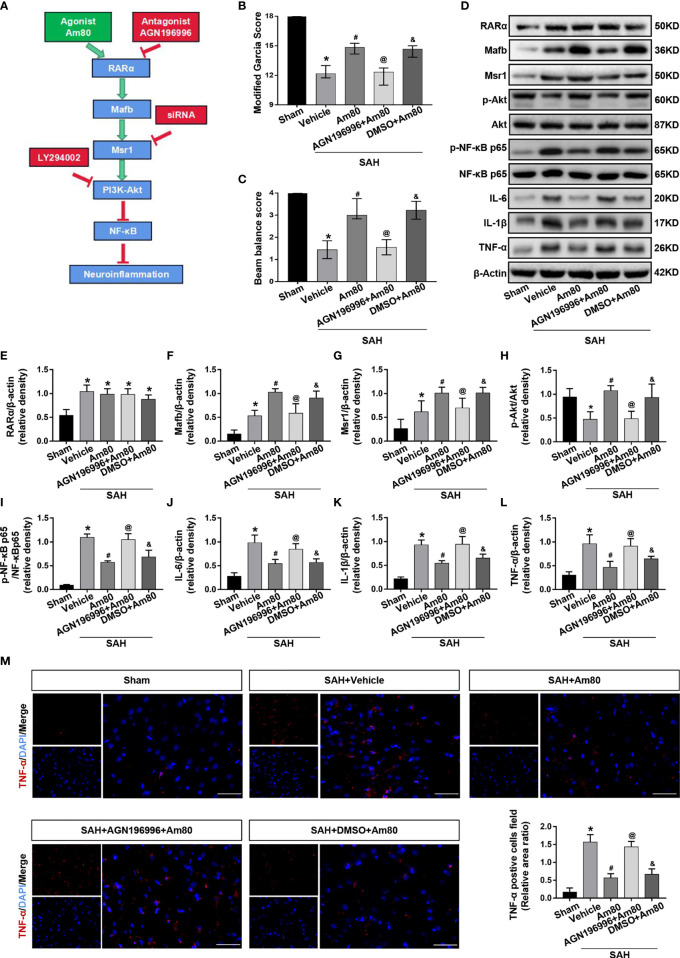
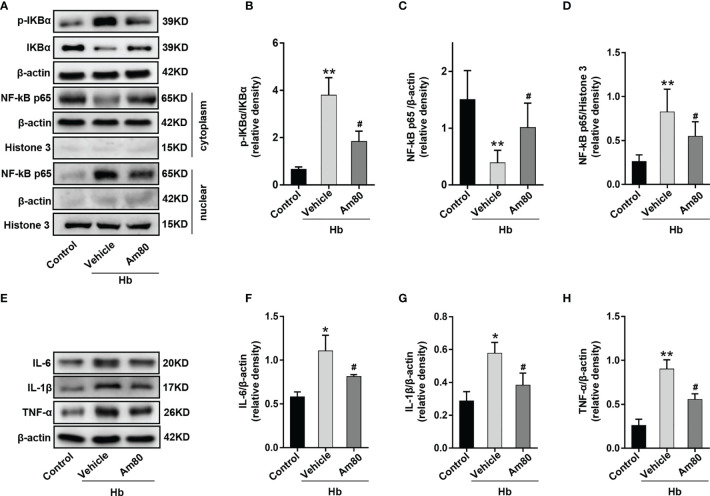
Methods: Internal carotid artery puncture method used to established SAH model in Sprague-Dawley rats. The RARα specific agonist Am80 was injected intraperitoneally 1 hour after SAH. AGN196996 (specific RARα inhibitor), Msr1 siRNA and LY294002 (PI3K-Akt inhibitor) were administered via the lateral ventricle before SAH. Evaluation SAH grade, neurological function score, blood-brain barrier permeability. BV2 cells and SH-SY5Y cells were co-cultured and stimulated by oxyhemoglobin to establish an in vitro model of SAH. RT-PCR, Western blotting, and immunofluorescence staining were used to investigate pathway-related proteins, microglia activation and inflammatory response. Results: The expression of RARα, Mafb, and Msr1 increased in rat brain tissue after SAH. Activation of the RARα receptor with Am80 improved neurological deficits and attenuated brain edema, blood brain barrier permeability. Am80 increased the expression of Mafb and Msr1, and reduced neuroinflammation by enhancing the phosphorylation of Akt and by inhibiting the phosphorylation of NF-κB. AGN196996, Msr1 siRNA, and LY294002 reversed the therapeutic effects of Am80 by reducing the expression of Msr1 and the phosphorylation of Akt. In vitro model of SAH, Am80 promoted M1-to-M2 phenotypic polarization in microglia and suppressed the nuclear transcription of NF-κB.

Conclusion: Activation of the RARα receptor attenuated neuroinflammation by promoting M1-to-M2 phenotypic polarization in microglia and regulating the Mafb/Msr1/PI3K-Akt/NF-κB pathway. RARα might serve as a potential target for SAH therapy.

Keywords: Msr1; neuroinflammation; retinoic acid receptor α; subarachnoid hemorrhage; tamibarotene.


Conflict of interest statement

The authors declare that the research was conducted in the absence of any commercial or financial relationships that could be construed as a potential conflict of interest.

Figures

Figure 1
Figure 1
Images of mortality, brain tissues and SAH grading in rats. (A) Animal usage and mortality. (B) Representative Image showing that blood clot in the subarachnoid space of the rat at 24 h after SAH. (C) SAH grading scores in each group. Error bars are represented as medians with interquartile range and analyzed by the Kruskal-Wallis test followed by Dunn’s post hoc test.
Figure 2
Figure 2
Expression changes of RARα, Mafb and Msr1. (A–D) Representative Western blot bands of time course and quantitative analyses for RARα, Mafb, and Msr1. n = 6 per group. *P< 0.05 vs Sham group. (E) Representative images of double immunofluorescence staining for RARα, Mafb and Msr1 with microglia at 24 h after SAH. n = 3 per group. Scale bar = 50 μm.
Figure 3
Figure 3
Am80 attenuated neurological deficits, neuronal apoptosis, and BBB permeability at 24 h after SAH. Moreover, Am80 reduced hippocampus injury 14 days after SAH. (A, B) The modified Garcia and beam balance scores of each group. n = 6 per group. (C) Quantification of Evans blue extravasation at 24 h after SAH. (D) Representative images of TUNEL staining (red) in neurons (NeuN, green). (E) Quantitative analyses of TUNEL-positive cells. Scale bar = 100 μm. n=3 per group. (F) Representative images of Nissl staining in the CA1, CA3, and DG regions. (G) Upper middle indicates the hippocampus division and location of staining. Quantitative analyses of Nissl staining. n=3 per group. Scale bar = 100 μm. *P < 0.05 vs sham group; **P < 0.01 vs sham group; # P < 0.05 vs SAH+vehicle group; ## P < 0.05 vs SAH+vehicle group.
Figure 4
Figure 4
Am80 attenuated neuronal apoptosis in vitro SAH model. (A) Illustration of the co-culture system. (B) Quantitative analyses of cell viability as detected by CCK8 assays. n=3 per group. (C–G) Western blotting and quantitative analyses of the expression of Bcl-xl, Bcl-2, Bax, and cleaved-caspase 3 of SH-SY5Y after co-cultivation. n=3 per group. (H) Immunofluorescence staining of TUNEL (red) and SH-SY5Y (green) in an in vitro co-culture system. Scale bar=50 μm. n=3 per group. (I) Representative flow cytometry images of SH-SY5Y cells, the necroptosis is represented by the ratio of PI +/annexin V+. n=3 per group. *P < 0.05 vs control group; **P < 0.01 vs control group; # P < 0.05 vs Hb+vehicle group.
Figure 5
Figure 5
Am80 attenuated the excessive activation of microglia after SAH. (A, B) Immunofluorescence staining and quantitative analysis of activated microglia (Iba-1). Scale bar = 100 μm. n = 3 per group. (C, D) Western blotting and quantitative analyses of Iba-1 expression. n=6 per group. (E–I) Representative images of activated-microglia (green) used for the measurement of morphological parameters and quantification analysis, including area, lacunarity, fractal dimension and perimeter in the basal cortex. Scale bar = 50 μm. n=6 per group. *P < 0.05 vs sham group; **P < 0.01 vs sham group; # P < 0.05 vs SAH+vehicle group.
Figure 6
Figure 6
Am80 promoted M1-to-M2 phenotypic polarization of microglia in an in vitro model of SAH. (A–C) Western blotting and quantitative analyses Arg-1 and iNOS expression of microglia in an in vitro co-culture system. n=3 per group. (D–F) Immunofluorescence staining of Arg-1/iNOS and microglia in an in vitro co-culture system and quantitative analyses of Arg-1/iNOS positive cells. Scale bar=50 μm. n = 3 per group. *P < 0.05 vs control group; **P < 0.01 vs control group; # P < 0.05 vs Hb+vehicle group.
Figure 7
Figure 7
AGN196996 abolished the protective effects of Am80. (A) Schematic diagram of experimental design. (B, C) The neurological score were evaluated at 24 h after SAH. n = 6 per group. (D–L) Western blotting and quantitative analyses of the expression of RARα, Mafb, Msr1, p-Akt, p-NF-kB, IL-6, IL-1β and TNF-α. n = 6 per group. (M) Immunofluorescence staining and quantitative analyses of TNF-α-positive cells field ratio. Scale bar=50 μm. n = 3 per group. *P < 0.05 vs sham group; # P < 0.05 vs SAH+vehicle group; @ P < 0.05 vs SAH+Am80 group; & P < 0.05 vs SAH+AGN196996+Am80 group.
Figure 8
Figure 8
Msr1 siRNA and LY294002 abolished the anti-neuroinflammation effects of Am80. (A, B) The neurological score were evaluated at 24 h after SAH. n = 6 per group. (C–J) Western blotting and quantitative analyses of the expression of Mafb, Msr1, p-Akt, p-NF-kB, IL-6, IL-1β and TNF-α. n = 6 per group. (K) Immunofluorescence staining and quantitative analyses of TNF-α-positive cells field ratio. Scale bar = 50 μm. n=3 per group. *P < 0.05 vs SAH group; # P < 0.05 vs SAH+Scr siRNA+Am 80 group; & P < 0.05 vs SAH+DMSO+Am 80 group.
Figure 9
Figure 9
Am80 administration suppressed the nuclear transcription of NF-κB p65 in vitro model of SAH. (A–D) Western blotting and quantitative analyses of the expression of p-IKB-α and NF-kB p65 in microglia after co-cultivation. (E–H) Western blotting and quantitative analysis of the expression of IL-6, IL-1β and TNF-α in microglia after co-cultivation. n = 3 per group. *P < 0.05 vs control group; **P < 0.01 vs control group; # P < 0.05 vs Hb+vehicle group.

References

    1. van Gijn J, Kerr RS, Rinkel GJ. Subarachnoid Haemorrhage. Lancet (2007) 369(9558):306–18. doi: 10.1016/S0140-6736(07)60153-6 - DOI - PubMed
    1. Cahill J, Cahill WJ, Calvert JW, Calvert JH, Zhang JH. Mechanisms of Early Brain Injury After Subarachnoid Hemorrhage. J Cereb Blood Flow Metab (2006) 26:1341–53. doi: 10.1038/sj.jcbfm.9600283 - DOI - PubMed
    1. Suzuki H. What is Early Brain Injury? Transl Stroke Res (2015) 6(1):1–3. doi: 10.1007/s12975-014-0380-8 - DOI - PubMed
    1. Li Y, Liu Y, Wu P, Tian Y, Liu B, Wang J, et al. Inhibition of Ferroptosis Alleviates Early Brain Injury After Subarachnoid Hemorrhage In Vitro and In Vivo via Reduction of Lipid Peroxidation. Cell Mol Neurobiol (2021) 41(2):263–78. doi: 10.1007/s10571-020-00850-1 - DOI - PMC - PubMed
    1. Liu W, Li R, Yin J, Guo S, Chen Y, Fan H, et al. Mesenchymal Stem Cells Alleviate the Early Brain Injury of Subarachnoid Hemorrhage Partly by Suppression of Notch1-Dependent Neuroinflammation: Involvement of Botch. J Neuroinflamm (2019) 16(1):8. doi: 10.1186/s12974-019-1396-5 - DOI - PMC - PubMed

Publication types

MeSH terms

LinkOut - more resources