

ASSESSING SELECTION BIAS IN REGRESSION COEFFICIENTS ESTIMATED FROM NONPROBABILITY SAMPLES WITH APPLICATIONS TO GENETICS AND DEMOGRAPHIC SURVEYS
- PMID: 35237377
- PMCID: PMC8887878
- DOI: 10.1214/21-aoas1453
ASSESSING SELECTION BIAS IN REGRESSION COEFFICIENTS ESTIMATED FROM NONPROBABILITY SAMPLES WITH APPLICATIONS TO GENETICS AND DEMOGRAPHIC SURVEYS
Abstract
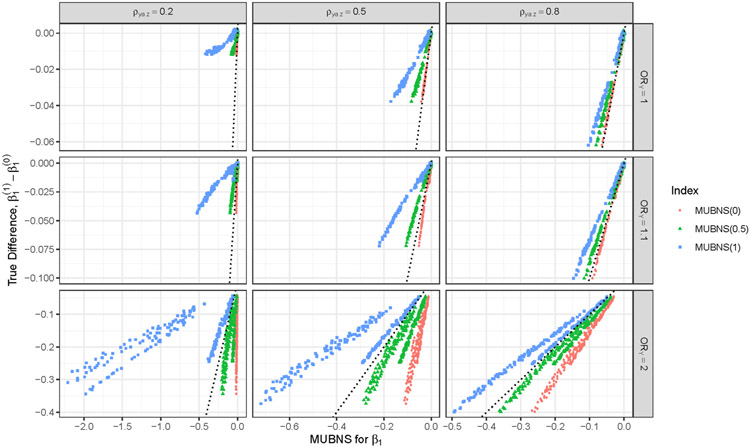
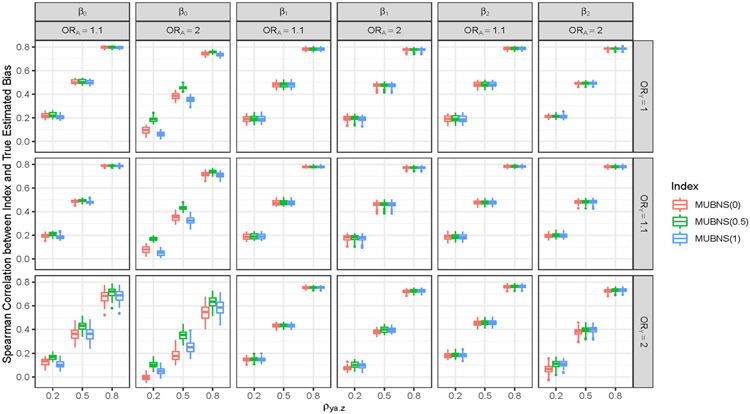
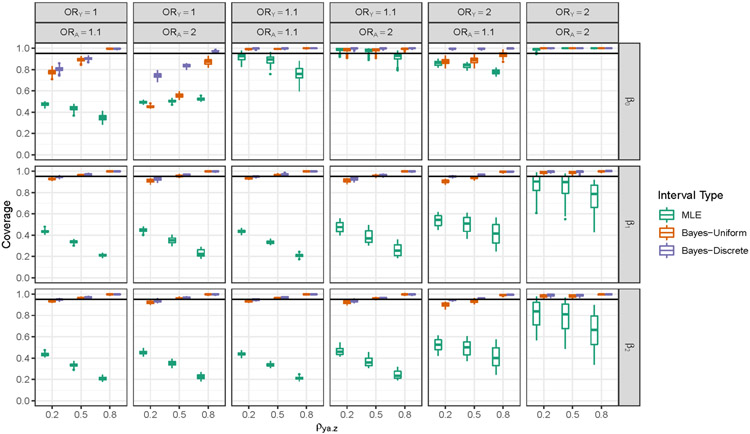
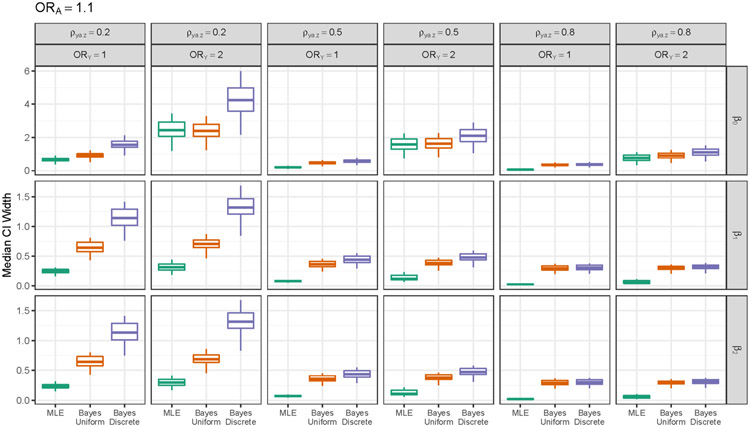
Selection bias is a serious potential problem for inference about relationships of scientific interest based on samples without well-defined probability sampling mechanisms. Motivated by the potential for selection bias in: (a) estimated relationships of polygenic scores (PGSs) with phenotypes in genetic studies of volunteers and (b) estimated differences in subgroup means in surveys of smartphone users, we derive novel measures of selection bias for estimates of the coefficients in linear and probit regression models fitted to nonprobability samples, when aggregate-level auxiliary data are available for the selected sample and the target population. The measures arise from normal pattern-mixture models that allow analysts to examine the sensitivity of their inferences to assumptions about nonignorable selection in these samples. We examine the effectiveness of the proposed measures in a simulation study and then use them to quantify the selection bias in: (a) estimated PGS-phenotype relationships in a large study of volunteers recruited via Facebook and (b) estimated subgroup differences in mean past-year employment duration in a nonprobability sample of low-educated smartphone users. We evaluate the performance of the measures in these applications using benchmark estimates from large probability samples.
Keywords: Linear regression; National Survey of Family Growth; nonprobability samples; polygenic scores; probit regression; selection bias.
Figures
Similar articles
-
Using Auxiliary Information in Probability Survey Data to Improve Pseudo-Weighting in Nonprobability Samples: A Copula Model Approach.J Surv Stat Methodol. 2023 Sep 12;12(5):1338-1364. doi: 10.1093/jssam/smad032. eCollection 2024 Nov. J Surv Stat Methodol. 2023. PMID: 39539789 Free PMC article.
-
Measures of the Degree of Departure from Ignorable Sample Selection.J Surv Stat Methodol. 2020 Nov;8(5):932-964. doi: 10.1093/jssam/smz023. Epub 2019 Aug 29. J Surv Stat Methodol. 2020. PMID: 33381610 Free PMC article.
-
Adjusted logistic propensity weighting methods for population inference using nonprobability volunteer-based epidemiologic cohorts.Stat Med. 2021 Oct 30;40(24):5237-5250. doi: 10.1002/sim.9122. Epub 2021 Jul 5. Stat Med. 2021. PMID: 34219260 Free PMC article.
-
A Systematic Review of Characteristics of Nonprobability Community Venue Samples of Sexual Minority Individuals and Associated Methods for Assessing Selection Bias.LGBT Health. 2019 Jul;6(5):205-215. doi: 10.1089/lgbt.2018.0241. Epub 2019 May 24. LGBT Health. 2019. PMID: 31135260
-
We need to talk about nonprobability samples.Trends Ecol Evol. 2023 Jun;38(6):521-531. doi: 10.1016/j.tree.2023.01.001. Epub 2023 Feb 10. Trends Ecol Evol. 2023. PMID: 36775795 Review.
Cited by
-
Risk of Traumatic Intracranial Hemorrhage After Stroke: A Nationwide Population-Based Cohort Study in Taiwan.J Am Heart Assoc. 2024 Oct;13(19):e035725. doi: 10.1161/JAHA.124.035725. Epub 2024 Sep 18. J Am Heart Assoc. 2024. PMID: 39291491 Free PMC article.
-
Analyzing Potential Non-Ignorable Selection Bias in an Off-Wave Mail Survey Implemented in a Long-Standing Panel Study.J Surv Stat Methodol. 2024 Oct 23;13(1):100-127. doi: 10.1093/jssam/smae039. eCollection 2025 Feb. J Surv Stat Methodol. 2024. PMID: 39877150
-
The Role of Weighting Adjustment for Attrition in Longitudinal Trajectory Modeling: A Simulation Study.Commun Stat Simul Comput. 2025;54(3):866-888. doi: 10.1080/03610918.2024.2362923. Epub 2024 Jun 7. Commun Stat Simul Comput. 2025. PMID: 40270979
-
Evaluating Pre-election Polling Estimates Using a New Measure of Non-ignorable Selection Bias.Public Opin Q. 2023 Jun 8;87(Suppl 1):575-601. doi: 10.1093/poq/nfad018. eCollection 2023. Public Opin Q. 2023. PMID: 37705923 Free PMC article.
References
-
- Andridge RR and Little RJ (2011). Proxy pattern-mixture analysis for survey nonresponse. J. Off. Stat 27 153–180.
-
- Andridge RR and Little RJ (2020). Proxy pattern-mixture analysis for a binary variable subject to nonresponse. J. Off. Stat 36 703–728.
-
- Baker R, Brick JM, Bates NA, Battaglia M, Couper MP, Dever JA and Tourangeau R (2013). Summary report of the AAPOR task force on nonprobability sampling. J. Sur. Stat. Methodol 1 90–143.
Grants and funding
LinkOut - more resources
Full Text Sources
Miscellaneous