. 2022 Feb 21:2022:6041612.
doi: 10.1155/2022/6041612. eCollection 2022.

miR-672-3p Promotes Functional Recovery in Rats with Contusive Spinal Cord Injury by Inhibiting Ferroptosis Suppressor Protein 1

Affiliations

miR-672-3p Promotes Functional Recovery in Rats with Contusive Spinal Cord Injury by Inhibiting Ferroptosis Suppressor Protein 1

Fang Wang et al. Oxid Med Cell Longev. .

Abstract

Aberrantly expressed microRNAs (miRNAs) after spinal cord injury (SCI) participate in diverse biological pathways and processes, including apoptosis, inflammation, oxidative stress responses, peroxidation, and ferroptosis. This study was aimed at exploring the mechanisms underlying miRNA-mediated ferroptosis in an SCI rat model. In the present study, a T10 weight-dropping SCI model was established and miRNA profiling was used to detect miRNA expression profiles post-SCI. Basso-Beattie-Bresnahan scores and inclined plane test, hematoxylin and eosin (HE) and Nissl staining, immunohistochemistry and immunofluorescence, western blotting, cell viability, and Annexin V/7-aminoactinomycin D (7-AAD) assays were used to evaluate locomotor activity, histological changes in the injured spinal cords, neuronal ferroptosis, ferroptosis suppressor protein 1 (FSP1) expression, and cell death, respectively. It was observed that many miRNAs were differentially expressed after SCI, and miR-672-3p, which increased significantly, was selected after cross-referencing with predicted target miRNAs. The luciferase reporter assay demonstrated that miR-672-3p downregulated FSP1, a glutathione-independent ferroptosis suppressor, by binding to its 3' untranslated region. Oxygen and glucose deprivation- (OGD-) treated PC12 and AGE1.HN cells were treated with miR-672-3p mimics or inhibitors in vitro. The effect of miR-672-3p mimics or inhibitor on OGD-PC12/AGE1.HN ferroptosis was evaluated by flow cytometry, immunohistochemistry, immunofluorescence, and western blotting. The miR-672-3p mimics promoted ferroptosis after SCI, whereas the miR-672-3p inhibitor inhibited this process. Rats with SCI treated with miR-672-3p mimics or inhibitor showed similar results in vivo. Furthermore, the ferroptosis-related changes caused by SCI or miR-672-3p were reversed by overexpression of FSP1 lentivirus in vivo and in vitro. These results indicated that sh-miR-672-3p exerted a neural restoration effect in vivo and in vitro by inhibiting ferroptosis via the FSP1 pathway.


Conflict of interest statement

The authors declare that there is no conflict of interest regarding the publication of this paper.

Figures

Figure 1
Figure 1
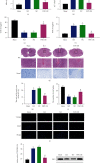
Ferroptosis functioned in the process of SCI in vivo. Sham group: no spinal cord injury or treatment; SCI group: spinal cord injury only; Fer-1 group: Fer-1 treatment after spinal cord injury. (a) Basso-Beattie-Breshman (BBB) exercise scale. (b) Inclined plane test. (c) MDA levels, (d) Fe2+ levels, (e) GSH levels, and (f) ROS levels were significantly different between the SCI group and the sham group, and the Fer-1 treatment narrowed the difference. (g) Representative hematoxylin-eosin and Nissl staining of spinal cord sections 7 days after surgery. The neuronal damage in the SCI group was more severe than that in the sham group, while the Fer-1 treatment relieves the damage. (h) Ratio of the area of cavity space to the area of the lesion center 7 days after surgery. (i) Relative number of Nissl bodies of the lesion center 7 days after surgery. (j) Representative TUNEL image of the lesion center 7 days after surgery. (k) Positive ratio of TUNEL in the Fer-1 group was higher than that in the sham group but lower than that in the SCI group. Data are shown as mean ± SD(n = 10). P < 0.05 vs. sham group; #P < 0.05 vs. SCI group (one-way analysis of variance followed by the least significant difference test).
Figure 2
Figure 2
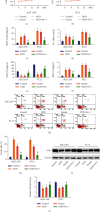
Ferroptosis functioned in the cells suffering from OGD-induced injury in vitro. Control group: no treatment; OGD group: OGD treatment only; erastin group: erastin treatment only; OGD+Fer-1 group: Fer-1 treatment after OGD treatment. (a) Cell viability assay in AGE1.HN cells and in (b) PC12 cells decreased after OGD and erastin treatment, while Fer-1 treatment inhibited the decrease. (c) MDA levels, (d) Fe2+ levels, (e) GSH levels, and (f) ROS levels were significantly different between the control group and the OGD/erastin group, and the Fer-1 treatment narrowed the difference. (g) Annexin V/7-AAD assay analyzed by flow cytometry. (h) Death cells increased after OGD and erastin treatment, while Fer-1 treatment inhibited the increase. (i, j) FSP1 expression. Data are shown as mean ± SD(n = 10). P < 0.05 vs. control group; #P < 0.05 vs. OGD group (one-way analysis of variance followed by the least significant difference test).
Figure 3
Figure 3
miR-672-3p was aberrantly expressed during SCI and targeted FSP1 in cells. Sham group: no spinal cord injury or treatment; SCI group: spinal cord injury only; control group: no treatment; OGD group: OGD treatment only; erastin group: erastin treatment only; OGD+Fer-1 group: Fer-1 treatment after OGD treatment; NC group: negative analog of miR-672-3p mimics treatment after SCI; miR-672-3p group: miR-672-3p mimics treatment after SCI. (a) Heat map showing expression profiles for the sham group compared with the SCI group. (b) Venn diagram showing the intersection of differentially expressed miRNAs in SCI, predicted target miRNAs, and ferroptosis-related miRNAs. (c) FISH showing the expression of miR-672-3p increased significantly in the SCI group compared with the sham group. (d) Relative miR-672-3p level (P < 0.05 vs. sham group). (e, f) FSP1 expression level decreased in the SCI group compared with the sham group (P < 0.05 vs. sham group). (g) The predicted binding site between miR-672-3p and 3′-UTR of FSP1 mRNA. (h) Relative luciferase activity in AGE1.HN and PC12 cells cotransfected with miR-672-3p with wild-type FSP1 luciferase (P < 0.05 vs. NC (AGE1.HN) group; #P < 0.05 vs. NC (PC12) group). (i) Relative miRNA level (P < 0.05 vs. control group; #P < 0.05 vs. OGD group). Data are shown as mean ± SD(n = 10) (one-way analysis of variance followed by the least significant difference test).
Figure 4
Figure 4
miR-672-3p promotes ferroptosis during SCI. Sham group: no spinal cord injury or treatment; SCI group: spinal cord injury only; NC group: negative analog of miR-672-3p mimics treatment after SCI; miR-672-3p mimics group: miR-672-3p mimics treatment after SCI; miR-672-3p inhibitor group: miR-672-3p inhibitor treatment after SCI. (a) Basso-Beattie-Breshman (BBB) exercise scale. (b) Inclined plane test. (c) MDA levels, (d) Fe2+ levels, (e) GSH levels, and (f) ROS levels. (g) Representative hematoxylin-eosin and Nissl staining of spinal cord sections 7 days after surgery. The miR-672-3p mimics group increased the neuronal damage while the miR-672-3p inhibitor group decreased it. (h) Ratio of the area of cavity space to the area of the lesion center 7 days after surgery. (i) Relative number of Nissl bodies of the lesion center 7 days after surgery. (j) Representative TUNEL image of the lesion center 7 days after surgery. (k) Positive ratio of TUNEL in the miR-672-3p mimics group increased while that in the miR-672-3p inhibitor group decreased compared with that in the SCI group. (l, m) The miR-672-3p mimics downregulated FSP1 expression while the miR-672-3p inhibitor upregulated it. Data are shown as mean ± SD(n = 10). P < 0.05 vs. sham group; #,&P < 0.05 vs. SCI group (one-way analysis of variance followed by the least significant difference test).
Figure 5
Figure 5
miR-672-3p promotes ferroptosis in the OGD-induced cells. NC group: negative analog of miR-672-3p mimics treatment after OGD; NC inhibitor: negative analog of miR-672-3p inhibitor treatment after OGD; mimics group: miR-672-3p mimics treatment after OGD; inhibitor group: miR-672-3p inhibitor treatment after OGD. (a) Cell viability assay in AGE1.HN cells and in (b) PC12 cells decreased after miR-672-3p mimics treatment and increased after miR-672-3p inhibitor treatment. (c) MDA levels, (d) Fe2+ levels, (e) GSH levels, and (f) ROS levels. (g, h) FSP1 expression. (i) Annexin V/7-AAD assay analyzed by flow cytometry. (j) Death cells showed the same trend as the cell viability assay. Data are shown as mean ± SD(n = 10). P < 0.05 vs. NC group; #P < 0.05 vs. NC inhibitor group (one-way analysis of variance followed by the least significant difference test).
Figure 6
Figure 6
The overexpression of FSP1 inhibits ferroptosis during SCI. Sham group: no spinal cord injury or treatment; SCI group: spinal cord injury only; NC group: negative analog of overexpression FSP1 lentivirus treatment after SCI; FSP1 OE group: overexpression FSP1 lentivirus treatment after SCI. (a) Basso-Beattie-Breshman (BBB) exercise scale. (b) Inclined plane test. (c) MDA levels, (d) Fe2+ levels, (e) GSH levels, and (f) ROS levels. (g) Representative hematoxylin-eosin and Nissl staining of spinal cord sections 7 days after surgery. The FSP1 OE group decreased the neuronal damage. (h) Ratio of the area of cavity space to the area of the lesion center 7 days after surgery. (i) Relative number of Nissl bodies of the lesion center 7 days after surgery. (j) Representative TUNEL image of the lesion center 7 days after surgery. (k) Positive ratio of TUNEL in the FSP1 OE group decreased compared with the SCI and NC groups. (l, m) The overexpression FSP1 lentivirus treatment upregulated FSP1 expression. Data are shown as mean ± SD(n = 10). P < 0.05 vs. sham group; #P < 0.05 vs. SCI group (one-way analysis of variance followed by the least significant difference test).
Figure 7
Figure 7
miR-672-3p promotes ferroptosis during SCI by downregulating the expression of FSP1. NC+CV group: negative analog of overexpression FSP1 lentivirus and miR-672-3p mimics treatment; NC+FSP1 group: overexpression FSP1 lentivirus and negative analog of miR-672-3p mimics treatment; CV+mimics group: miR-672-3p mimics and negative analog of overexpression FSP1 lentivirus; mimics+FSP1 group: overexpression FSP1 lentivirus and miR-672-3p mimics treatment. (a, b) FSP1 expression increased after overexpression FSP1 lentivirus treatment. The overexpression of FSP1 upregulated the cell viability assay in (c) AGE1.HN cells and in (d) PC12 cells after miR-672-3p mimics treatment. (e) MDA levels, (f) Fe2+ levels, (g) GSH levels, and (h) ROS levels. (i) Annexin V/7-AAD assay analyzed by flow cytometry. (j) Death cells showed the same trend as the cell viability assay. Data are shown as mean ± SD(n = 10). P < 0.05 vs. NC+CV group; #P < 0.05 vs. CV+mimics group (one-way analysis of variance followed by the least significant difference test).

Similar articles

Cited by

References

    1. Eckert M. J., Martin M. J. Trauma: spinal cord injury. The Surgical Clinics of North America . 2017;97(5):1031–1045. doi: 10.1016/j.suc.2017.06.008. - DOI - PubMed
    1. Jazayeri S. B., Beygi S., Shokraneh F., Hagen E. M., Rahimi-Movaghar V. Incidence of traumatic spinal cord injury worldwide: a systematic review. European Spine Journal . 2015;24(5):905–918. doi: 10.1007/s00586-014-3424-6. - DOI - PubMed
    1. Ahuja C. S., Nori S., Tetreault L., et al. Traumatic spinal cord injury-repair and regeneration. Neurosurgery . 2017;80(3s):S9–S22. doi: 10.1093/neuros/nyw080. - DOI - PubMed
    1. Hirschhorn T., Stockwell B. R. The development of the concept of ferroptosis. Free Radical Biology & Medicine . 2019;133:130–143. doi: 10.1016/j.freeradbiomed.2018.09.043. - DOI - PMC - PubMed
    1. Stockwell B. R., Jiang X., Gu W. Emerging mechanisms and disease relevance of Ferroptosis. Trends in Cell Biology . 2020;30(6):478–490. doi: 10.1016/j.tcb.2020.02.009. - DOI - PMC - PubMed

MeSH terms