. 2022 Feb 14:9:809699.
doi: 10.3389/fsurg.2022.809699. eCollection 2022.

Preliminary Study on Immediate Postoperative CT Images and Values of the Modular Polyetheretherketone Based Total Knee Arthroplasty: An Observational First-in-Human Trial

Affiliations

Preliminary Study on Immediate Postoperative CT Images and Values of the Modular Polyetheretherketone Based Total Knee Arthroplasty: An Observational First-in-Human Trial

Zhengyu Cai et al. Front Surg. .

Abstract

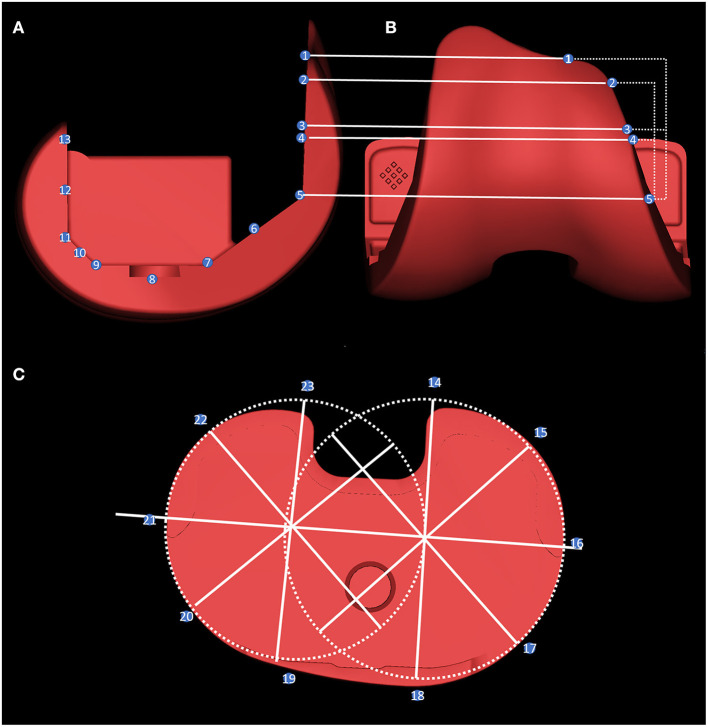
Background: Total knee arthroplasty (TKA) is now frequently performed and is highly successful. However, patient satisfaction after TKA is often difficult to achieve. Because of the presence of metallic prosthetic knee joints, there is a lack of imaging tools that can accurately assess the patient's postoperative prosthetic position, soft tissue impingement, and periprosthetic bone density after TKA. We conducted a clinical trial of the world's first totally modular polyetheretherketone (PEEK) TKA and determined the bone density values in the stress concentration area around the prosthesis based on postoperative computed tomography data to reconstruct a three-dimensional model of the PEEK prosthetic knee joint after implantation. Based on the model, the overhang of the prosthesis was measured at various locations on the prosthesis.

Methods: All patients who underwent PEEK-based TKA were postoperatively assessed with radiography and computed tomography (CT). Hounsfield units (HUs) for the different components of the quantitative CT assessment were measured separately.

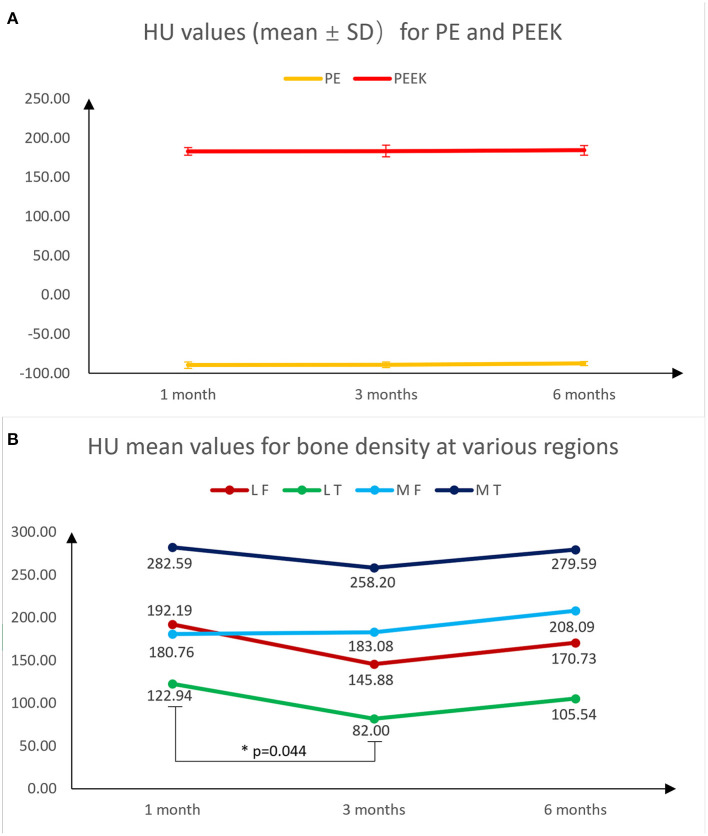
Results: Ten patients (nine female and one male) aged 59-74 (mean 66.9, median 67) years were included. The HU values were as follows: PEEK prosthesis mean 182.95, standard deviation (SD) 4.90, coefficient of variation (CV) 2.68; polyethylene mean -89.41, SD 4.14, CV -4.63; lateral femoral osteochondral mean 192.19, SD 55.05, CV 28.64; lateral tibial osteochondral mean 122.94, SD 62.14, CV 42.86; medial femoral osteophyte mean 180.76, SD 43.48, CV 24.05; and medial tibial osteophyte mean 282.59, SD 69.28, CV 24.52. Analysis of the data at 1, 3, and 6 months showed that the mean PE (p = 0.598) and PEEK (p = 0.916) measurements did not change with the time of measurement. There was a decrease in bone mineral density in the lateral tibia at 3 months (p = 0.044). Otherwise, there was no significant change in bone density in other regions (p = 0.124-0.803). There was no overhang in all femoral prostheses, whereas there were two cases of overhang in tibial prostheses. Overhang measurements do not differ significantly across time points. The overhang measurements were not significantly different at all time points (p = 0.186-0.967).

Conclusion: PEEK knee joint prosthesis has excellent CT compatibility. The change in periprosthetic bone volume during the follow-up period can be determined using the HU value after CT scan, while the prosthesis position can be assessed. This assessment may potentially guide future improvements in knee prosthesis alignment techniques and artificial knee prosthesis designs.

Keywords: arthroplasty; bone density; computed tomography; polyetheretherketone; prosthetic overhang.


Conflict of interest statement

The authors declare that the research was conducted in the absence of any commercial or financial relationships that could be construed as a potential conflict of interest.

Figures

Figure 1
Figure 1
The complete knee prosthesis consists of the PEEK femoral component, PEEK tibial component, and an all-polyethylene bearing. PEEK, polyetheretherketone.
Figure 2
Figure 2
Postoperative X-rays of frontal and lateral views of patient 1 (A,B), images of postoperative CT coronal intermediate and lateral condyle central layers (C,D), and a preview of the 3D reconstructed model (E–H) are shown. CT level selection: coronal, sagittal, and axial positions consistent with the joint force lines. The most central metal line was selected according to the position of the central tibial plateau prosthesis and the central lateral femoral condyle. The most central position of the metal wire was selected as the intercept plane (C). Mimics reconstruction software was used to arrange the viewing angles in the order of anterior, posterior, lateral, and medial positions (E–H).
Figure 3
Figure 3
The overhang measurement method. The femoral side was measured by taking the five planes of the prosthesis, the midpoint of each plane, and the length of the prosthesis and the bone-implant bed on the horizontal line of the inner and outer edges of points 1–13 (A,B). For tibial overhang measurement: two external tangential circles were made at the interior and lateral edge of the prosthesis, and the difference between the length of the prosthesis and the bone-implant bed was measured every 45° on these radii at points 14–23 (C).
Figure 4
Figure 4
The results of the 3D reconstruction of a patient are shown, with the HXLPE bearing, patella and patellar prosthesis, femoral stem, and a part of the tibial stem and fibula removed. The prosthesis was superposed by the corresponding type of prosthesis, and the placement of the prosthesis was determined by matching the results of the previous 3D reconstruction. A tibial plateau prosthesis with a posteromedial overhang is shown. HXLPE, highly cross-linked polyethylene.
Figure 5
Figure 5
The CT density measurement method. In the sagittal position, the lateral and medial condyles were selected centrally (midpoint of the metal alignment line), and the cancellous area was encircled using the Weasis polygon tool (A,B). The HU values of the HXLPE bearing and the PEEK tibial prosthesis stem (stem) were selected in the coronal position (C). The ROI is distributed up to the highest area of the femoral prosthesis to the joint line a, and the lowest area of the tibial plateau is visible on CT to the joint line. CT, computed tomography; HU, Hounsfield unit; HXLPE, highly cross-linked polyethylene; PEEK, polyetheretherketone; ROI, region-of-interest.
Figure 6
Figure 6
Fold plots of the change in HU values of PE, PEEK, lateral femur, lateral tibia, medial femur and medial tibia measured using CT at 1, 3, and 6 months postoperatively, which reflect the trend of density change in the measured area. Among them, the mean and standard deviation of HU values for PE and PEEK were almost unchanged (A). Except for the medial femur, which did not decrease at 3 months, there was a trend of decreasing bone density at 3 months in the remaining regions, with a statistically significant decrease in the medial tibia. All regions showed a rebound in bone density at 6 months (B).

References

    1. Price AJ, Alvand A, Troelsen A, Katz JN, Hooper G, Gray A, et al. . Knee replacement. Lancet. (2018) 392:1672–82. 10.1016/S0140-6736(18)32344-4 - DOI - PubMed
    1. Beard DJ, Davies LJ, Cook JA, MacLennan G, Price A, Kent S, et al. . The clinical and cost-effectiveness of total versus partial knee replacement in patients with medial compartment osteoarthritis (TOPKAT): 5-year outcomes of a randomised controlled trial. Lancet. (2019) 394:746–56. 10.1016/S0140-6736(19)31281-4 - DOI - PMC - PubMed
    1. Schoon J, Ort MJ, Huesker K, Geissler S, Rakow A. Diagnosis of metal hypersensitivity in total knee arthroplasty: a case report. Front Immunol. (2019) 10:2758. 10.3389/fimmu.2019.02758 - DOI - PMC - PubMed
    1. Dear K, Boyce AE, Lee A. Allergic contact dermatitis due to titanium in a total knee replacement. Contact Dermatitis. (2020) 83:161–2. 10.1111/cod.13590 - DOI - PubMed
    1. Penumarty S, Tuong LA, Khianey R, Oppenheimer J. Metal hypersensitivity in total joint arthroplasties. Ann Allergy Asthma Immunol. (2020) 124:546–7 e1. 10.1016/j.anai.2020.02.012 - DOI - PubMed

LinkOut - more resources