. 2022 Mar 8;119(10):e2200083119.
doi: 10.1073/pnas.2200083119. Epub 2022 Mar 1.

Disruption of the circadian clock component BMAL1 elicits an endocrine adaption impacting on insulin sensitivity and liver disease

Affiliations

Disruption of the circadian clock component BMAL1 elicits an endocrine adaption impacting on insulin sensitivity and liver disease

Céline Jouffe et al. Proc Natl Acad Sci U S A. .

Abstract

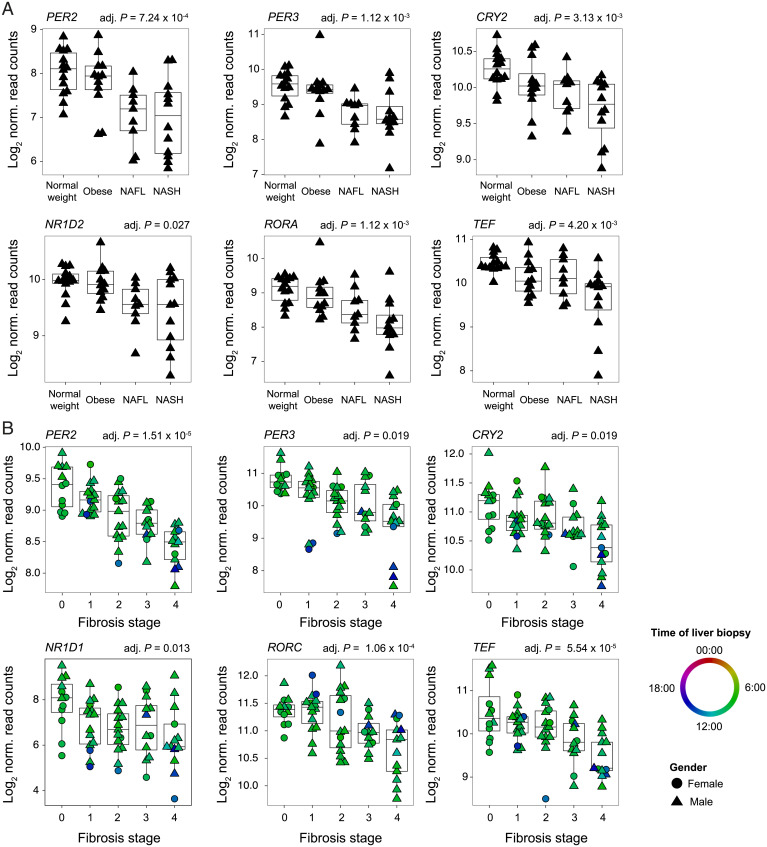
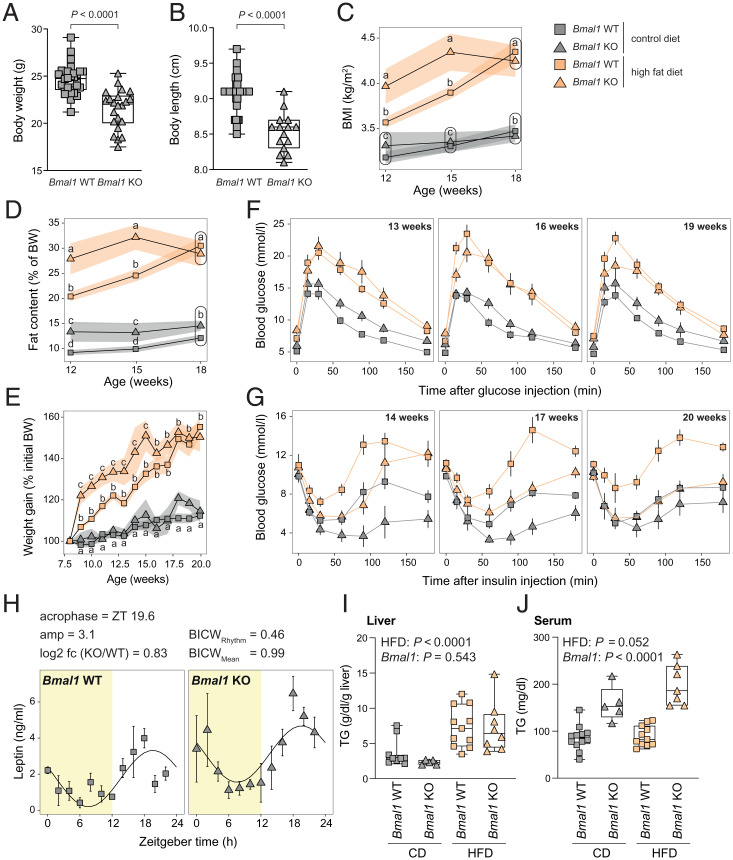
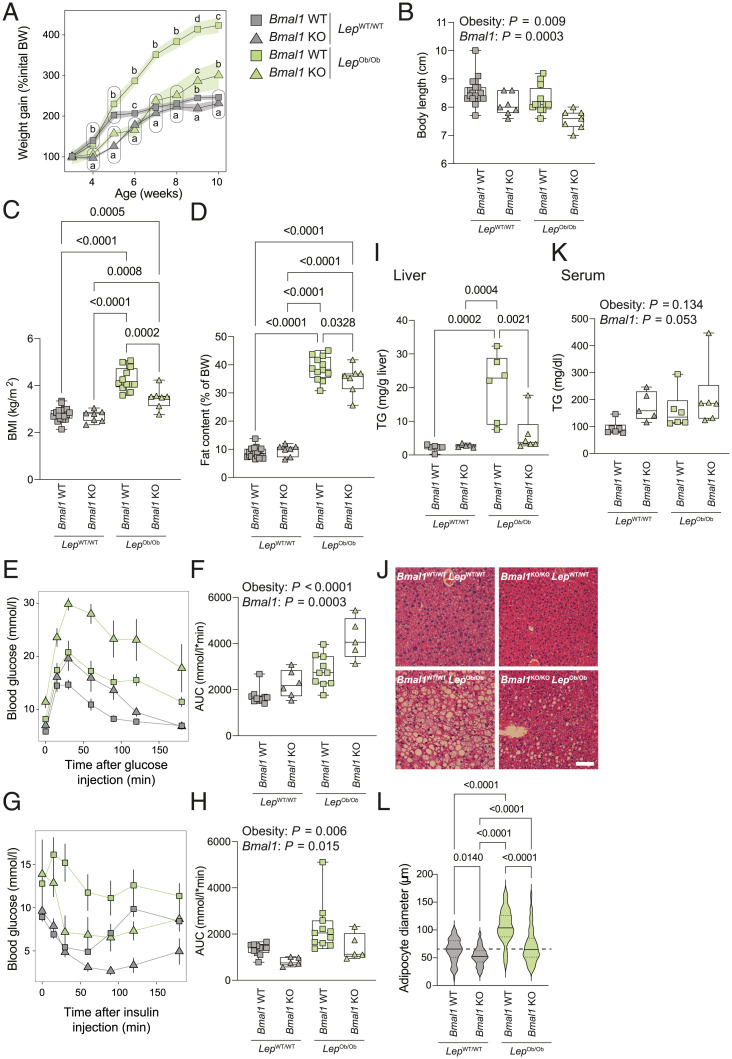
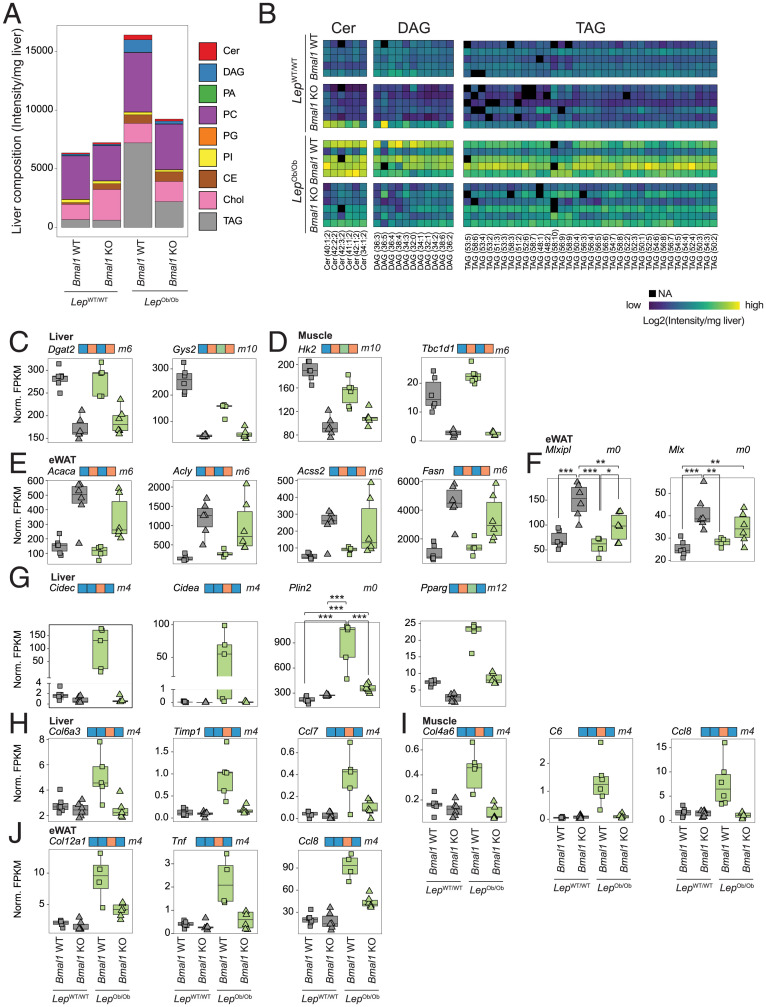
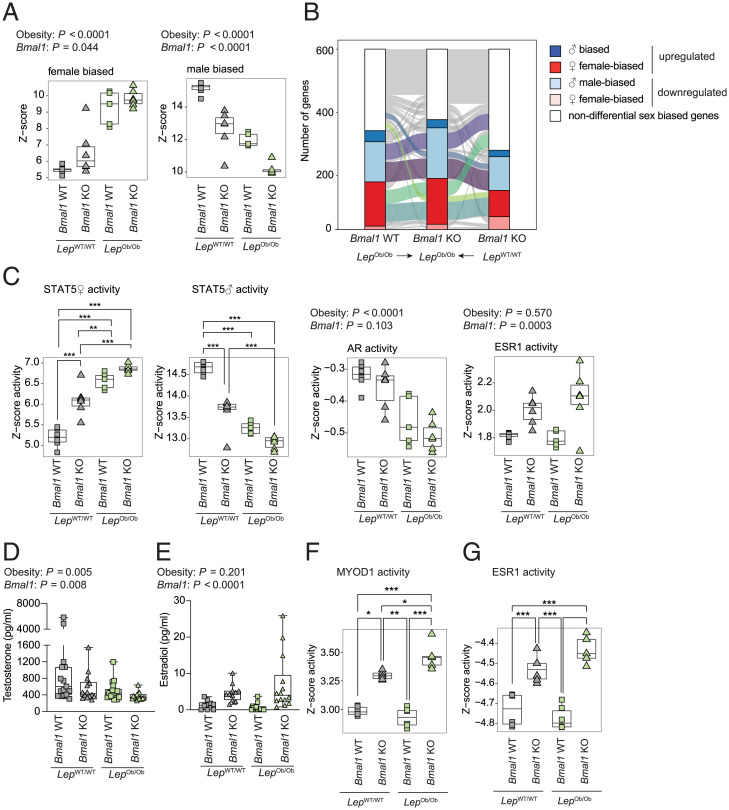
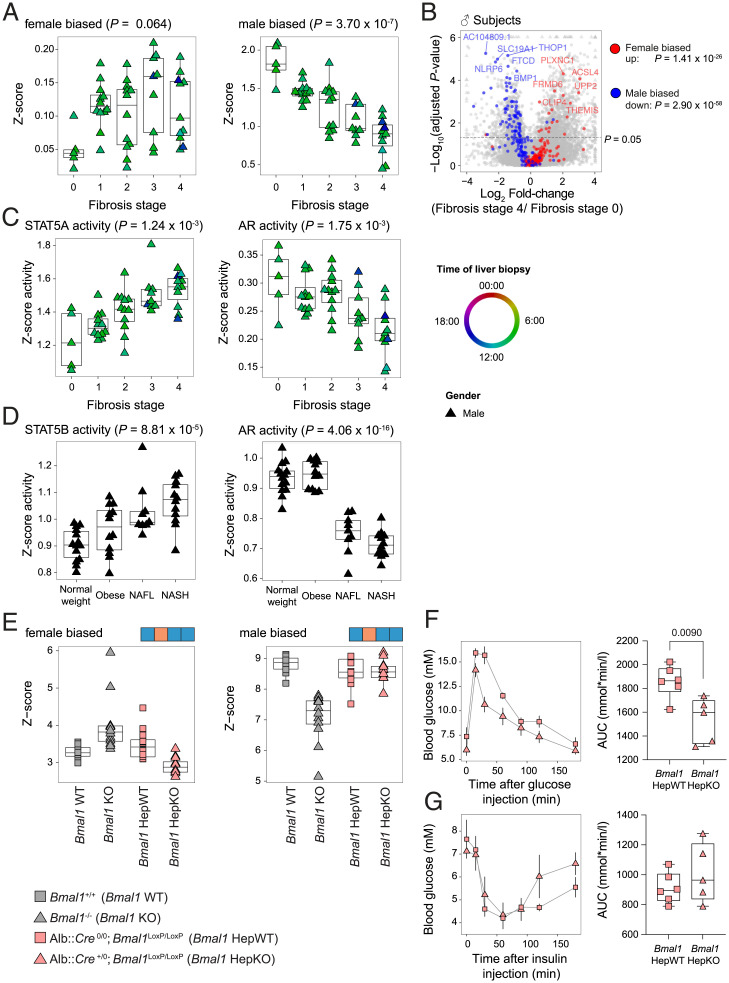
SignificanceWhile increasing evidence associates the disruption of circadian rhythms with pathologic conditions, including obesity, type 2 diabetes, and nonalcoholic fatty liver diseases (NAFLD), the involved mechanisms are still poorly described. Here, we show that, in both humans and mice, the pathogenesis of NAFLD is associated with the disruption of the circadian clock combined with perturbations of the growth hormone and sex hormone pathways. However, while this condition protects mice from the development of fibrosis and insulin resistance, it correlates with increased fibrosis in humans. This suggests that the perturbation of the circadian clock and its associated disruption of the growth hormone and sex hormone pathways are critical for the pathogenesis of metabolic and liver diseases.

Keywords: circadian clock; estrogen; growth hormone; insulin resistance; nonalcoholic fatty liver disease.


Conflict of interest statement

Competing interest statement: C.J., B.D.W., E.M., F.A., C.G., A.C., D.M.-R., M.M., and F.G. are or were employees of Société des Produits Nestlé SA.

Figures

Fig. 1.
Fig. 1.
The regulation of BMAL1 activity in obesity and liver disease in humans. (A) The expression of circadian clock genes in a male human liver of normal weight, obese, simple steatosis (NAFL), or NASH. n ≥ 9 subjects per condition. (B) The expression of circadian clock genes in the liver of humans at different stages of fibrosis. Circles and triangles represent female and male individuals, respectively. n ≥ 12 subjects per stage. The color code represents the time of liver biopsy. P values were determined with a generalized linear model (A and B; for details, see Materials and Methods).
Fig. 2.
Fig. 2.
Bmal1 KO mice under HFD exhibit an early obese phenotype but no sign of prediabetes. (A and B) Body weight (A) and size (B) of Bmal1 of WT and KO mice before the treatment with HFD or CD. n = 22 to 32 mice (A) and 15 to 37 mice (B) per genotype. (C) BMI of indicated genotype and feeding regimen throughout the experiment. The size and weight were measured at ZT3. n = 6 to 19 mice per genotype and week. (D) Relative fat content measured by EchoMRI throughout the experiment. n = 6 to 19 mice per genotype and week. (E) The relative weight gain of Bmal1 WT and KO mice fed under HFD or CD. The body weight of the mice was measured at ZT3. n = 4 to 17 mice per condition and week. (F) Glucose tolerance tests performed on 13-, 16-, and 19-wk-old mice at ZT3 after 15 h of fasting. n = 6 to 17 mice per condition and week. (G) Insulin tolerance tests performed on 14-, 17-, and 20-wk-old mice at ZT3. n = 4 to 14 mice per condition and week. (H) The temporal serum leptin concentration in Bmal1 WT and KO under CD. n = 3 mice per time point and genotype. (I and J) Liver (I) and serum (J) triglycerides concentration at ZT12 in Bmal1 WT and KO mice fed with CD or HFD. n = 5 to 12 mice per condition. ZT is defined as follows: ZT0, lights on; ZT12, lights off. Statistical tests included unpaired Student’s t test (A and B), dryR (H), linear models (CE; see details in Materials and Methods), and two-way ANOVA (I and J). Means with different letters are significantly different (P < 0.05; CE).
Fig. 3.
Fig. 3.
The consequences of Bmal1 deletion in the absence of leptin. (A) The evolution of the body weight of Bmal1KO/KOLepOb/Ob (KO–Ob), Bmal1KO/KOLepWT/WT (KO–WT), Bmal1WT/WT–LepOb/Ob (WT–Ob), and Bmal1WT/WTLepWT/WT (WT–WT) mice. The body weight was measured at ZT3. n = 3 to 22 mice per genotype and week. (BD) Size (B), BMI (C), and fat content (D) of 6-wk-old mice from the four genotypes of interest. The size, weight, and body fat measured by EchoMRI were measured At ZT3. n = 7 to 19 mice per genotype. (E and F) Glucose tolerance tests performed on 11-wk-old mice from the four genotypes at ZT3 after a 15-h fasting. Data represent glucose concentrations over time (E) and area under the curve (F). n = 5 to 10 mice per genotype. (G and H) Insulin tolerance tests performed on 12-wk-old mice from the four genotypes at ZT3. Data represent glucose concentrations over time (G) and area under the curve (H). n = 5 to 11 mice per genotype. (I) Liver triglycerides concentration measured at ZT12. n = 5 to 6 mice per genotype. (J) Representative liver sections stained with hematoxylin and eosin from each genotype of mice at ZT12. (Scale bar, 50 μm.) (K) Serum triglycerides concentration measured at ZT12. n = 5 to 6 mice per genotype. (L) The distribution of adipocytes size in eWAT from the different groups of mice at ZT12. The diameter (µm) of the adipocytes was determined from eWAT slices stained with hematoxylin and eosin (SI Appendix, Fig. S3H). n = 45 to 174 adipocytes per condition in representative mice of the cohort. Statistical tests included linear models (A; see details in Materials and Methods), and two-way ANOVA (B, F, H, and K) followed by a Holm–Šídák multiple comparison test (C, D, I, K, and L). Means with different letters are significantly different (P < 0.05; A).
Fig. 4.
Fig. 4.
BMAL1 controls lipid metabolism and storage. (A) Global liver lipids composition analyzed by lipidomics in each group of mice liver at ZT12. Values represent average of n = 5 to 6 mice per genotype. TAG: triacylglycerides, Chol: cholesterol, CE: cholesteryl esters, PI: phosphatidylinositols, PG: phosphatidylglycerols, PC: phosphatidylcholines, PA: phosphatidic acid, DAG: diacylglycerides, Cer: ceramides. (B) A heatmap of the abundance of the lipid species associated with insulin resistance (Cer, DAG, and TAG) in the livers of individual mice. (CE) The expression of genes encoding enzymes involved in glucose and lipid metabolism measured by RNA-seq at ZT12 in liver (C), muscle (D), and eWAT (E). n = 5 to 6 mice per genotype. (F) The expression of the carbohydrate-responsive element-binding protein and its heterodimerization partner measured by RNA-seq at ZT 12 in eWAT. N = 4 to 6 mice per genotype. (G) The expression of genes encoding proteins involved in lipid storage measured by RNA-seq in the liver at ZT12. N = 4 to 6 mice per genotype. (HJ) The expression of markers of inflammation and fibrosis measured by RNA-seq at ZT12 in liver (H), muscle (I), and eWAT (J). n = 4 to 6 mice per genotype. For statistical analysis, generalized linear models were employed (CI; see details in Materials and Methods). Differences in expression level between the genotypes are defined in SI Appendix, Fig. S4A and are indicated on top of the graph. Genes that follow an ambiguous model are marked m0, and P values for each significant contrast are provided. ***P < 0.001, **P < 0.01, and *P < 0.05.
Fig. 5.
Fig. 5.
Gene expression analysis revealed the impact of Bmal1 deletion on feminization of gene expression. (A) The differential expression of female- and male-biased genes in the liver of mice from the four genotypes at ZT12. n = 5 to 6 mice per genotype. (B) The clustered expression of the genes with similar sex-biased genes in the different genotypes at ZT12. (C) The predicted activity of transcription factors known to be involved in sex-biased gene expression in the liver. Activity is computed based on female (♀) and male (♂) STAT5, AR, and ESR1 target genes. n = 5 to 6 mice per genotype. (D and E) Concentrations of testosterone (D) and estradiol (E) in the serum of the mice of indicated genotypes at ZT12. n = 14 to 18 mice per genotype (D) and n = 10 to 16 mice per genotype (E). (F and G) The predicted activity of MYOD1 (F) and ESR1 (G) in skeletal muscle. n = 4 to 6 mice per genotype. P values were determined by a two-way ANOVA (A, CG) followed by a Holm–Šídák multiple comparison test if interaction term was significant (P < 0.05). ***P < 0.001, **P < 0.01, and *P < 0.05.
Fig. 6.
Fig. 6.
The feminization of gene expression increases during development of NAFL and NASH in humans but not in Bmal1 HepKO mice. (A) The differential expression of female- and male-biased genes in the livers of humans at different stages of fibrosis. n ≥ 12 subjects per stage. (B) A volcano plot representing the differential expression of the sex-biased genes in the livers of individuals with fibrosis stage 0 or 4. Colors indicate male-biased (blue), female-biased (red), and unbiased (gray) expressed genes. n ≥ 12 subjects per stage. (C) The predicted activity of STAT5 and AR in the livers of individuals at different stage of fibrosis. (D) The predicted activity of STAT5 and AR in the livers of individuals with normal weight, obesity, simple steatosis (NAFL), or NASH. n ≥ 9 subjects per condition. (E) The differential expression of female- and male-biased genes in the livers of Bmal1 KO and Bmal1 HepKO mice (n = 12 per genotype). (F) Glucose tolerance tests performed on 9-wk-old Bmal1 HepKO and hepatocyte-specific WT (HepWT) littermates at ZT3 after a 15-h fasting. Data represent glucose concentrations over time (Left) and area under the curve (Right). n = 5 to 6 mice per genotype. (G and H) Insulin tolerance tests performed at ZT3 on 10-wk-old Bmal1 HepKO and HepWT littermates. Data represent glucose concentrations over time (Left) and area under the curve (Right). n = 5 to 6 mice per genotype. Statistical tests included linear models (A, C, and D; for details, see Materials and Methods), mean-rank gene set test (B), dryR (E), and two-tailed unpaired Student’s t test (F and G).

References

    1. Mukherji A., Bailey S. M., Staels B., Baumert T. F., The circadian clock and liver function in health and disease. J. Hepatol. 71, 200–211 (2019). - PMC - PubMed
    1. VoPham T., et al. , Circadian misalignment and hepatocellular carcinoma incidence in the United States. Cancer Epidemiol. Biomarkers Prev. 27, 719–727 (2018). - PMC - PubMed
    1. Cedernaes J., Ramsey K. M., Bass J., “The role of circadian biology in health and disease” in Harrison’s Principles of Internal Medicine, 20E, Jameson J. L., et al., Eds. (McGraw-Hill Education, New York, NY, 2018).
    1. Speakman J. R., Evolutionary perspectives on the obesity epidemic: Adaptive, maladaptive, and neutral viewpoints. Annu. Rev. Nutr. 33, 289–317 (2013). - PubMed
    1. Hastings M. H., Maywood E. S., Brancaccio M., Generation of circadian rhythms in the suprachiasmatic nucleus. Nat. Rev. Neurosci. 19, 453–469 (2018). - PubMed