. 2022 Mar 3;79(3):171.
doi: 10.1007/s00018-022-04145-0.

Upstream open reading frames regulate translation of cancer-associated transcripts and encode HLA-presented immunogenic tumor antigens

Affiliations

Upstream open reading frames regulate translation of cancer-associated transcripts and encode HLA-presented immunogenic tumor antigens

Annika Nelde et al. Cell Mol Life Sci. .

Abstract

Background: Upstream open reading frames (uORFs) represent translational control elements within eukaryotic transcript leader sequences. Recent data showed that uORFs can encode for biologically active proteins and human leukocyte antigen (HLA)-presented peptides in malignant and benign cells suggesting their potential role in cancer cell development and survival. However, the role of uORFs in translational regulation of cancer-associated transcripts as well as in cancer immune surveillance is still incompletely understood.

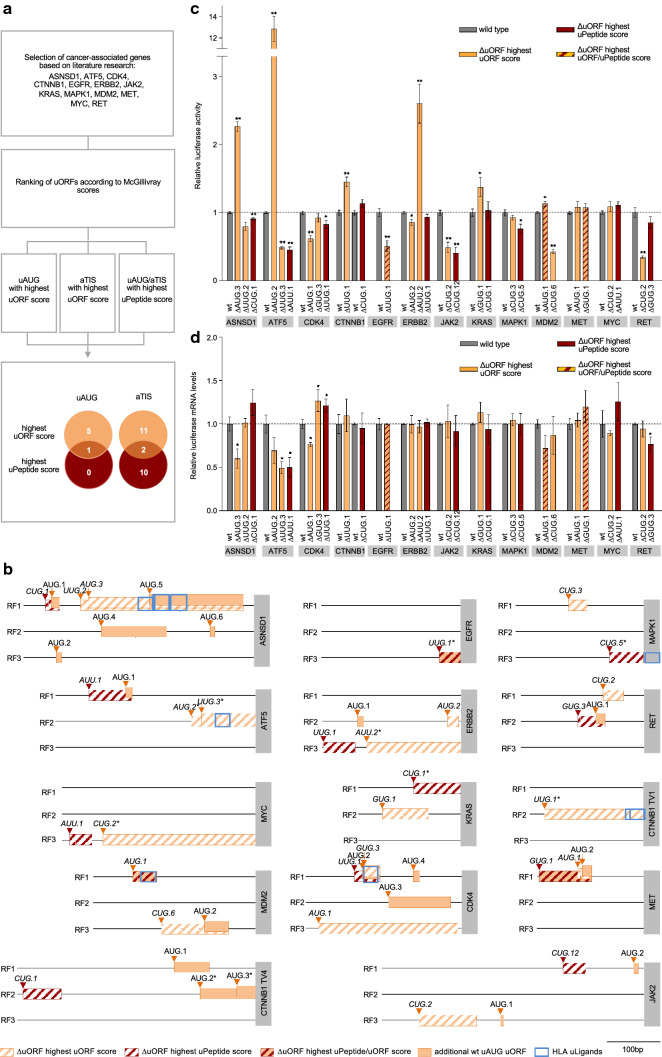
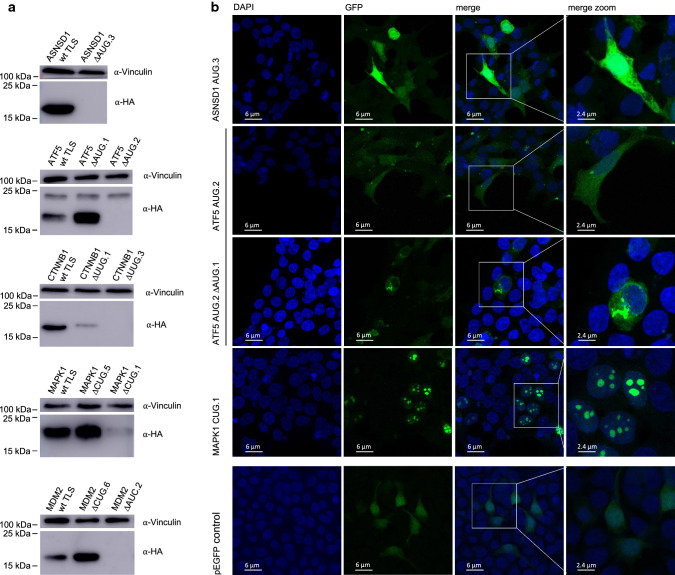
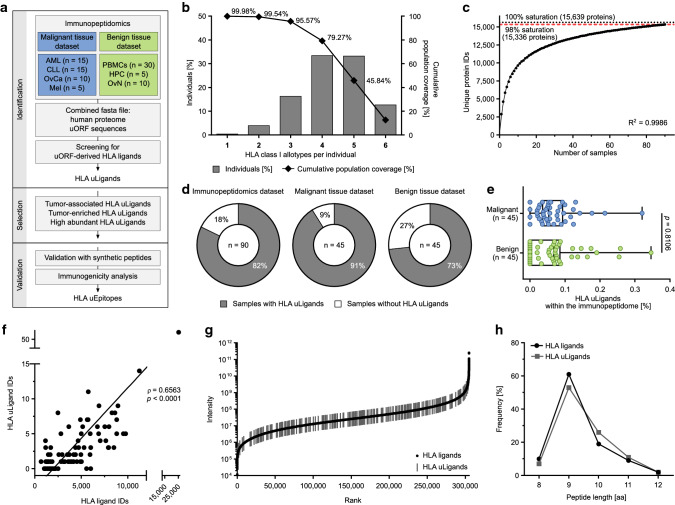
Methods: We examined the translational regulatory effect of 29 uORFs in 13 cancer-associated genes by dual-luciferase assays. Cellular expression and localization of uORF-encoded peptides (uPeptides) were investigated by immunoblotting and immunofluorescence-based microscopy. Furthermore, we utilized mass spectrometry-based immunopeptidome analyses in an extensive dataset of primary malignant and benign tissue samples for the identification of naturally presented uORF-derived HLA-presented peptides screening for more than 2000 uORFs.

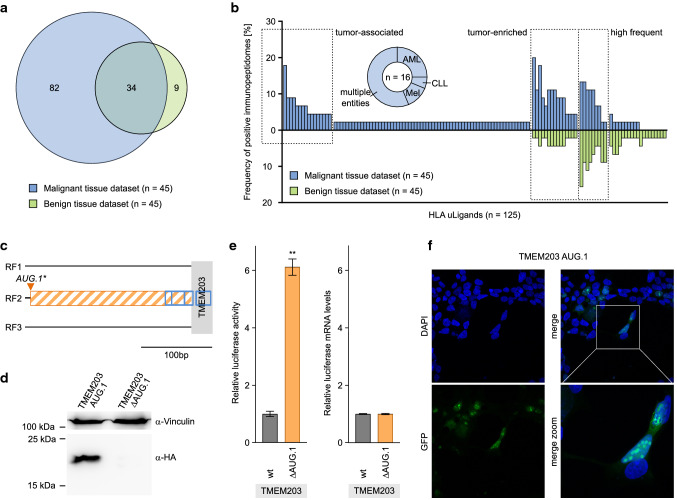
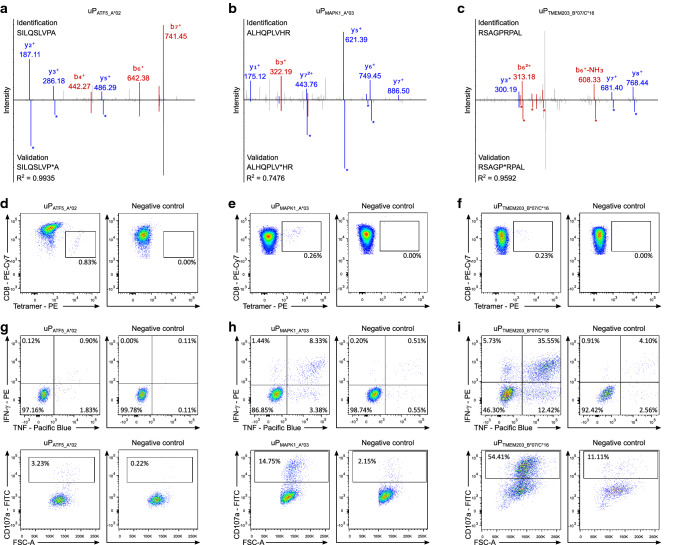
Results: We provide experimental evidence for similarly effective translational regulation of cancer-associated transcripts through uORFs initiated by either canonical AUG codons or by alternative translation initiation sites (aTISs). We further demonstrate frequent cellular expression and reveal occasional specific cellular localization of uORF-derived peptides, suggesting uPeptide-specific biological implications. Immunopeptidome analyses delineated a set of 125 naturally presented uORF-derived HLA-presented peptides. Comparative immunopeptidome profiling of malignant and benign tissue-derived immunopeptidomes identified several tumor-associated uORF-derived HLA ligands capable to induce multifunctional T cell responses.

Conclusion: Our data provide direct evidence for the frequent expression of uPeptides in benign and malignant human tissues, suggesting a potentially widespread function of uPeptides in cancer biology. These findings may inspire novel approaches in direct molecular as well as immunotherapeutic targeting of cancer-associated uORFs and uPeptides.

Keywords: Cancer; Immunopeptidomics; Mass spectrometry; Translational control; uORF.


Conflict of interest statement

H.-G.R. is shareholder of Immatics Biotechnologies GmbH, Synimmune GmbH, and Curevac AG. The other authors declare no competing interests.

Figures

Fig. 1
Fig. 1
Translational regulation of CDS expression through uORFs in cancer-associated transcripts. a Flowchart illustrating the selection process for uORFs initiated at canonical (uAUG) and at alternative translational initiation sites (aTIS) for functional analysis. b Schematic illustrations of indicated in-scale TLSs displaying the analyzed uORFs (stripped boxes) and additional wild type AUG uORFs (wt, filled orange boxes) on reading frames (RF) 1–3 (black lines). Upstream ORFs overlapping into the CDS are marked with an asterisk at the respective start codon. Grey boxes on the right contain gene symbols and indicate the start of the CDS. Note that for CTNNB1 the uORFs with the highest uORF- and uPeptid-scores mapped to distinct transcript variants. Accordingly, both were selected for experimental analysis. c Bar graphs showing relative Firefly luciferase activities detected for indicated wild type (wt) and ΔuORF TLSs normalized to Renilla luciferase internal controls. Results are combined from three independent experiments and error bars indicate SEM. Levels of significance are p ≤ 0.05 (*) and p ≤ 0.01 (**) as determined by two-tailed nonparametric Mann–Whitney U-tests. d Bar graphs indicating relative Firefly luciferase mRNA levels for indicated wt and ΔuORF TLSs normalized to Renilla luciferase internal control. Results are combined from three independent experiments and error bars indicate SEM. Levels of significance are p ≤ 0.05 (*) and p ≤ 0.01 (**) as determined by two-tailed nonparametric Mann–Whitney U-tests
Fig. 2
Fig. 2
Evidence for translation and specific cellular localization of uPeptides in cancer-associated transcripts. a Representative immunoblots of ≥ 3 independent experiments using HEK293T cell lysates prepared 52 h after transfection of expression vectors containing indicated triple HA-tagged wt and ΔuORF TLS variants. Eight hours prior to lysis cells were exposed to proteasome inhibitor MG132. b Representative pictures of ≥ 3 independent experiments showing the expression and intracellular localization of indicated EGFP-tagged uPeptides as detected 24 h after transfection of HEK293T cells. Upstream peptides were expressed from TLS-EGFP-expression vectors containing the complete 5′-upstream sequence of indicated wt TLSs and an EGFP-tag replacing the uStop codon of the investigated uORF. The pictures shown here are presented as merged z-stack images. Additional pictures are presented in Supplementary Fig. 5
Fig. 3
Fig. 3
Mass spectrometry-based identification of uORF-derived HLA ligands. a Workflow of immunopeptidomics-based identification of uORF-derived HLA ligands (HLA uLigands) and T cell epitopes (HLA uEpitopes). b HLA class I allotype population coverage within the immunopeptidomics dataset (n = 90) compared to the world population (calculated by the IEDB population coverage tool, www.iedb.org). The frequencies of individuals within the world population carrying up to six HLA allotypes (x-axis) included in the immunopeptidomics dataset are indicated as grey bars on the left y-axis. The cumulative percentage of population coverage is depicted as black dots on the right y-axis. c Saturation analysis of HLA ligand source proteins of the immunopeptidomics dataset (n = 90). Number of unique HLA ligand source protein identifications shown as a function of cumulative immunopeptidome analysis. Exponential regression allowed for the robust calculation (R2 = 0.9986) of the maximum attainable number of different source protein identifications (100% saturation, dotted line). The dashed red line depicts the source proteome coverage achieved in the immunopeptidome dataset. d Pie charts depicting the percentage of samples with identified HLA uLigands within the total immunopeptidomics dataset comprising malignant and benign tissue samples (n = 90, left panel) as well as within the malignant (n = 45, middle panel) and benign (n = 45, right panel) tissue datasets separately. e Percentage of HLA uLigands within the immunopeptidome of malignant and benign tissue samples (boxes represent median and 25th–75th percentiles, whiskers are minimum to maximum, two-sided Mann–Whitney U-test). f Correlation of total HLA ligand identifications with HLA uLigand identifications in the immunopeptidome dataset (n = 90). Dots represent individual samples. Spearman’s rho (ρ) and p-value. g Ranked intensity values of mass spectrometry-acquired data derived from the combined immunopeptidomes of all samples (n = 90). Positions of HLA uLigands are projected on the curve. h Peptide length distribution of HLA uLigands and all identified HLA ligands. AML acute myeloid leukemia, CLL chronic lymphocytic leukemia, OvCa ovarian carcinoma, Mel melanoma, PBMCs peripheral blood mononuclear cells, HPC CD34-enriched hematopoietic progenitor cells, OvN benign ovaries, HLA uLigands uORF-derived HLA ligands, IDs identifications, aa amino acid
Fig. 4
Fig. 4
Comparative immunopeptidome profiling identified uORF-derived tumor antigens. a Overlap analysis of uORF-derived HLA ligand identifications of primary malignant (n = 45) and benign (n = 45) tissue samples. b Comparative profiling of HLA uLigands (n = 125) based on HLA-restricted presentation frequency in malignant and benign immunopeptidomes. Frequencies of positive immunopeptidomes for the respective HLA uLigands (x-axis) are indicated on the y-axis. The left box highlights tumor-associated antigens (n = 16) showing malignant-exclusive frequent presentation. The donut chart displays the entity specificity of tumor-associated HLA uLigands. The middle box marks tumor-enriched antigens displaying two-fold representation frequency on malignant compared to benign tissue samples. The right box highlights high abundant antigens (n = 9) showing a frequent presentation in ≥ 5 samples. c Schematic illustration of the TMEM203 TLS displaying the only canonical uORF (hatched orange box) on reading frame 2 (black line). The grey box indicates the start of the CDS. Blue open boxes mark the identified HLA uLigands. d Representative immunoblot of ≥ 3 independent experiments using HEK293T cell lysates prepared 52 h after transfection of expression vectors containing 3xHA-tagged TMEM203 AUG.1 wt and ΔuORF-TLSs. Eight hours prior to lysis the cells were exposed to proteasome inhibitor MG132. Exposure time was 3.5 min. e Bar graph showing relative Firefly luciferase activities and mRNA levels detected for indicated wt and ΔuORF TMEM203 TLSs normalized to Renilla luciferase internal controls. Results are combined from three independent experiments. Error bars indicate SEM. Level of significance p ≤ 0.01 (**) as determined by two-tailed nonparametric Mann–Whitney U-tests. f Representative pictures of ≥ 3 independent experiments showing the intracellular localization of the EGFP-tagged TMEM203 AUG.1 uPeptide as detected 24 h after transfection of HEK293T cells. AML acute myeloid leukemia, CLL chronic lymphocytic leukemia, Mel melanoma, RF reading frame, wt wild type
Fig. 5
Fig. 5
Spectral validation and immunogenicity analyses of uORF-derived tumor antigens. ac Validation of the experimentally eluted peptides a uPATF5_A*02, b uPMAPK1_A*03, and c uPTMEM203_B*07/C*16. Comparison of fragment spectra (m/z on x-axis) of HLA uLigands eluted from primary samples (identification) to their corresponding isotope-labeled synthetic peptides (validation, mirrored on the x-axis) with the calculated spectral correlation coefficient (R2). Identified b- and y-ions are marked in red and blue, respectively. Ions containing isotope-labeled amino acids are marked with asterisks. df Naïve CD8+ T cells were primed in vitro using HLA uLigand-loaded aAPCs with the HLA-A*02-, -A*03-, and -B*07-restricted peptides d uPATF5_A*02, e uPMAPK1_A*03, and f uPTMEM203_B*07/C*16, respectively. Graphs show single, viable cells stained for CD8 and PE-conjugated multimers of indicated specificity. The left panels show HLA uLigand tetramer staining, the right panels (negative control) depict tetramer staining of T cells from the same donor primed with an HLA-matched control peptide. gi Functional characterization of HLA uLigand-specific CD8+ T cells by intracellular cytokine staining. Representative examples of IFN-γ and TNF production (upper panels) as well as CD107a expression (lower panels) after stimulation of g uPATF5_A*02-, h uPMAPK1_A*03-, and i uPTMEM203_B*07/C*16-specific CD8+ T cells with the HLA-A*02-, -A*03-, and -B*07-restricted peptides uPATF5_A*02, uPMAPK1_A*03, and uPTMEM203_B*07/C*16, respectively (left panels) compared to a negative HLA-matched control peptide (right panels)

References

    1. Ingolia NT, Lareau LF, Weissman JS. Ribosome profiling of mouse embryonic stem cells reveals the complexity and dynamics of mammalian proteomes. Cell. 2011;147:789–802. - PMC - PubMed
    1. Ingolia NT, Ghaemmaghami S, Newman JRS, Weissman JS. Genome-wide analysis in vivo of translation with nucleotide resolution using ribosome profiling. Science. 2009;324:218–223. - PMC - PubMed
    1. McGillivray P, et al. A comprehensive catalog of predicted functional upstream open reading frames in humans. Nucleic Acids Res. 2018;46:3326–3338. - PMC - PubMed
    1. Johnstone TG, Bazzini AA, Giraldez AJ. Upstream ORF s are prevalent translational repressors in vertebrates. EMBO J. 2016;35:706–723. - PMC - PubMed
    1. Wethmar K, et al. Comprehensive translational control of tyrosine kinase expression by upstream open reading frames. Oncogene. 2016;35:1736–1742. - PMC - PubMed