. 2022 Mar 4;375(6584):1000-1005.
doi: 10.1126/science.abg0162. Epub 2022 Mar 3.

Transcriptional neighborhoods regulate transcript isoform lengths and expression levels

Affiliations

Transcriptional neighborhoods regulate transcript isoform lengths and expression levels

Aaron N Brooks et al. Science. .

Abstract

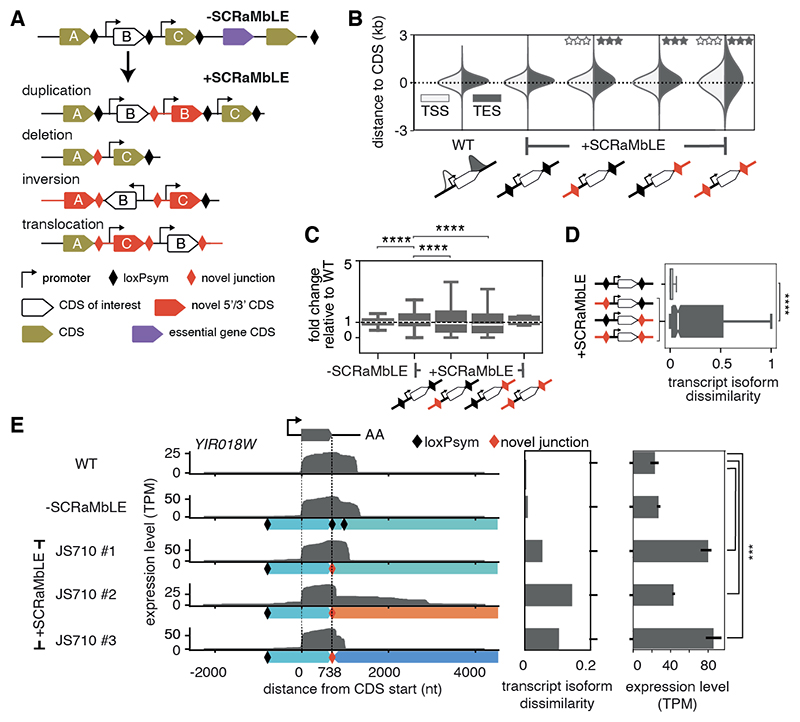
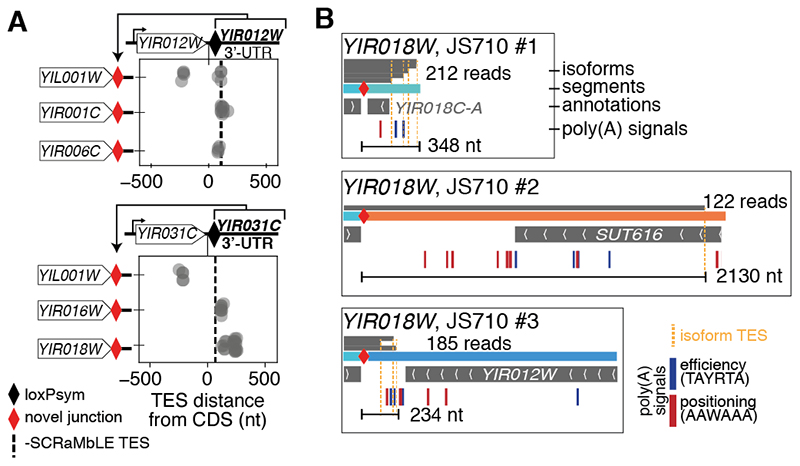
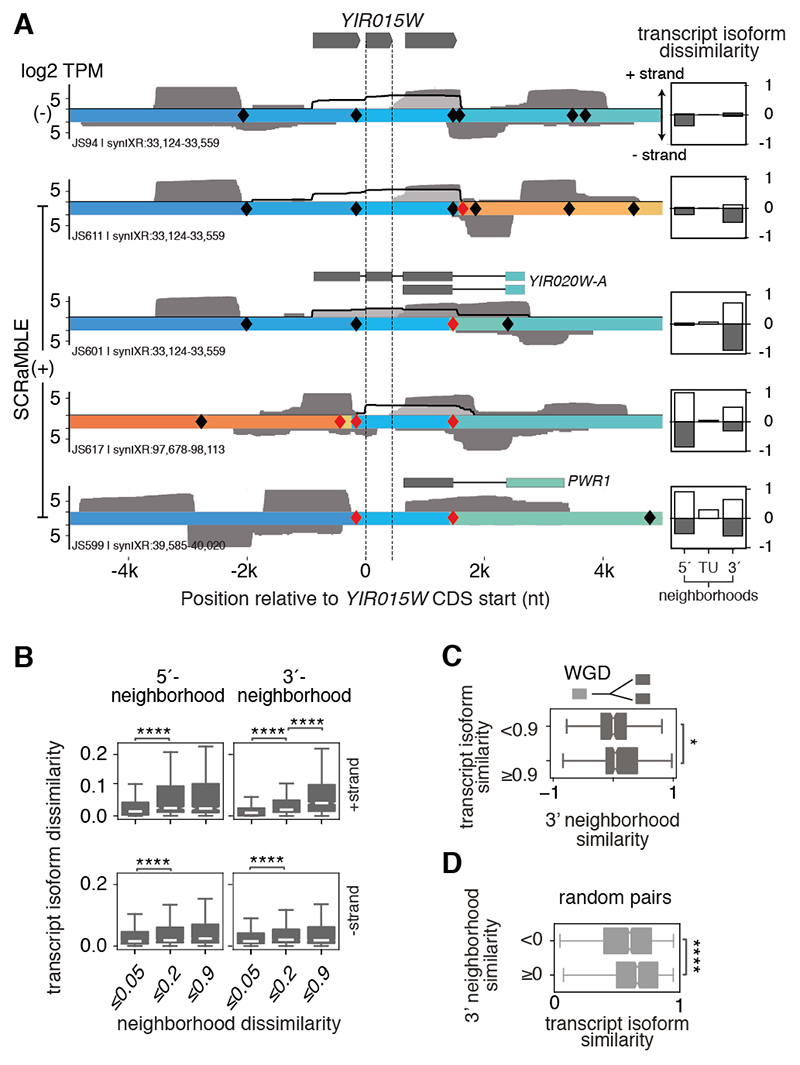
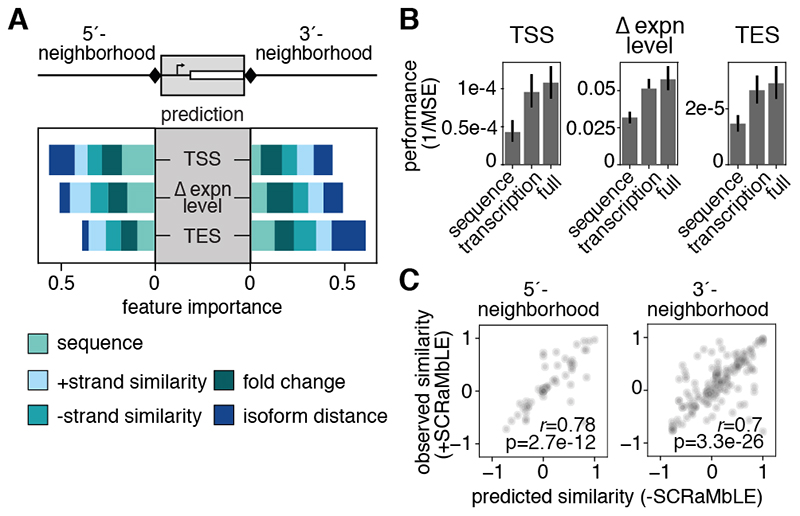
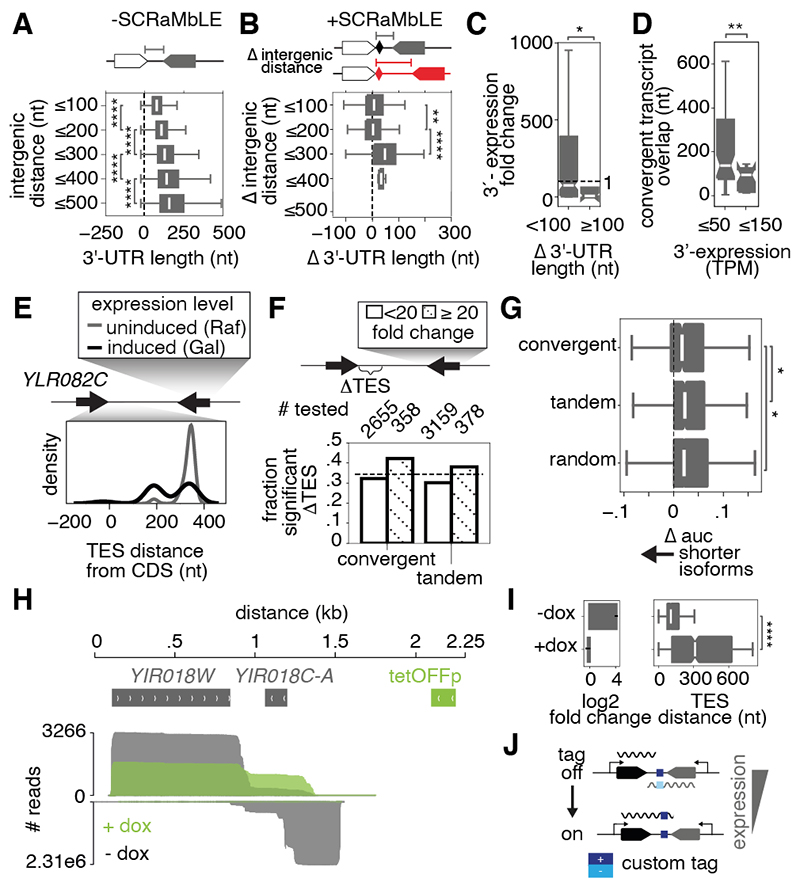
Sequence features of genes and their flanking regulatory regions are determinants of RNA transcript isoform expression and have been used as context-independent plug-and-play modules in synthetic biology. However, genetic context-including the adjacent transcriptional environment-also influences transcript isoform expression levels and boundaries. We used synthetic yeast strains with stochastically repositioned genes to systematically disentangle the effects of sequence and context. Profiling 120 million full-length transcript molecules across 612 genomic perturbations, we observed sequence-independent alterations to gene expression levels and transcript isoform boundaries that were influenced by neighboring transcription. We identified features of transcriptional context that could predict these alterations and used these features to engineer a synthetic circuit where transcript length was controlled by neighboring transcription. This demonstrates how positional context can be leveraged in synthetic genome engineering.


Conflict of interest statement

Competing interests: L.A.M. is also affiliated with Neochromosome, Inc.

Figures

Fig. 1
Fig. 1. Genome rearrangement alters transcript isoform expression and boundaries.
(A) Schematic showing SCRaMbLE-induced rearrangements between loxPsym sites (black diamonds) at the 3’ end of all non-essential gene CDSs in the synthetic chromosome, synIXR, inducing multiple possible rearrangements of a CDS (‘B’, here) with novel junctions (red diamonds). (B) Distributions of TSS (white) and TES (gray) distances from gene CDSs in BY4741 (WT) and +SCRaMbLE strains, divided into rearrangements with novel (red) or native (black) 5’- and/or 3’- junctions. Stars indicate significant difference in variance from WT based on Levene’s test for equality of variances (q ≤ 0.001). (C) Distribution of gene expression fold-changes compared to WT for -SCRaMbLE and +SCRaMbLE strains, divided into those with novel (red) or native (black) 5’- and/or 3’-junctions. (D) Degree of transcript isoform dissimilarity from WT for genes with novel 5’- and/or 3’-junctions (red) compared to genes in native arrangements (black) in SCRaMbLE strains. (E) Transcript expression of the YIR018W gene in different contexts: WT (top), the non-rearranged synIXR strain (-SCRaMbLE, JS94), and three contexts in a single +SCRaMbLE strain (JS710 #1, #2, and #3). Left plot: full-length transcript reads aligned by the CDS (flanked by dotted lines). Middle plot: transcript isoform dissimilarity, calculated as in D. Right plot: Salmon quantified expression levels from Illumina stranded mRNA sequencing. Genomic segments below the read-tracks are colored according to their original position on synIXR as in (16). LoxPsym sites and novel junctions are denoted by black and red diamonds, respectively. TPM: transcripts per million. Bars indicate 95% confidence interval based on 3 biological replicates. Boxplots indicate median and interquartile range (IQR), and whiskers extend to the minimum and maximum values within 1.5x IQR. Notches indicate 95% confidence intervals. Asterisks denote significance levels in Mann-Whitney U test, *** p ≤1e-3, **** p ≤1e-4.
Fig. 2
Fig. 2. Isoform boundaries are influenced by factors not encoded in the CDS or 3’-UTR sequence.
(A) Examples of two 3’-UTRs (from YIR012W, top and YIR031C, bottom) rearranged to the 3’-end of three different CDSs (depicted left). The position of all isoform TESs relative to the end of the CDS are plotted for each rearrangement. The TES of the major transcript isoform without rearrangement is indicated by the dashed line. Truncated TESs potentially indicate an early termination site in the YIL001W CDS. (B) 3’-ends of YIR018W transcript isoforms (stacked gray bars with total read counts indicated) mapped to three rearrangements in the JS710 SCRaMbLE strain (as in Fig. 1E). Rearranged segments are colored based on their original location on synIXR as in (16). Annotations, and poly(A) signals (efficiency and positioning motifs, shown in blue and red, respectively) are shown below each context. The longest TES distance and total number of reads supporting the isoforms are indicated for each context.
Fig. 3
Fig. 3. Transcript isoforms are altered when transcriptional neighborhoods are perturbed.
(A) Direct RNA transcript reads covering the essential nuclear RNaseP gene, YIR015W, in - SCRaMbLE and four +SCRaMbLE strains. Reads spanning YIR015W CDS are outlined in black with transparent fill; other reads within a +/-5kb region are gray. Sense and antisense reads are above and below genomic segment tracks; segments are colored according to their original position on synIXR as in (16). Gene models show novel polycistronic transcripts incorporating genes from rearranged segments. Quantification of dissimilarity relative to WT expression profiles for each strand (white and gray boxes) in the 5’ and 3’ regions flanking the TU and for the TU, itself, are displayed next to each track. (B) Transcript dissimilarity from WT assessed separately in each panel for rearrangements affecting the 5’ or 3’ transcriptional neighborhood within a 3 kb window, on either strand. (C) The transcriptional similarities of 3’ neighborhoods on both strands are compared for paralogs with more (≥0.9) or less (<0.9) transcript isoform similarity. WGD: whole genome duplication. (D) Transcript isoform similarity of randomly selected gene pairs compared based on the similarity of their downstream transcriptional environment on both strands. Data are represented as the median and interquartile range (IQR) with whiskers extending to the minimum and maximum values within 1.5x IQR. Notches indicate 95% confidence intervals. Asterisks denote significance levels in Mann-Whitney U test *p≤0.05, ****p≤1e-4.
Fig. 4
Fig. 4. Transcriptional neighborhood predicts transcript isoform expression levels and lengths.
(A) Averaged feature importance scores for models predicting TSS or TES positioning or expression level changes (Δ expn) for genes in the SCRaMbLE strains learned using Gradient Boosted Regression Trees (GBRT). Stacked bars show the fractional contribution of sequence features and transcriptional features (transcriptional similarity on either strand, expression level fold change, and distance to the nearest isoform) in the 5’ and 3’ neighborhoods (within 3 kb) for each prediction. The importance of all 5’ and 3’ features sum to one for each prediction task. (B) Performance of models predicting TSS or TES positioning or Δ expn trained using genomic features only (‘sequence’), features related to the transcriptional neighborhood only (‘transcription’) or all features (‘full’). Bars indicate 95% confidence interval across all models. MSE: mean squared error. (C) Observed versus predicted (from -SCRaMbLE) flanking transcriptional similarities for rearranged segments and their correlation (Pearson correlation coefficient, r). Areas of greater density are darker. Since transcript isoform coverage vectors on both strands were used, cosine similarity ranges from -1 to 1.
Fig. 5
Fig. 5. Neighboring gene expression regulates and can be used to engineer 3’-UTR lengths.
(A) 3’-UTR lengths of convergent genes binned by 100 bp increments of intergenic distance in the WT genome. (B) Change in 3’-UTR lengths of convergent gene pairs plotted by increased (100 bp increments) intergenic distance after SCRaMbLE. (C) Expression fold-changes of genes convergent to those with minor (<100 nt) or major (≥100 nt) 3’-UTR extensions after rearrangement. (D) Length of overlap (nt) between novel convergent transcripts where the downstream member is lowly (≤50 TPM) or highly (≤150 TPM) expressed. TPM: transcripts per million. (E) Distribution of YLR082C TESs (relative to its CDS) when the convergent gene is over-expressed (Gal, black) or not (Raf, gray). (F) Fraction of genes in convergent and tandem pairs with significantly altered TES positions (Kolmogorov–Smirnov test, p ≤ 0.001, applied to each gene) when an adjacent gene is ≥20-fold overexpressed (hatched) or not (white) following galactose-induced transcription factor (TF) overexpression. Dashed line indicates the fraction of randomly selected genes with significantly altered TESs in galactose. Number of genes tested are indicated above the bars. (G) Change in 3’-UTR length distributions for convergent, tandem, and random gene pairs upon TF overexpression in galactose, as assessed by the change in the area under the curve (Δ auc) of TES cumulative distributions. Negative values indicate isoform shortening. (H) cDNA sequencing reads aligned to YIR018W (above) and YIR018C-A (below) in a tetracycline-repressible YIR018C-A strain in the absence (gray) and presence (green) of doxycycline. (I) Change in YIR018C-A expression (left), plotted as mean ± standard deviation, and YIR018W 3’-UTR length (right) upon doxycycline-induced inhibition of YIR018C-A expression. (J) The ability to control 3’-UTR length by altering convergent gene expression levels could be applied to embed a reversibly expressed, functional sequence tag in transcript 3’-UTRs. Only adjacent bins were tested for significance in (A) and (B). Boxplots indicate median and interquartile range (IQR), and whiskers extend to the minimum and maximum values within 1.5x IQR. Notches indicate 95% confidence intervals. Asterisks denote significance levels in Mann-Whitney U test, * p ≤0.05, ** p ≤1e-2, *** p ≤1e-3, ****p ≤1e-4.

Comment in

References

    1. Guo Z, Sherman F. Signals sufficient for 3’-end formation of yeast mRNA. Mol Cell Biol. 1996;16:2772–2776. - PMC - PubMed
    1. Ozsolak F, Kapranov P, Foissac S, Kim SW, Fishilevich E, Monaghan AP, John B, Milos PM. Comprehensive polyadenylation site maps in yeast and human reveal pervasive alternative polyadenylation. Cell. 2010;143:1018–1029. - PMC - PubMed
    1. Danino YM, Even D, Ideses D, Juven-Gershon T. The core promoter: At the heart of gene expression. Biochim Biophys Acta. 2015;1849:1116–1131. - PubMed
    1. Lubliner S, Regev I, Lotan-Pompan M, Edelheit S, Weinberger A, Segal E. Core promoter sequence in yeast is a major determinant of expression level. Genome Res. 2015;25:1008–1017. - PMC - PubMed
    1. Curran KA, Karim AS, Gupta A, Alper HS. Use of expression-enhancing terminators in Saccharomyces cerevisiae to increase mRNA half-life and improve gene expression control for metabolic engineering applications. Metab Eng. 2013;19:88–97. - PMC - PubMed

Publication types