. 2022 Mar 4;375(6584):eabk2432.
doi: 10.1126/science.abk2432. Epub 2022 Mar 4.

Fly Cell Atlas: A single-nucleus transcriptomic atlas of the adult fruit fly

Hongjie Li #  1   2   3 Jasper Janssens #  4   5 Maxime De Waegeneer  4   5 Sai Saroja Kolluru  6   7   8 Kristofer Davie  4 Vincent Gardeux  9   10 Wouter Saelens  9   10 Fabrice P A David  9   10   11 Maria Brbić  8   12 Katina Spanier  4   5 Jure Leskovec  8   12 Colleen N McLaughlin  1 Qijing Xie  1 Robert C Jones  6   7   8 Katja Brueckner  13 Jiwon Shim  14 Sudhir Gopal Tattikota  15   16 Frank Schnorrer  17 Katja Rust  18   19 Todd G Nystul  19 Zita Carvalho-Santos  20 Carlos Ribeiro  20 Soumitra Pal  21 Sharvani Mahadevaraju  22 Teresa M Przytycka  21 Aaron M Allen  23 Stephen F Goodwin  23 Cameron W Berry  24 Margaret T Fuller  24 Helen White-Cooper  25 Erika L Matunis  26 Stephen DiNardo  27   28 Anthony Galenza  29 Lucy Erin O'Brien  29 Julian A T Dow  30 FCA Consortium§Heinrich Jasper  31 Brian Oliver  22 Norbert Perrimon  15   16 Bart Deplancke  9   10 Stephen R Quake  6   7   8 Liqun Luo  1 Stein Aerts  4   5 Devika Agarwal  32 Yasir Ahmed-Braimah  33 Michelle Arbeitman  34 Majd M Ariss  35 Jordan Augsburger  13 Kumar Ayush  12 Catherine C Baker  36 Torsten Banisch  37 Katja Birker  38 Rolf Bodmer  38 Benjamin Bolival  36 Susanna E Brantley  36 Julie A Brill  39   40 Nora C Brown  41 Norene A Buehner  41 Xiaoyu Tracy Cai  31 Rita Cardoso-Figueiredo  20 Fernando Casares  42 Amy Chang  43 Thomas R Clandinin  44 Sheela Crasta  6   7   8 Claude Desplan  45 Angela M Detweiler  8 Darshan B Dhakan  20 Erika Donà  46 Stefanie Engert  43 Swann Floc'hlay  4   5 Nancy George  47 Amanda J González-Segarra  43 Andrew K Groves  3   48 Samantha Gumbin  29 Yanmeng Guo  49   50 Devon E Harris  36 Yael Heifetz  51 Stephen L Holtz  52 Felix Horns  53 Bruno Hudry  54 Ruei-Jiun Hung  15 Yuh Nung Jan  49   50 Jacob S Jaszczak  49   50 Gregory S X E Jefferis  46 Jim Karkanias  8 Timothy L Karr  55 Nadja Sandra Katheder  31 James Kezos  38 Anna A Kim  29   56   57 Seung K Kim  24   58 Lutz Kockel  24 Nikolaos Konstantinides  59 Thomas B Kornberg  60 Henry M Krause  61 Andrew Thomas Labott  29 Meghan Laturney  43 Ruth Lehmann  62 Sarah Leinwand  43 Jiefu Li  1 Joshua Shing Shun Li  15 Kai Li  49   50 Ke Li  49   50 Liying Li  49   50 Tun Li  49   50 Maria Litovchenko  9   10 Han-Hsuan Liu  49   50 Yifang Liu  15 Tzu-Chiao Lu  2 Jonathan Manning  47 Anjeli Mase  13 Mikaela Matera-Vatnick  41 Neuza Reis Matias  36 Caitlin E McDonough-Goldstein  63   64 Aaron McGeever  8 Alex D McLachlan  65 Paola Moreno-Roman  29 Norma Neff  8 Megan Neville  23 Sang Ngo  29 Tanja Nielsen  38 Caitlin E O'Brien  49   50 David Osumi-Sutherland  66 Mehmet Neset Özel  67 Irene Papatheodorou  47 Maja Petkovic  49   50 Clare Pilgrim  68 Angela Oliveira Pisco  8 Carolina Reisenman  43 Erin Nicole Sanders  29 Gilberto Dos Santos  69 Kristin Scott  43 Aparna Sherlekar  29 Philip Shiu  43 David Sims  32 Rene V Sit  8 Maija Slaidina  70 Harold E Smith  71 Gabriella Sterne  43 Yu-Han Su  29 Daniel Sutton  72 Marco Tamayo  38 Michelle Tan  8 Ibrahim Tastekin  20 Christoph Treiber  73 David Vacek  1 Georg Vogler  38 Scott Waddell  73 Wanpeng Wang  60 Rachel I Wilson  52 Mariana F Wolfner  41 Yiu-Cheung E Wong  36 Anthony Xie  1 Jun Xu  15 Shinya Yamamoto  3   74 Jia Yan  8 Zepeng Yao  43 Kazuki Yoda  29 Ruijun Zhu  49   50 Robert P Zinzen  75
Affiliations

Fly Cell Atlas: A single-nucleus transcriptomic atlas of the adult fruit fly

Hongjie Li et al. Science. .

Abstract

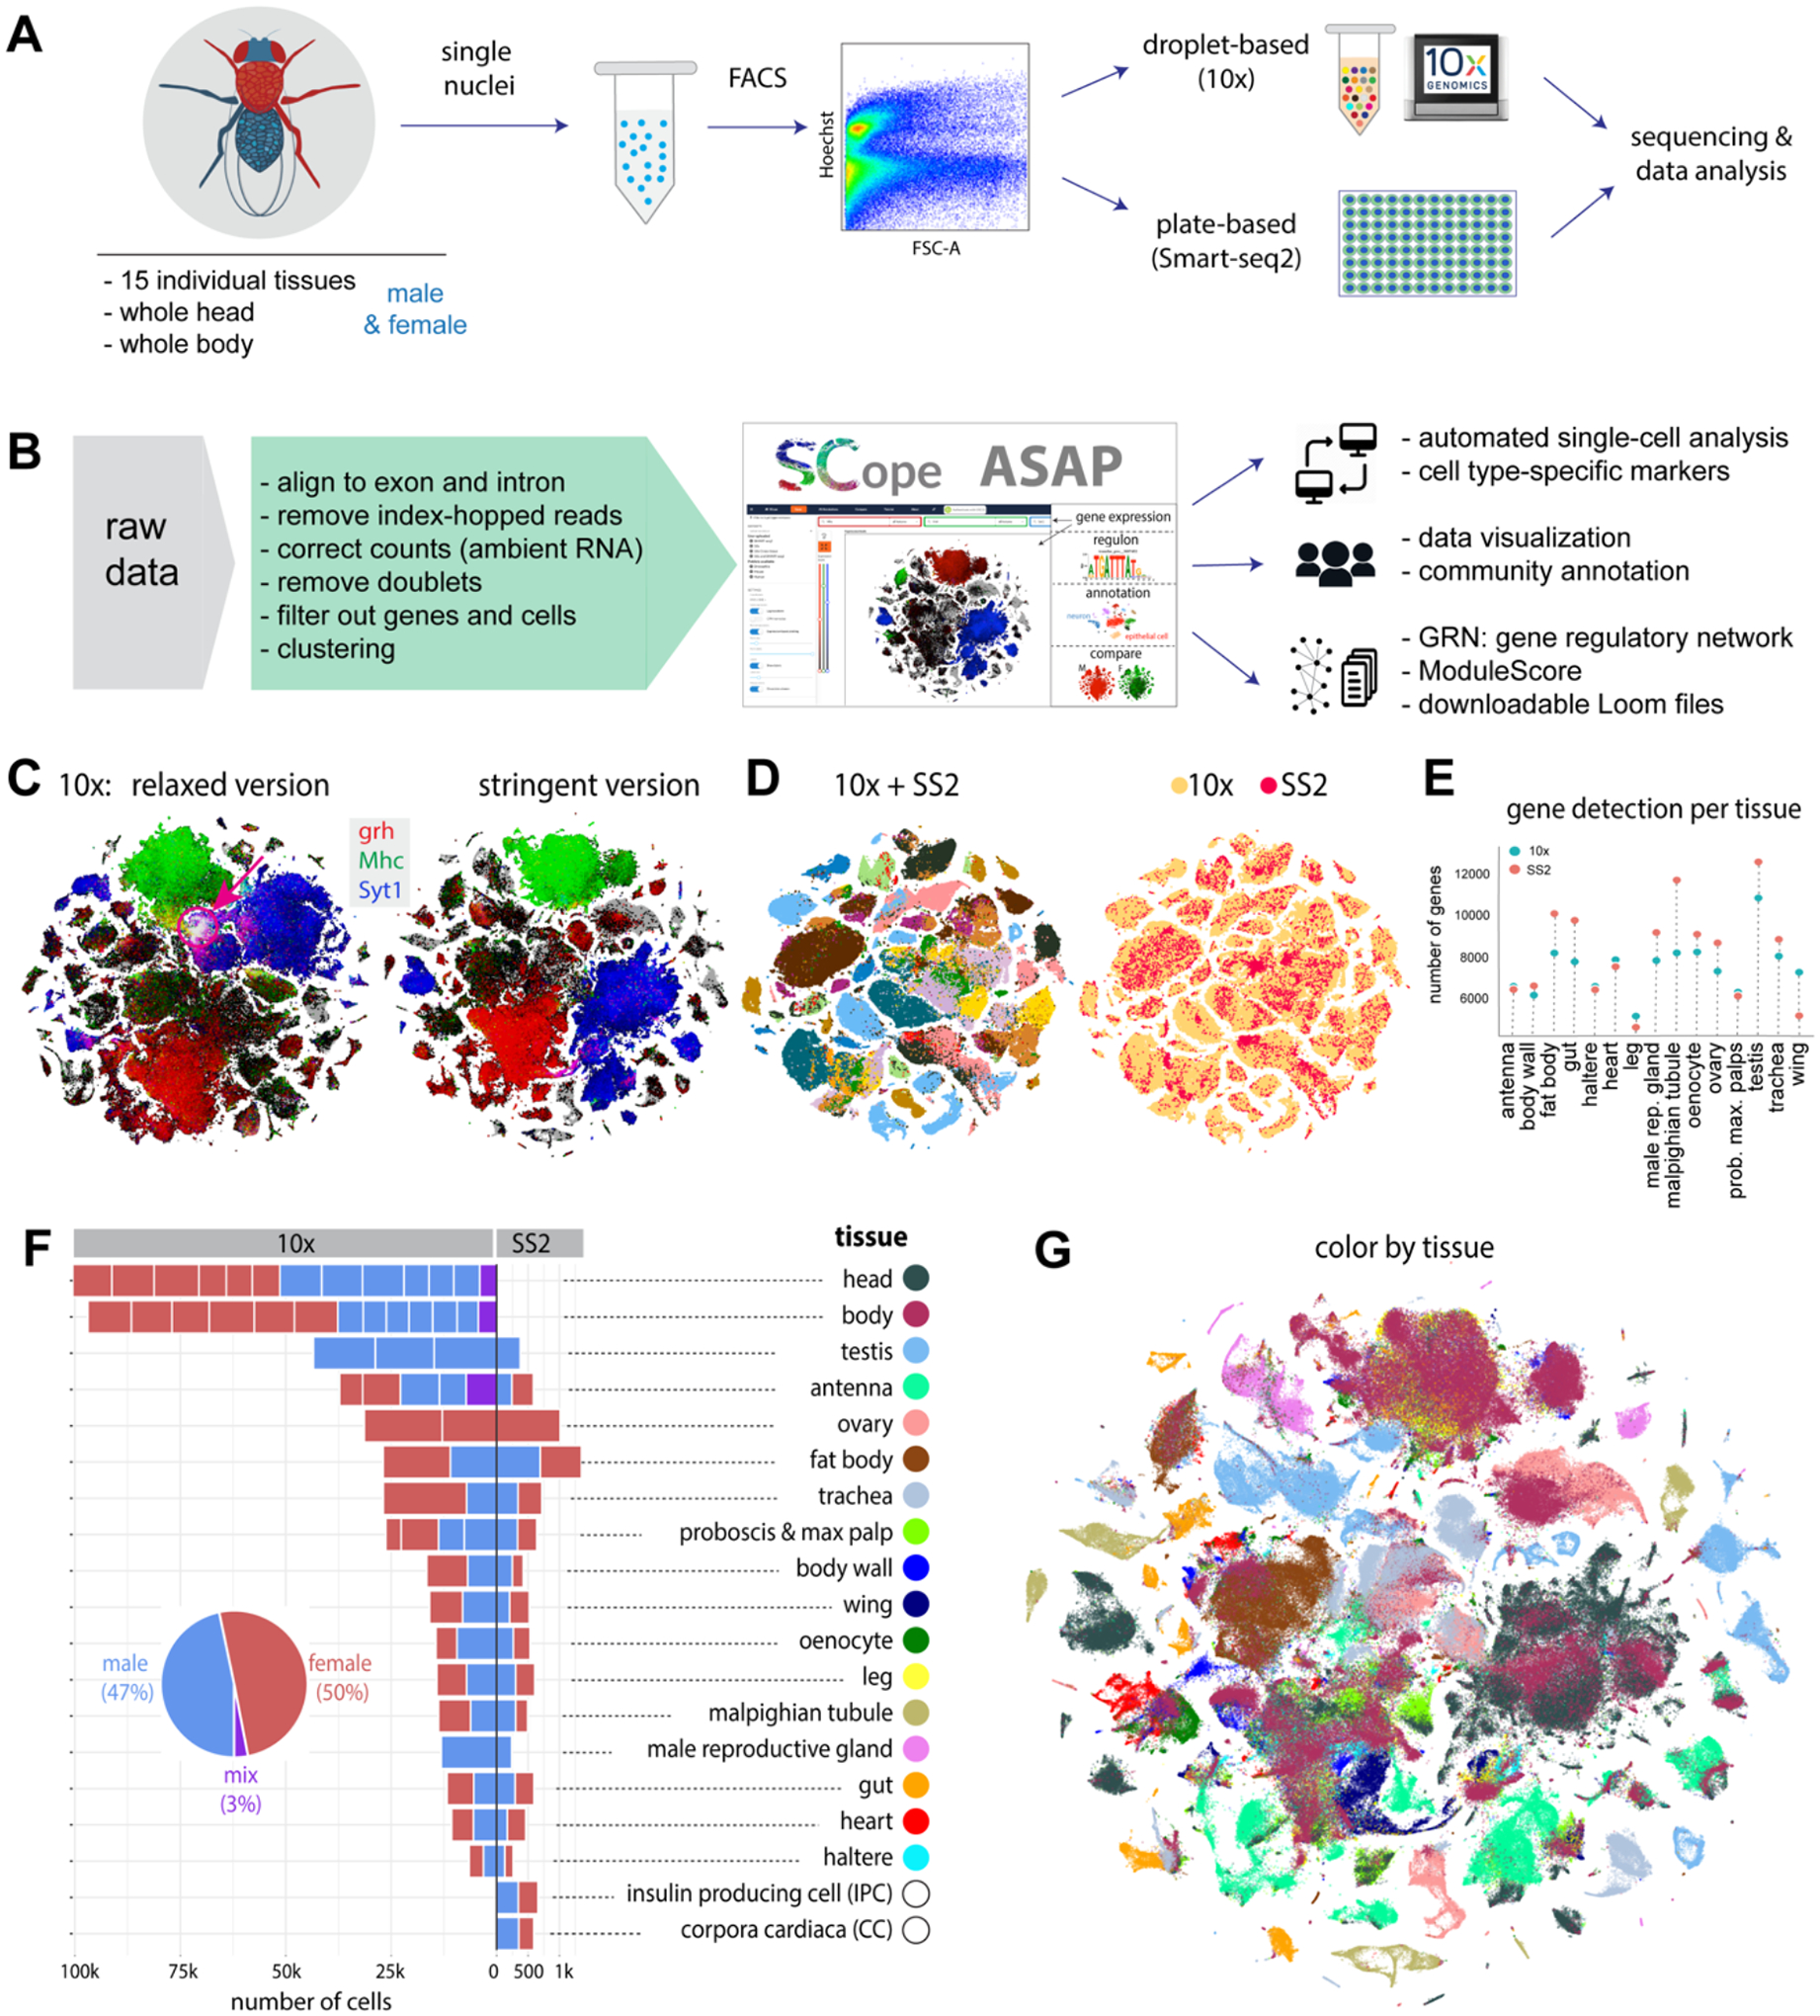
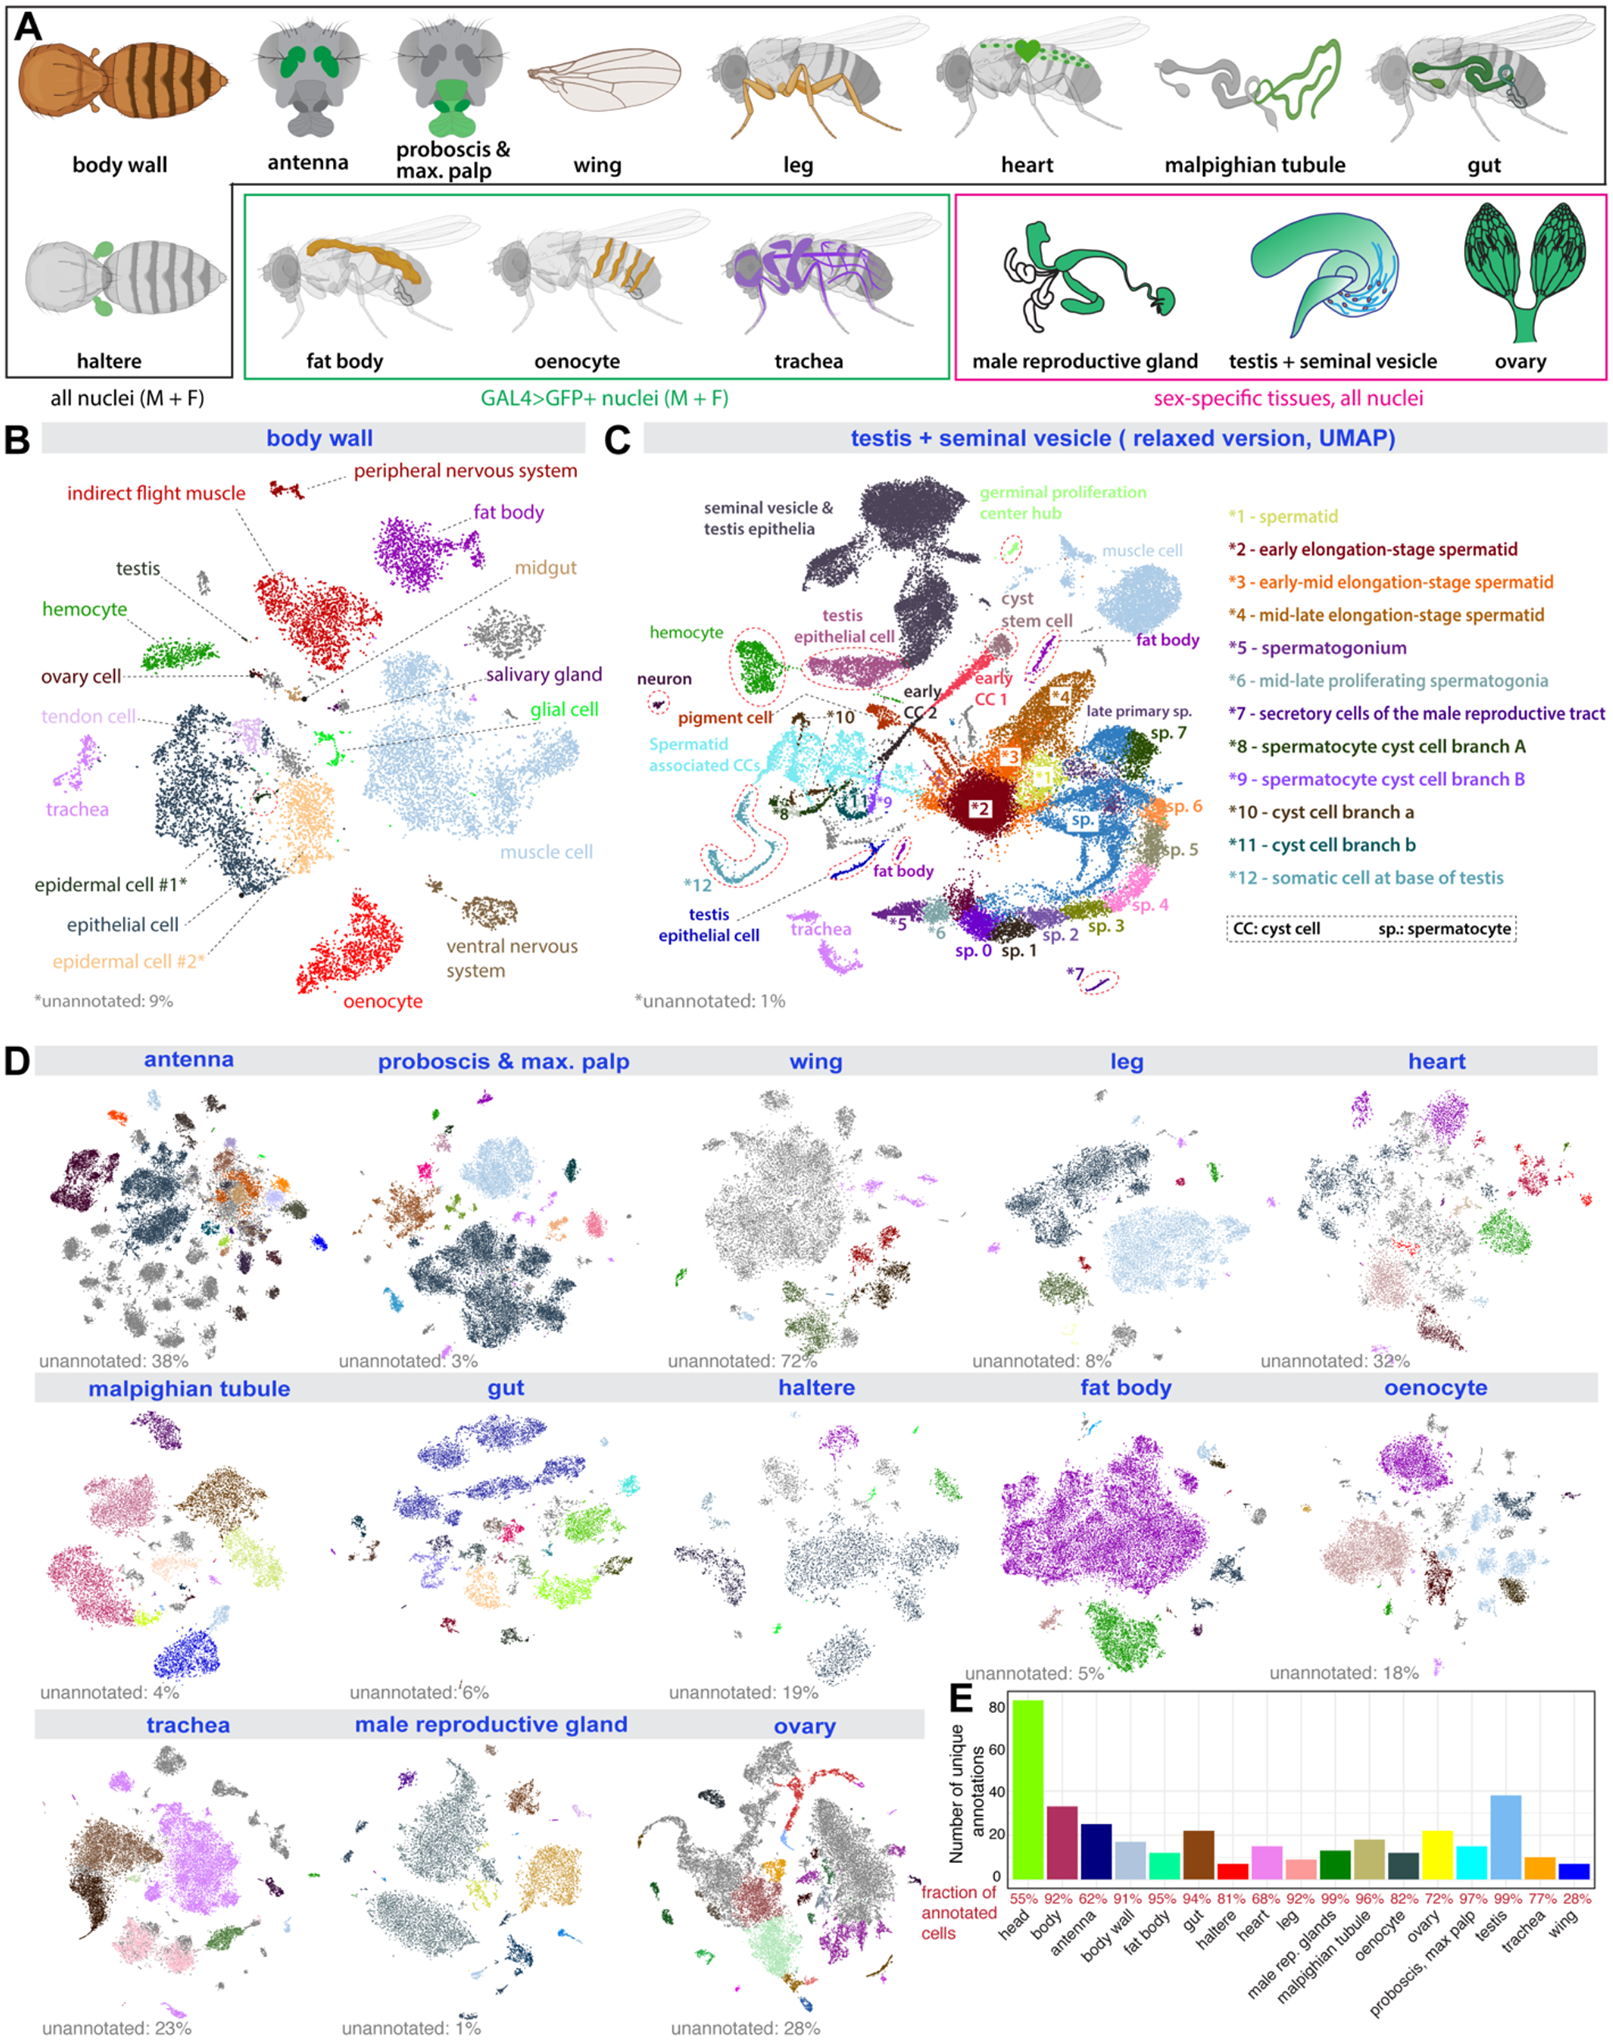
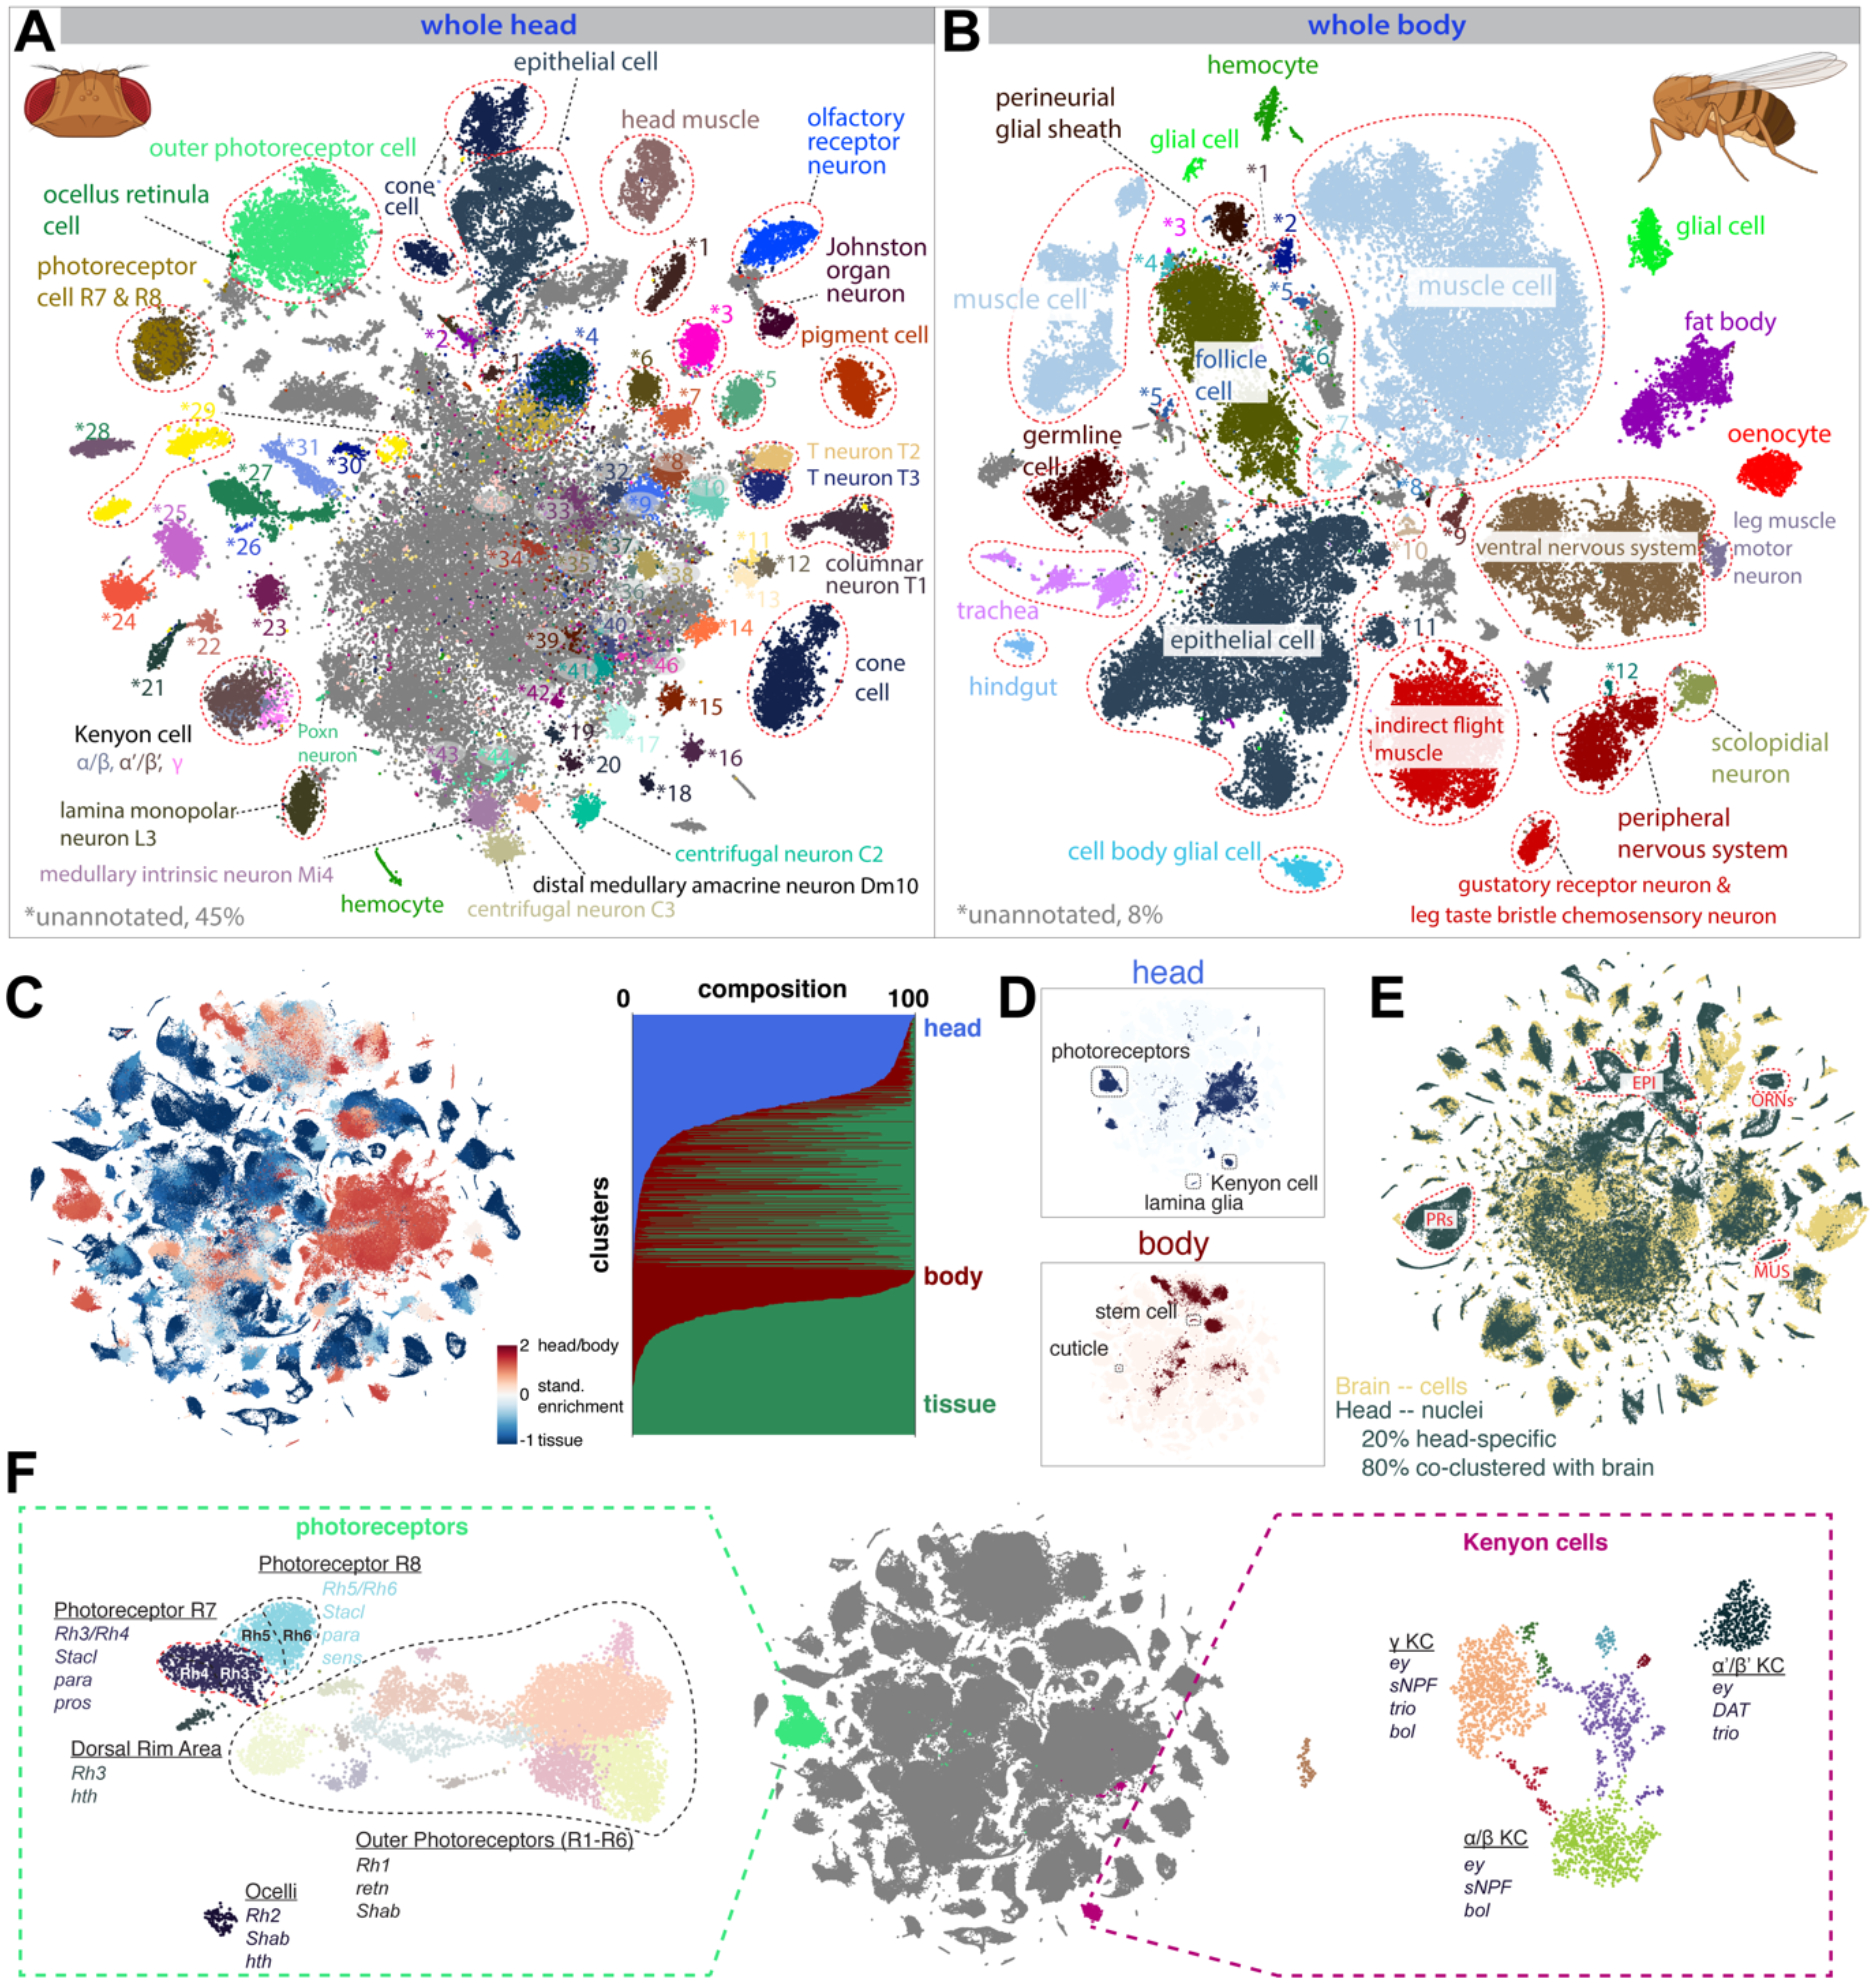
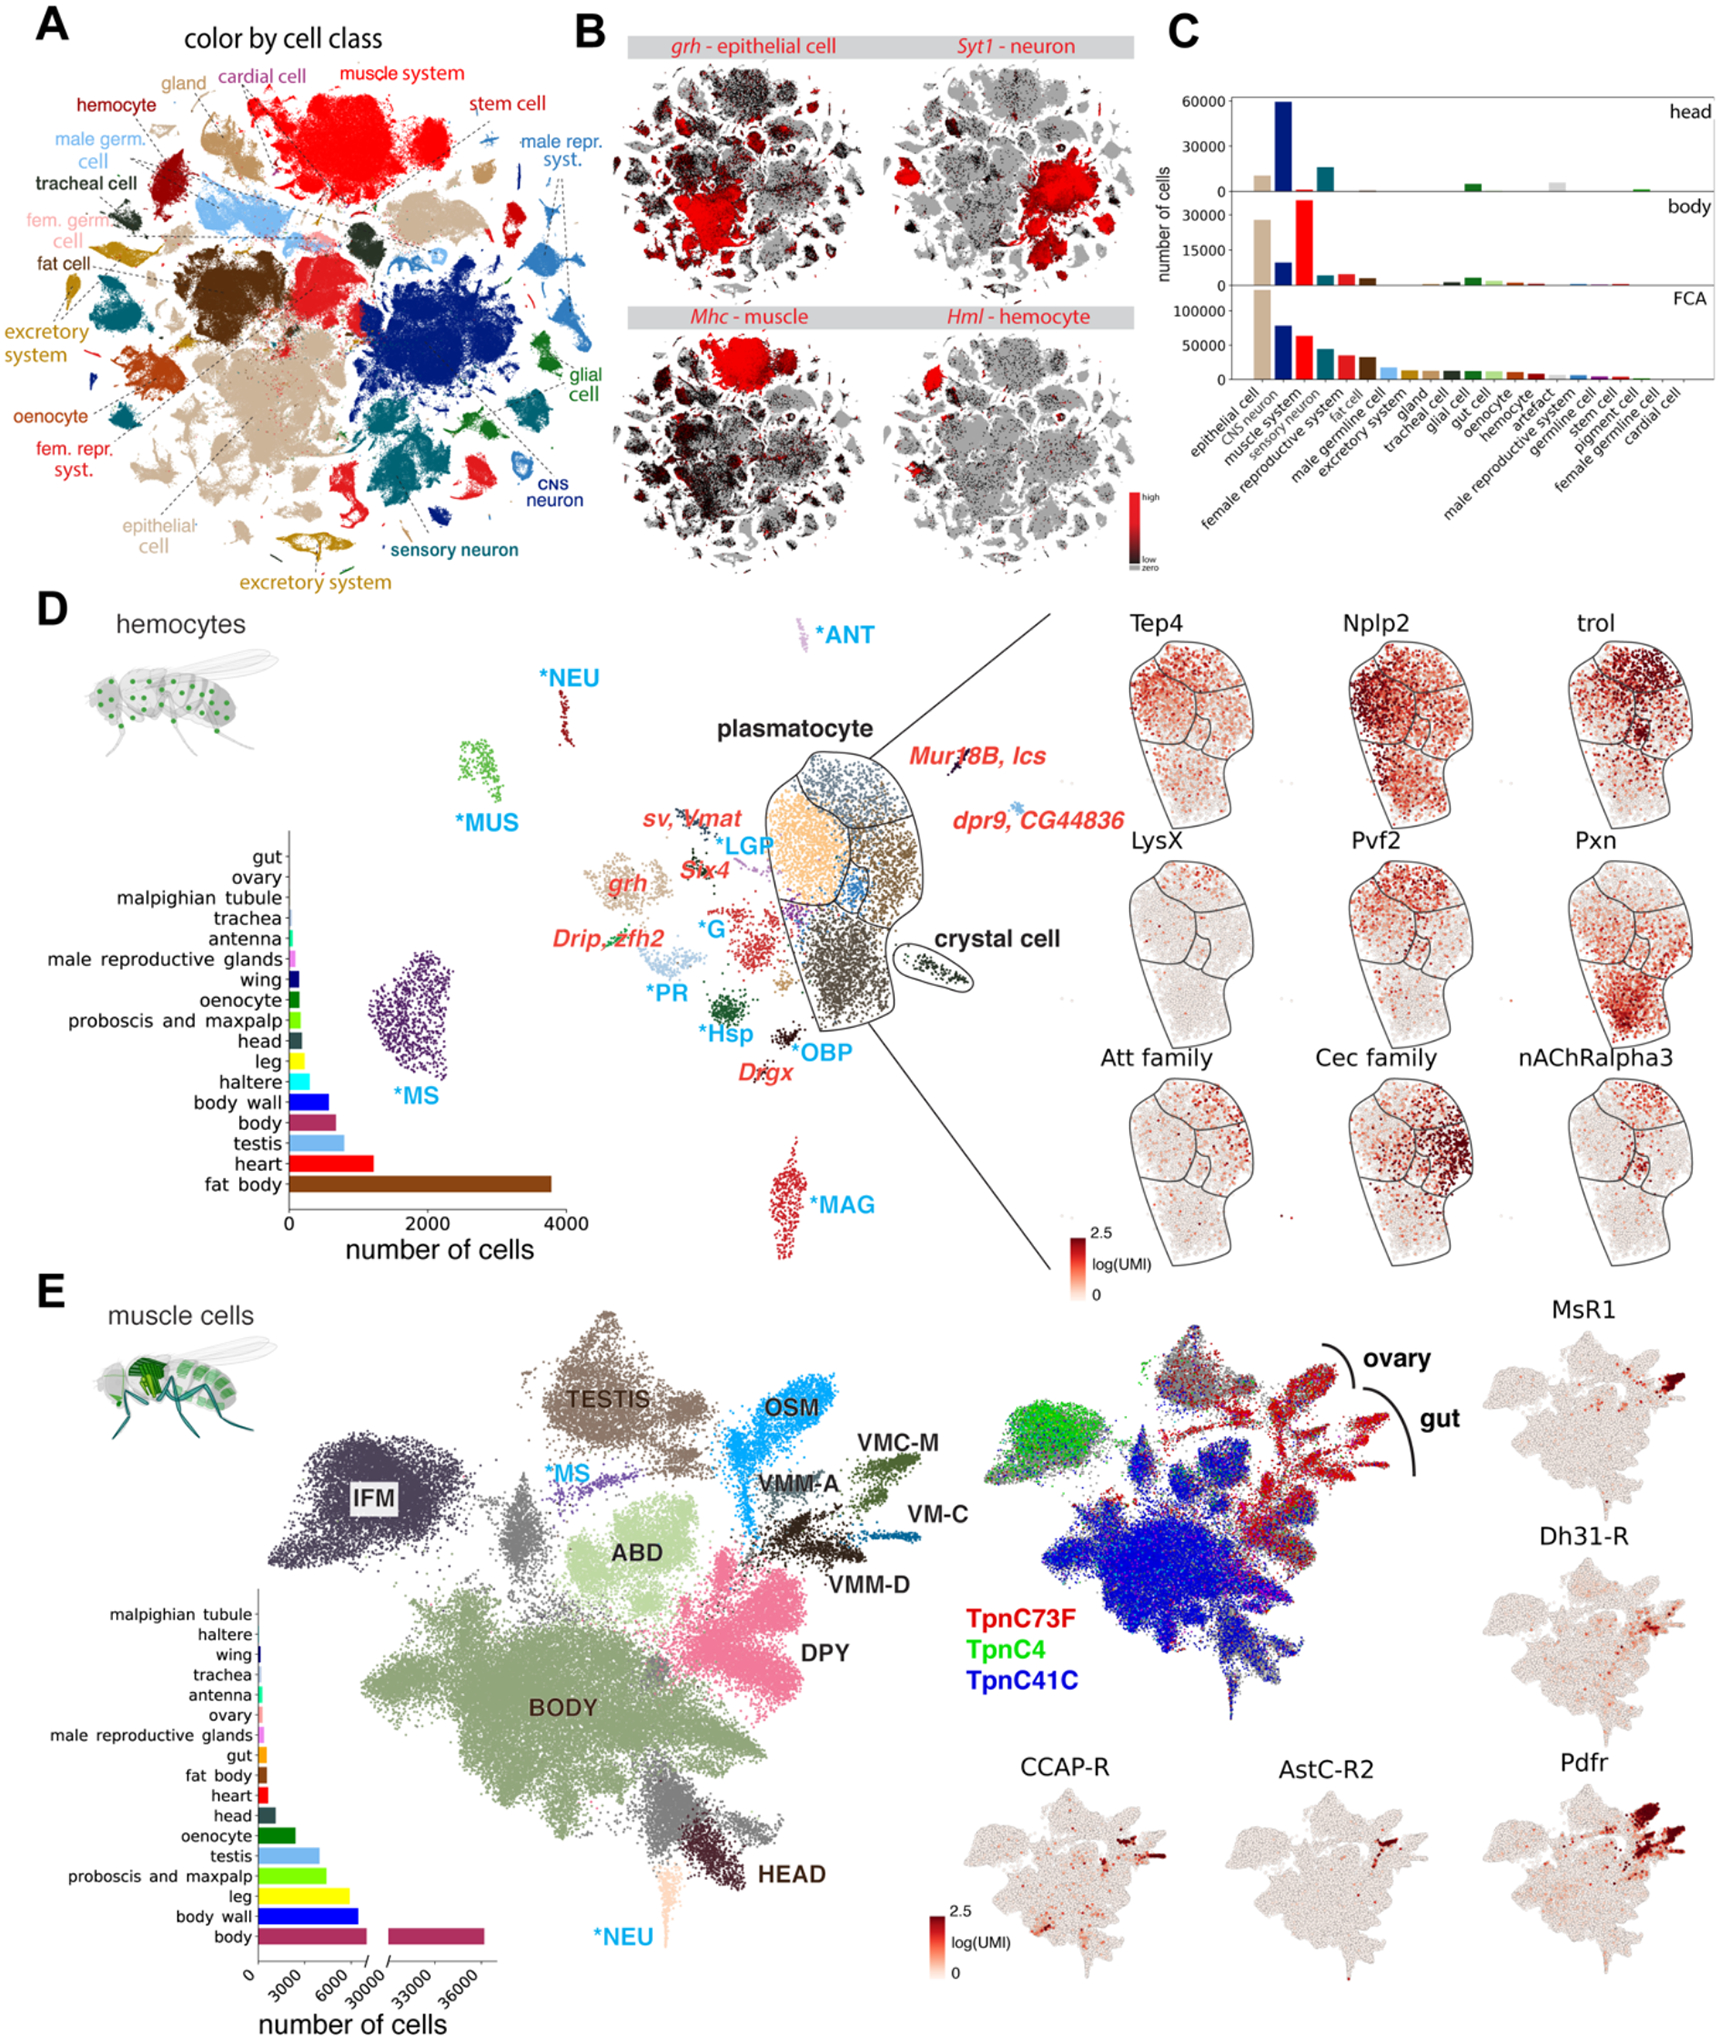
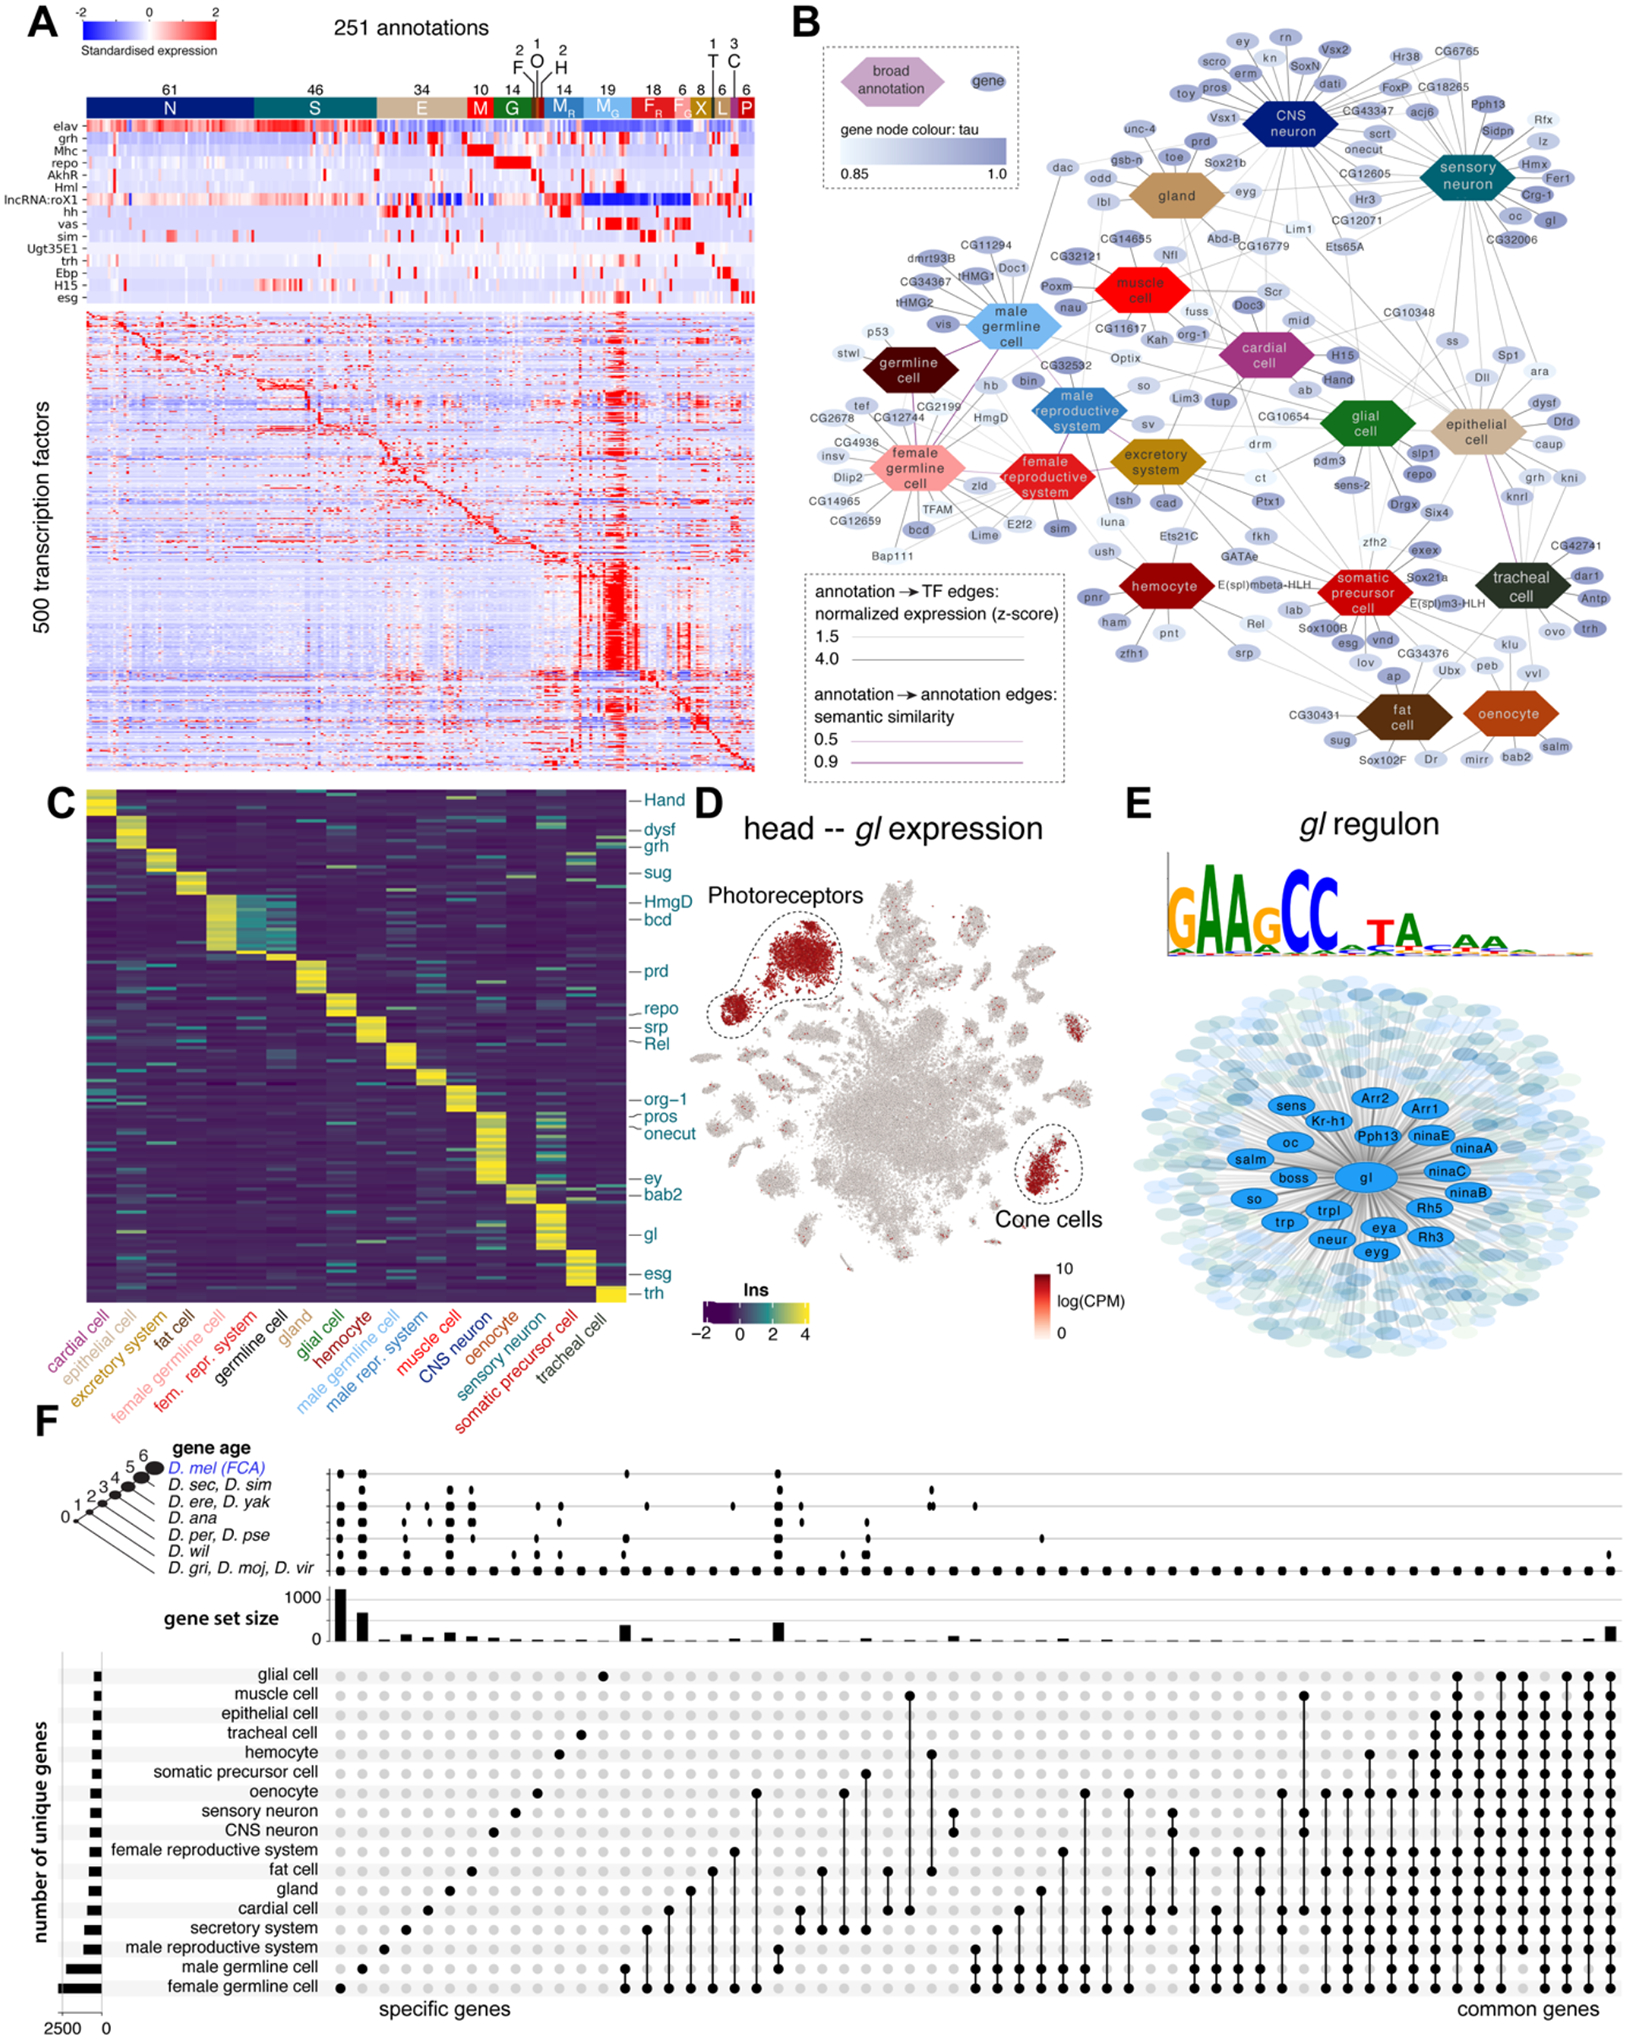
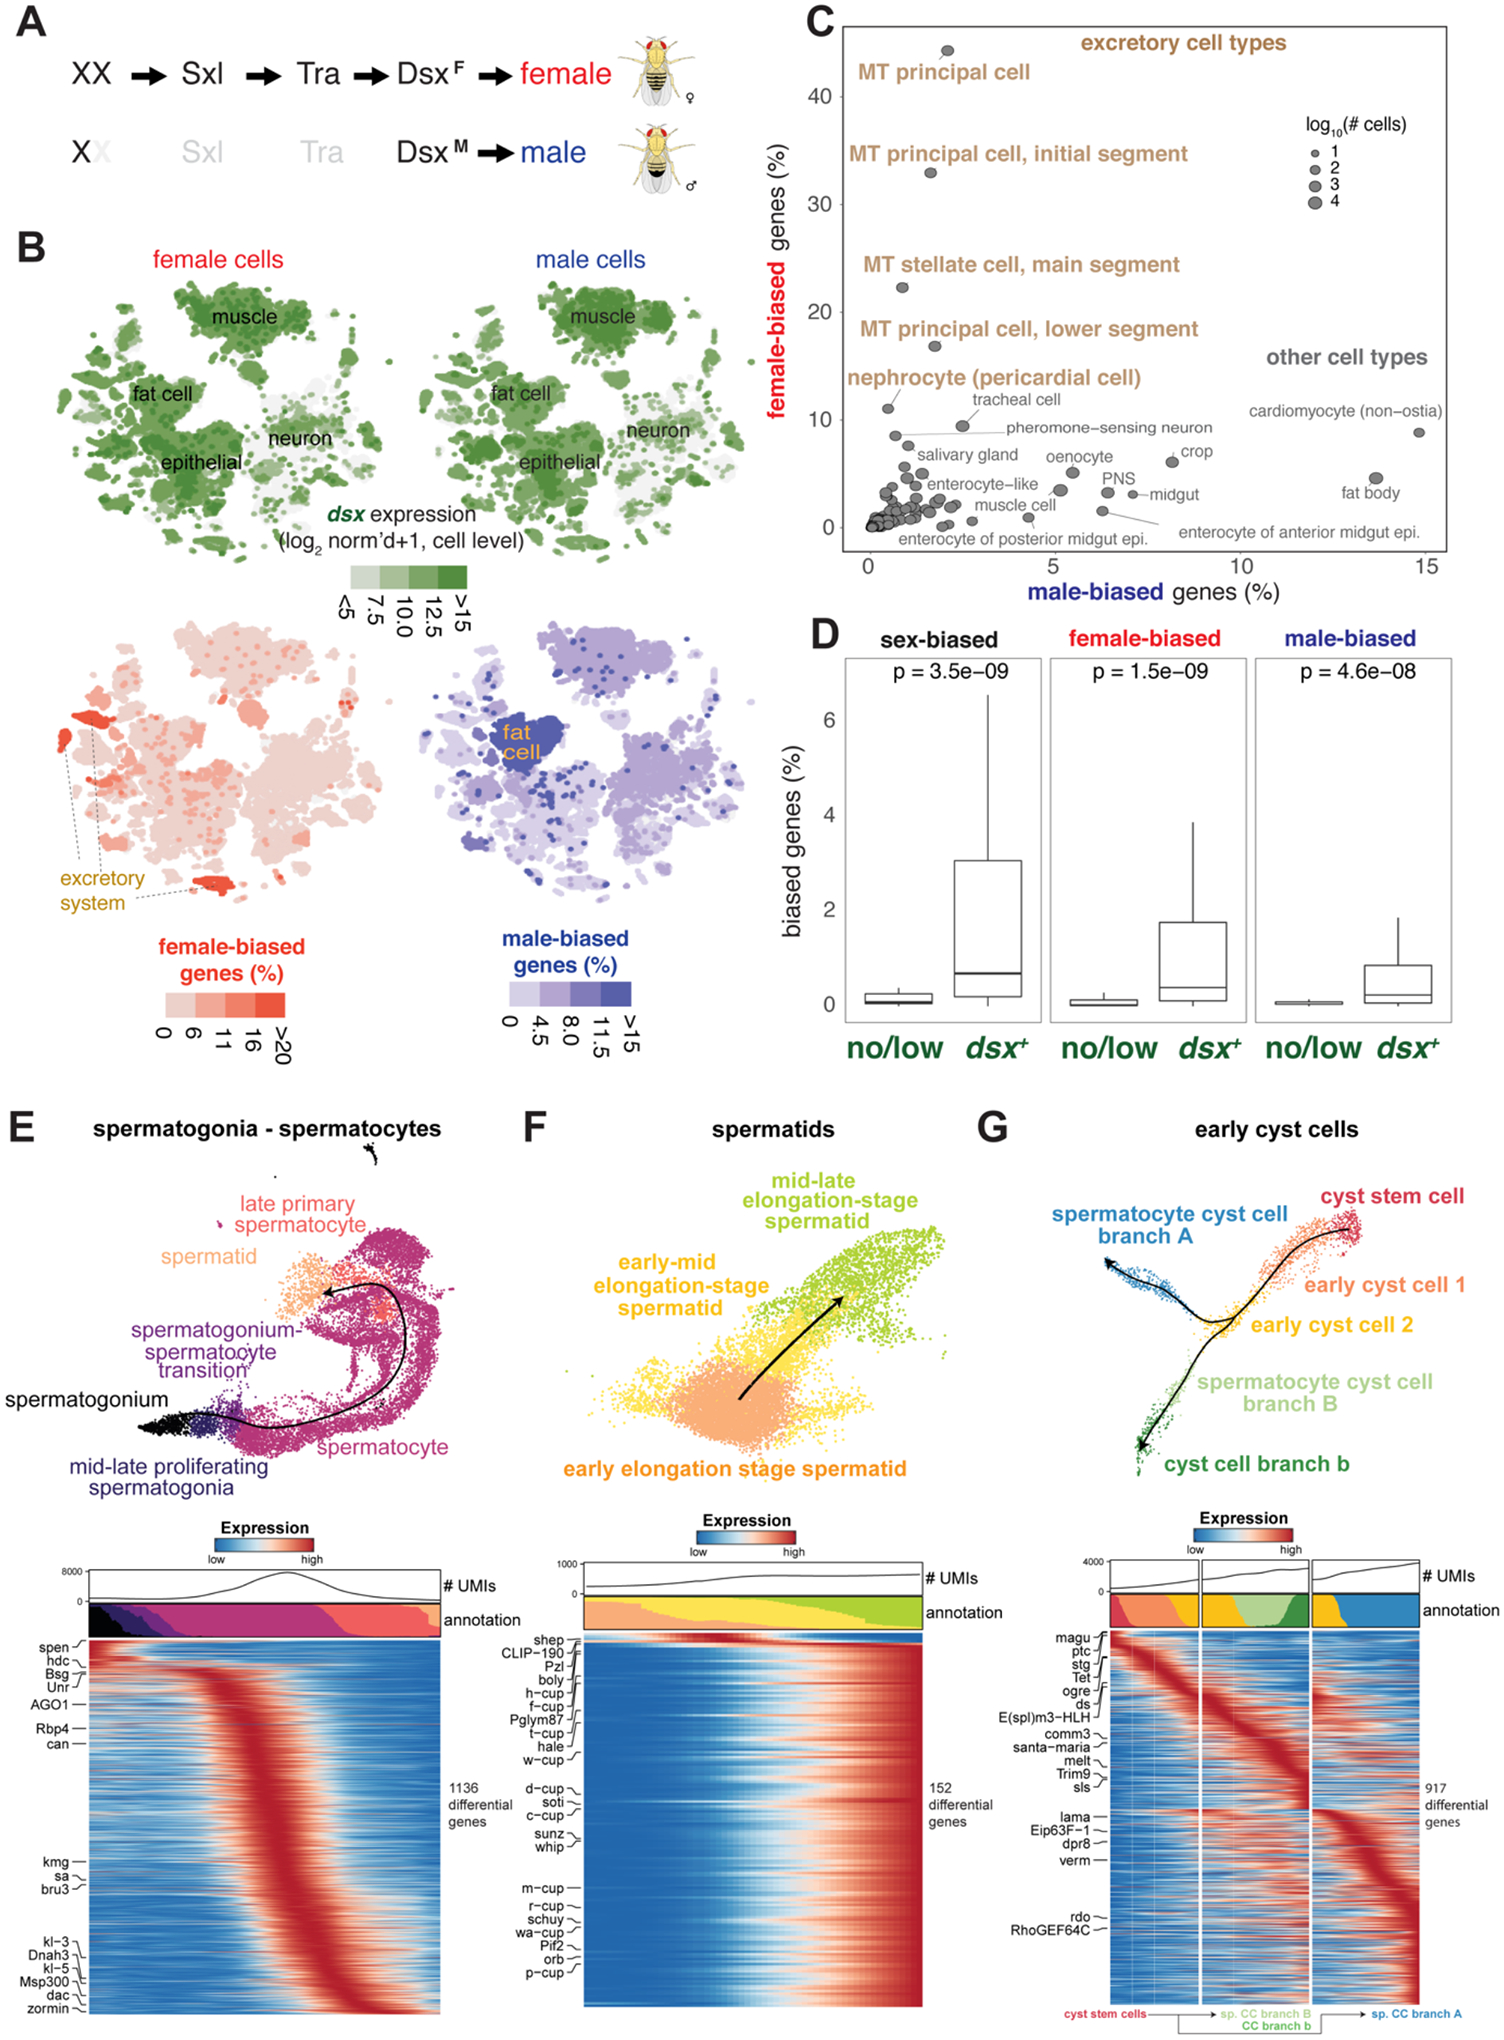
For more than 100 years, the fruit fly Drosophila melanogaster has been one of the most studied model organisms. Here, we present a single-cell atlas of the adult fly, Tabula Drosophilae, that includes 580,000 nuclei from 15 individually dissected sexed tissues as well as the entire head and body, annotated to >250 distinct cell types. We provide an in-depth analysis of cell type-related gene signatures and transcription factor markers, as well as sexual dimorphism, across the whole animal. Analysis of common cell types between tissues, such as blood and muscle cells, reveals rare cell types and tissue-specific subtypes. This atlas provides a valuable resource for the Drosophila community and serves as a reference to study genetic perturbations and disease models at single-cell resolution.


Conflict of interest statement

Competing interests: H. Jasper, N.S. Katheder and X.T. Cai are employees of Genentech, Inc. Other authors declare no competing interests.

Figures

Figure 1.
Figure 1.. Overview of the Fly Cell Atlas
(A) Experimental platform of snRNA-seq using 10x Genomics and Smart-seq2 (SS2). (B) Data analysis pipeline and data visualization using SCope (17) and ASAP (18). (C) Two versions of 10x datasets: Relaxed and Stringent. tSNE colors based on gene expression: grh (epithelia, red), Mhc (muscle, green) and Syt1 (neuron, blue). Red arrow denotes an artefactual cluster with co-expression of all three markers in the Relaxed dataset. (D) tSNE visualization of cells from the Stringent 10x dataset and Smart-seq2 (SS2) cells. 10x cells are from individual tissues. Integrated data is colored by tissue (left) and platform (right). (E) Tissue-level comparison of the number of detected genes between 10x and Smart-seq2 platforms. (F) Number of cells for each tissue by 10x and Smart-seq2. Male and female cells are indicated. Mixed cells are from pilot experiments where flies were not sexed. Different batches are separated by vertical white lines. (G) All 10x cells from the Stringent dataset clustered together; cells are colored by tissue type. Tissue names and colors are indexed in F.
Figure 2:
Figure 2:. Cell type annotation for dissected tissues
(A) Illustration of 15 individual tissues. 12 sequenced separately from males and females, 3 sex-specific. Fat body, oenocyte, and tracheal nuclei were labeled using a tissue-specific GAL4 driving UAS-nuclearGFP. (B) tSNE plot with annotations for body wall from the Stringent 10x dataset. *1, epidermal cells of the abdominal posterior compartment. *2, epidermal cells specialized in antimicrobial response. (C) UMAP plot with annotations for the testis from the Relaxed 10x dataset. (D) tSNE plots of the other 13 tissues from the Stringent 10x dataset. Detailed annotations are in fig. S6–S18. (E) Number of unique annotations for each tissue. Fractions of annotated cells over all analyzed cells from the Relaxed dataset are indicated in red.
Figure 3:
Figure 3:. Whole-head and whole-body sequencing leads to full coverage of the entire fly
(A) tSNE of the whole-head sample with 81 annotated clusters. See fig. S22 for full cell types. Many cells in the middle (gray) are unannotated, most of which are central brain neurons. (B) tSNE of the whole-body sample with 33 annotated clusters, many of which can be further divided into sub-clusters. Cells in gray are unannotated. See fig. S23 for full cell types. (C) (left) tSNE of the entire dataset colored by standardized tissue enrichment, leading to the identification of head- and body-specific clusters. (right) Bar plots showing tissue composition (head, body, or dissected tissues) for different clusters at Leiden resolution 50. (D) Examples of head- and body-specific clusters. (E) Integration of a brain scRNA-seq dataset with the head snRNA-seq for label transfer. Outlined are example clusters revealed by the head snRNA-seq dataset but not by the brain scRNA-seq datasets, including epithelial cells (EPI), photoreceptors (PRs), olfactory receptor neurons (ORNs), and muscle cells (MUS). (F) Subclustering analysis reveals types of photoreceptors, including inner and outer photoreceptors, with the inner photoreceptors further splitting into R7 and R8 types, and mushroom body Kenyon cells comprising three distinct types: α/β, α’/β’ and γ.
Figure 4:
Figure 4:. Cross-tissue analyses of common cell classes
(A) Overview of main cell classes identified throughout the fly cell atlas. Som. pre., somatic precursor cells; male repr. and fem. repr., male and female reproductive system; male germ. and fem. germ., male and female germline cells. (B) tSNE plots showing expression of four markers in four common cell classes. (C) Composition of whole head and body samples, showing a shift from neurons to epithelial and muscle cells. Composition of the entire fly cell atlas shows enrichment for rarer cell classes compared to the whole-body sample. (D) Cross-tissue analysis of hemocytes reveals different cell states of plasmatocytes. Annotations marked as blue are hemocytes containing markers of different cell types, including lymph gland posterior signaling center (LGP), muscle (MUS), antenna (ANT), neurons (NEU), photoreceptor (PR), male accessory glands (MAG), glia (G), male testis and spermatocyte (MS), olfactory-binding proteins (OBP), and heat-shock proteins (Hsp). Other abbreviations show top marker gene(s) in red. Plasmatocytes and crystal cells are indicated. On the right are genes showing compartmentalized expression patterns within the plasmatocyte cluster. (E) Cross-tissue analysis of muscle cells reveals subdivision of the visceral muscle cells based on neuropeptide receptors. Annotations marked as blue are muscle cells containing markers of different cell types, including neuron (NEU) and male testis and spermatocyte (MS). Muscle cells from three body parts are indicated: head muscle (HEAD), body muscle (BODY), and testis muscle (TESTIS). Other annotated muscle types include indirect flight muscle (IFM), ovarian sheath muscle (OSM), abdominal visceral muscle (ABD), dpy expressing muscle (DPY), visceral muscle of the midgut AstC-R2 (VMM-A), visceral muscle of the crop MsR1 (VMC-M), visceral muscle of the midgut Dh31-R (VMM-D), and visceral muscle CCAP-R (VM-C). Pdfr is expressed in all visceral muscle cells, including the ovarian sheath muscle; other four receptor genes (AstC-R2, MsR1, Dh31-R, CCAP-R) are expressed in different gut visceral muscle types.
Figure 5:
Figure 5:. Transcription factor (TF) pleiotropy versus cell-type specificity
(A) Heatmap showing the expression of key marker genes and unique TF profiles for each of the annotated cell types. TFs were selected based on tau score. Cell types were grouped based on hierarchical terms: CNS neurons (N), sensory organ cells (S), epithelial cells (E), muscle cells (M), glia (G), fat cells (F), oenocytes (O), hemocytes (H), (fe)male reproductive system and germline (MR, MG, FR, FG), excretory system (X), tracheal cell (T), gland (L), cardiac cell (C), somatic precursor cell (P). (B) A network analysis of TFs and cell classes based on similarity of ontology terms, reveals unique and shared TFs across the individual tissues. (C) Heatmap showing the expression of unique TFs per cell class. Factors from the literature are highlighted. (D) Glass is uniquely expressed in photoreceptors and cone cells in the head. (E) Overview of the Glass regulon of 444 target genes, highlighting known photoreceptor marker genes. (F) Gene expression comparison across broad cell types. Only sets with more than 10 genes are shown. The left bar graph shows the number of uniquely expressed genes for each tissue. The top bar graph shows the gene age in branches, ranging from the common ancestor to Drosophila melanogaster-specific genes (http://gentree.ioz.ac.cn). See fig. S34 for tissue-based comparison.
Figure 6.
Figure 6.. Sex-biased expression and trajectory analysis of testis cell lineages
(A) Simplified sex determination pathway. Sex chromosome karyotype (XX) activates Sex-lethal (Sxl) which regulates transformer (Tra), resulting in a female Dsx isoform (DsxF). In XY (or X0) flies, Sxl and Tra are inactive (light gray) and the male-specific DsxM is produced. (B) Top, Dsx expression and female- and male-biased expression projected onto tSNE plots of all female (left column) and male (right column) cells except reproductive tissue cells (Table S4 and S5). female- and male-biased expression measured as the percentage of genes in the cluster showing biased expression in favor of the respective sex (Table S6). These percentage values were computed for each annotated cluster and those cluster-level values were projected onto the individual cells in the corresponding clusters. For all four tSNE plots, values outside the scale in the heatmap key are represented by the closest extreme color (> and < signs in the scale). (C) Scatter plot of female- and male-bias values across non-reproductive cell clusters defined as % sex-biased genes (at least 2-fold change with FDR < 0.05 on Wilcoxon test and BH correction) in the cluster (Table S6). Data point size indicatess cell numbers per cluster (key). Selected clusters are labeled, with those from excretory cells highlighted (brown). MT, Malpighian tubule. (D) Box plots showing the relationship between dsx gene expression and sex-biased expression (Table S5). Clusters (B) were partitioned into the set of clusters with Dsx expression (dsx+) or not (no/low) using dsx expression in germ cells as an expression cut-off. Each box shows hinges at first and third quartiles and median in the middle. The upper whisker extends from the upper hinge to the largest value no further than 1.5 * IQR from the hinge (where IQR is the inter-quartile range, or distance between the first and third quartiles). The lower whisker extends from the hinge to the smallest value at most 1.5 * IQR of the hinge. Outliers are not shown. p-values are based on Wilcoxon test. (E–G) Trajectory of testis subsets. We used slingshot to infer a possibly branching trajectory for spermatogonia-spermatocytes (E), spermatids (F), and early cyst cells (G). Shown are the trajectories on a UMAP (top) and the expression patterns of the strongest differentially expressed genes, together with the smoothed proportions of annotated cells and average number of unique molecular identifiers (UMIs) along the trajectory (bottom).

References

    1. Morgan TH, SEX LIMITED INHERITANCE IN DROSOPHILA. Science 32, 120–122 (1910). - PubMed
    1. Adams MD et al., The genome sequence of Drosophila melanogaster. Science 287, 2185–2195 (2000). - PubMed
    1. Larkin A et al., FlyBase Consortium, FlyBase: updates to the Drosophila melanogaster knowledge base. Nucleic Acids Res 49, D899–D907 (2021). - PMC - PubMed
    1. Lyne R et al., FlyMine: an integrated database for Drosophila and Anopheles genomics. Genome Biol 8, R129 (2007). - PMC - PubMed
    1. Jenett A et al., A GAL4-driver line resource for Drosophila neurobiology. Cell Rep 2, 991–1001 (2012). - PMC - PubMed

Publication types