

doi: 10.1073/pnas.2117320119.
Epub 2022 Mar 3.
Black Lives Matter protests shift public discourse
Affiliations
- PMID: 35239433
- PMCID: PMC8915973
- DOI: 10.1073/pnas.2117320119
Item in Clipboard
Black Lives Matter protests shift public discourse
Proc Natl Acad Sci U S A.
.
Abstract
SignificanceThis study uses large-scale news media and social media data to show that nationwide Black Lives Matter (BLM) protests occur concurrently with sharp increases in public attention to components of the BLM agenda. We also show that attention to BLM and related concepts is not limited to these brief periods of protest but is sustained after protest has ceased. This suggests that protest events incited a change in public awareness of BLM's vision of social change and the dissemination of antiracist ideas into popular discourse.
Keywords: Black Lives Matter; cultural change; social movements.
Conflict of interest statement
The authors declare no competing interest.
Figures
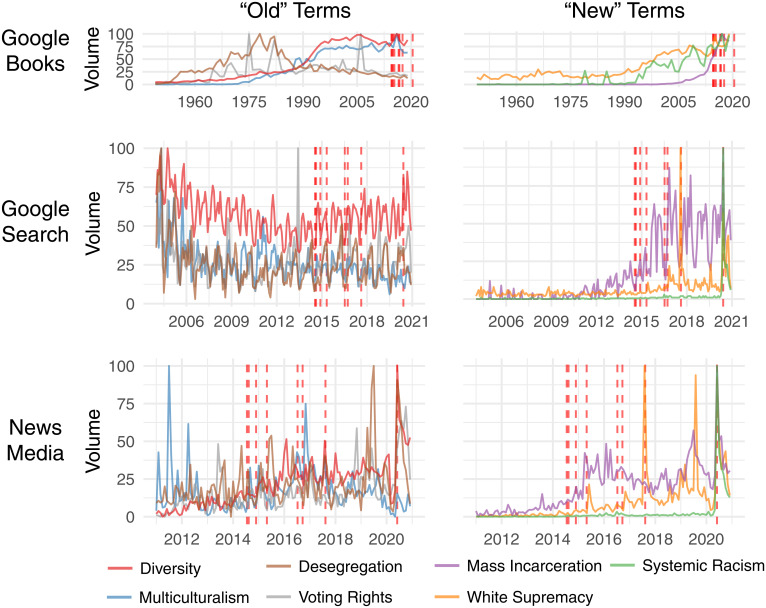
Trends in the use of selected antiracist terms. Normalized monthly volume for pre-BLM antiracist terms (Left) and post-BLM antiracist terms (Right). (Top) Google N-grams instances of each term (annual). (Middle) Google searches for each term. (Bottom) National news articles mentioning each term. Red dashed lines correspond to major BLM protest events (29).
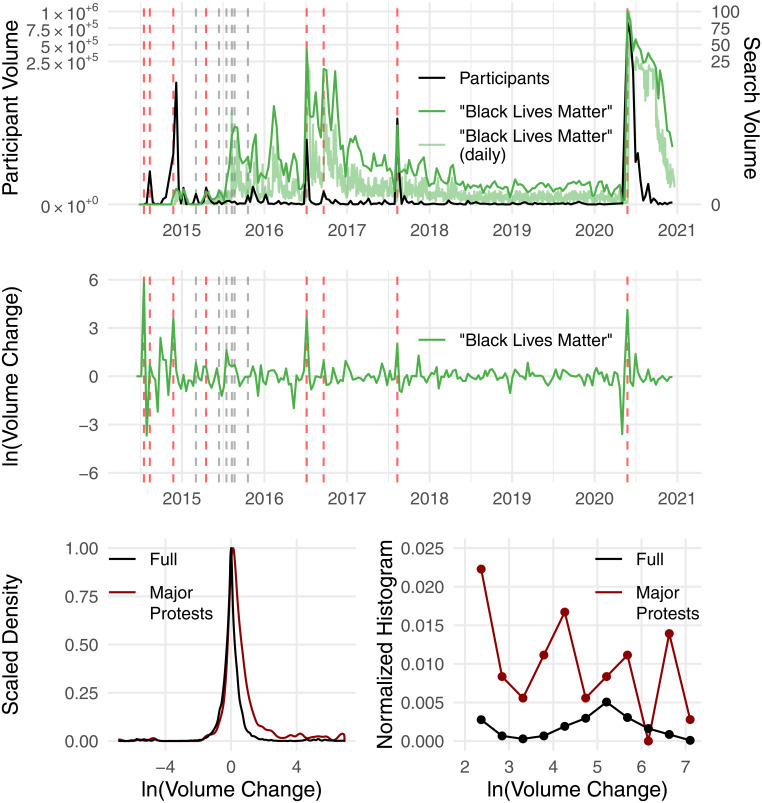
Protests and Google searches are bursty and correlated. (Top) Number of participants at BLM-related protests and volume of Google searches for “Black Lives Matter” (scaled 0 to 100, as Google Trends does not provide absolute search volumes.) (Middle) The change in volume of Google searches, V. Unless otherwise stated, time has been binned such that each point t spans a period of 8 to 12 d designed to fully encapsulate, rather than straddle, protest periods, which occur irregularly. (Bottom Left) Scaled distribution of relative volume of Google searches. Relative volume for all 41 BLM-related search terms during all periods is shown in black, whereas the dark red line shows only protest periods. (Bottom Right) The right tail of a histogram of the data in Bottom Left. In Top and Middle, red and gray dashed lines correspond to major and minor protest events, respectively (minor protest events for only 2015 are pictured). In Top, the upper 3/4 of the vertical axis has been contracted to make visible the variation in the lower fourth.
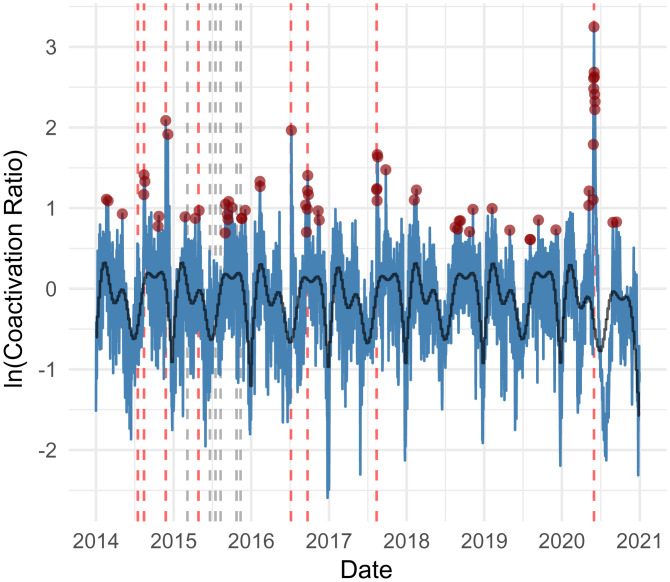
Coactivation of Google search terms. Blue lines show the log-ratio of daily coactivation to mean coactivation (60-d window) for all 41 terms. Black line shows GAM prediction from calendar week and absolute time. Red points show significant spikes in coactivation (P < 0.001). Major and minor protest events are indicated by red and gray dashed lines, respectively.
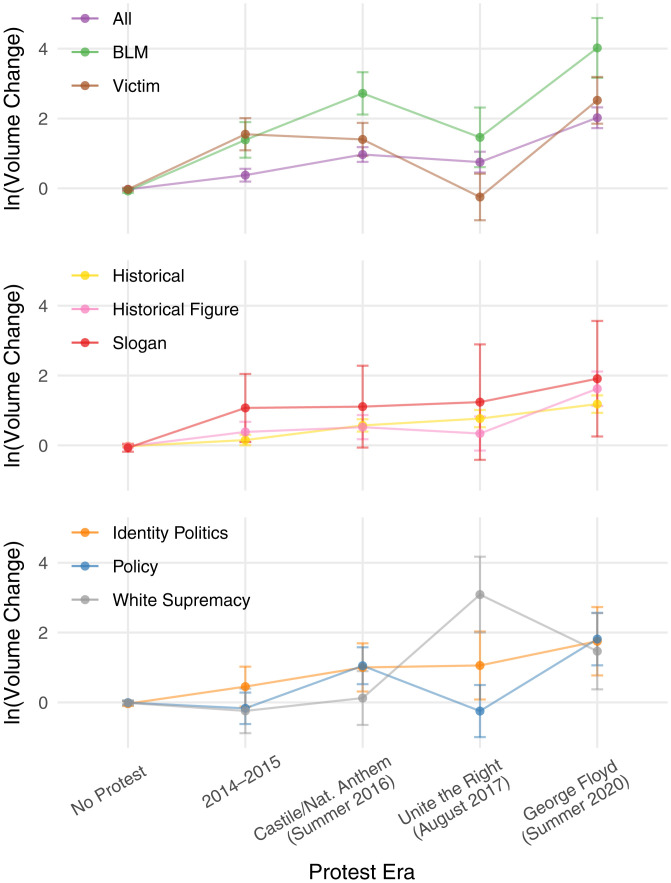
Expected change in search volume during protest. GAMs of expected change in search volume during a major protest during four protest “eras.” Search terms are grouped into eight categories, with an additional group, “All,” representing every search term. The first point in every plot represents model intercept: the expected change in search volume when a major protest is not occurring at any time between July 2014 and December 2020. All other points are the bootstrapped coefficients for expected change in search volume of protests of a particular era. Whiskers show 95% CIs.
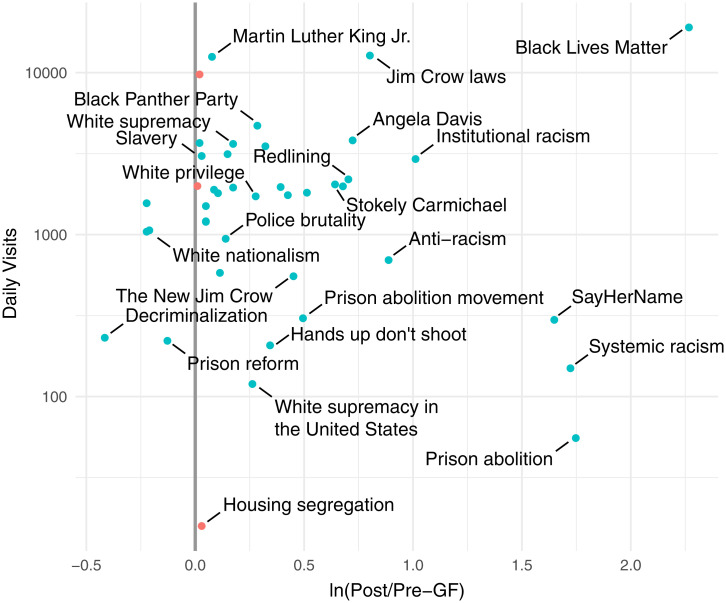
Shift in frequency of Wikipedia page visits after the George Floyd protests. Horizontal axis shows the ratio of expected daily visits during August to December of 2020 compared to the same calendar period of 2019. Vertical axis shows the expected number of page visits in August to December of 2020 (log scale). Blue dots are significant at P < 0.001 as estimated by t-test.
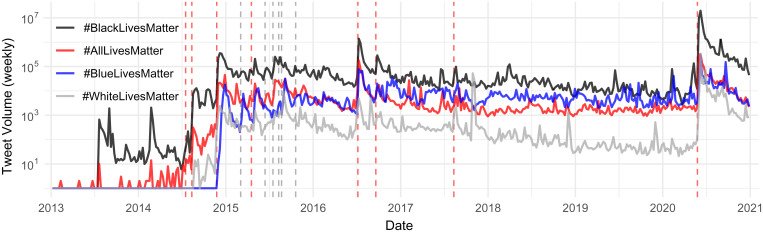
Weekly hashtag volume for #BlackLivesMatter and three opposing terms. Major and minor protest events are indicated by red and gray dashed lines, respectively.
References
-
- McAdam D., Su Y., The war at home: Antiwar protests and congressional voting, 1965 to 1973. Am. Sociol. Rev. 67, 696–721 (2002).
-
- Gillion D. Q., The Political Power of Protest: Minority Activism and Shifts in Public Policy (Cambridge University Press, 2013).
-
- Gillion D. Q., Governing with Words: The Political Dialogue on Race, Public Policy, and Inequality in America (Cambridge University Press, 2016).
-
- Noel H., Political Ideologies and Political Parties in America (Cambridge University Press, 2014).
-
- Lee T., Mobilizing Public Opinion: Black Insurgency and Racial Attitudes in the Civil Rights Era (University of Chicago Press, 2002).
MeSH terms
LinkOut - more resources
Full Text Sources
