. 2022 Mar 8;119(10):e2113329119.
doi: 10.1073/pnas.2113329119. Epub 2022 Mar 3.

Developmentally distinct CD4+ Treg lineages shape the CD8+ T cell response to acute Listeria infection

Affiliations

Developmentally distinct CD4+ Treg lineages shape the CD8+ T cell response to acute Listeria infection

Joseph S Dolina et al. Proc Natl Acad Sci U S A. .

Abstract

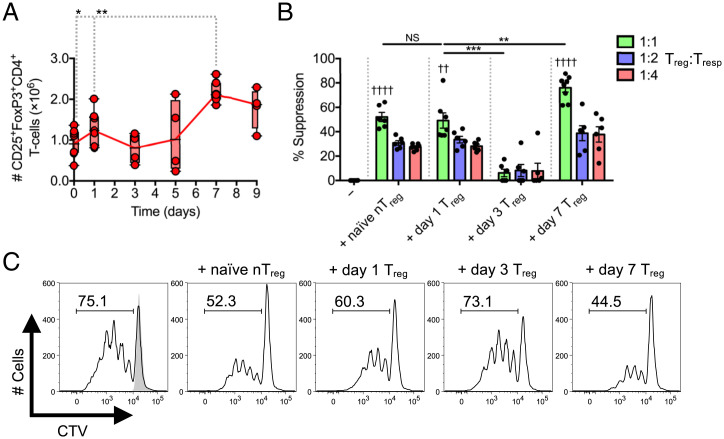
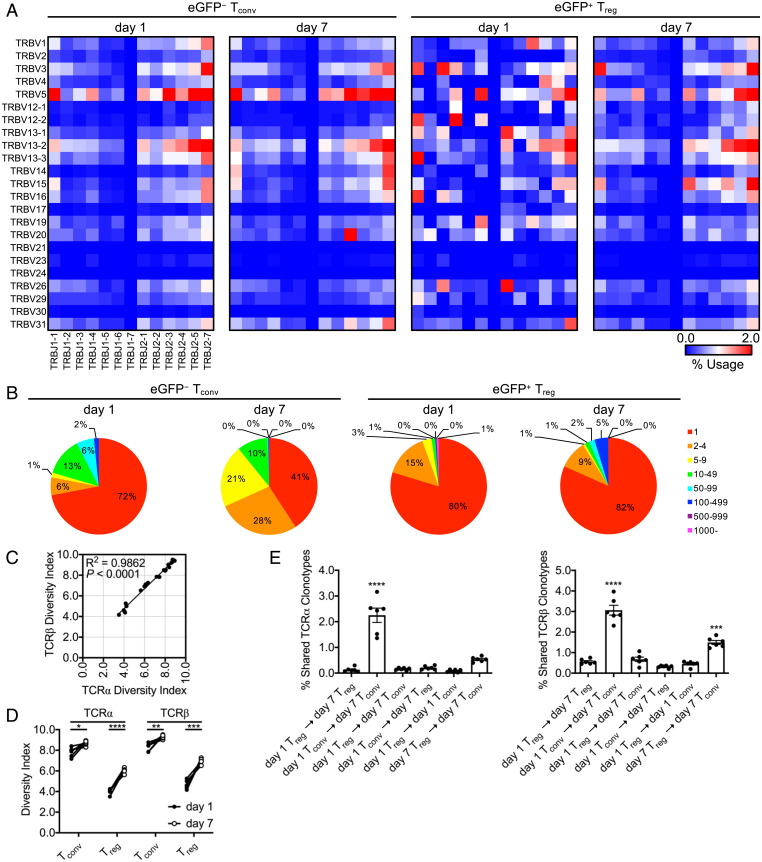
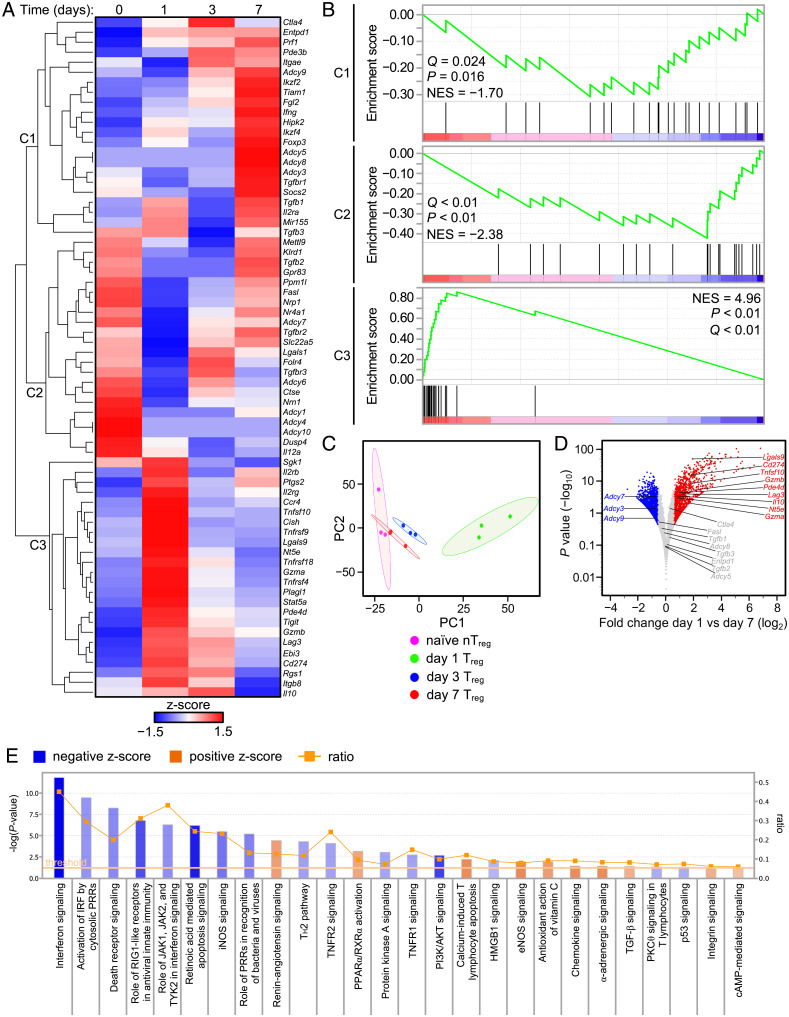
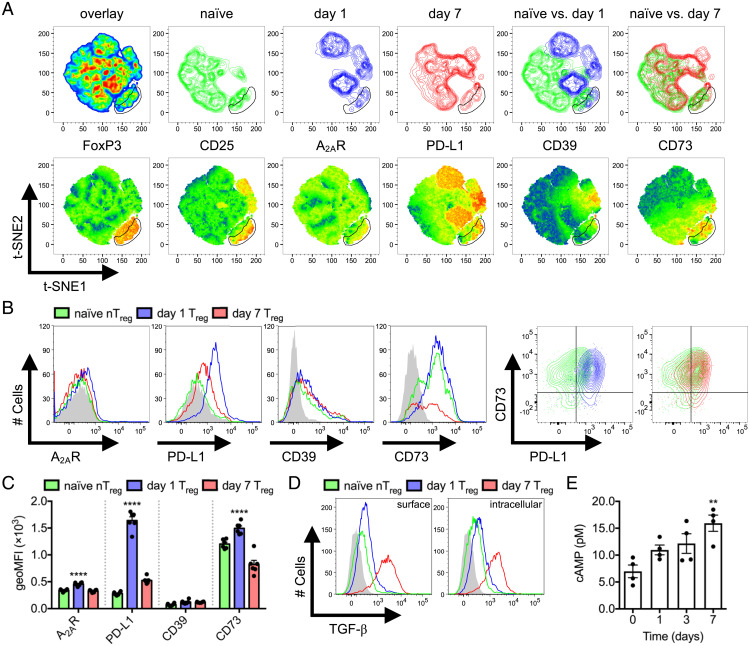
SignificanceThe CD4+ Treg response following acute Listeria infection is heterogeneous and deploys two distinct modes of suppression coinciding with initial pathogen exposure and resolution of infection. This bimodal suppression of CD8+ T cells during priming and contraction is mediated by separate Treg lineages. These findings make a significant contribution to our understanding of the functional plasticity inherent within Tregs, which allows these cells to serve as a sensitive and dynamic cellular rheostat for the immune system to prevent autoimmune pathology in the face of inflammation attendant to acute infection, enable expansion of the pathogen-specific response needed to control the infection, and reestablish immune homeostasis after the threat has been contained.

Keywords: CD73; FoxP3+ T regulatory cell; Listeria monocytogenes; cyclic AMP; gap junction.


Conflict of interest statement

The authors declare no competing interest.

Figures

Fig. 1.
Fig. 1.
Treg responses during Listeria infection display a biphasic kinetic pattern. C57BL/6 mice infected with L. monocytogenes ΔactA-Ova. (A) Number of CD25+FoxP3+CD4+ Tregs in spleens 0 to 9 d postinfection (n = 4 to 8 per group). (B and C) In vitro CD45.1+CD8+ Tresps proliferation/percent suppression at day 3 after coculture with CD45.2+CD4+FoxP3-eGFP+ Tregs isolated from naïve Foxp3eGFP mice and those that underwent 1, 3, or 7 d of infection. Indicated are titrated Treg:Tresp ratios after anti-CD3/CD28 stimulation (n = 4 per group). Reported in histograms are percentage and data from 1:1 Treg:Tresp cocultures. Mean ± SEM; (A and B) *P < 0.05, **P < 0.01, and ***P < 0.001 (Student’s t test); (B) ††P < 0.01 and ††††P < 0.0001 (one-way ANOVA relative to −Treg). CTV, CellTrace Violet; NS, not significant.
Fig. 2.
Fig. 2.
Splenic Tregs do not display clonal expansion during Listeria infection. Foxp3eGFP mice infected with L. monocytogenes ΔactA-Ova. Hemisplenectomy was performed at day 1 postinfection, and viable NK1.1CD4+TCR-β+FoxP3-eGFP (Tconv) and FoxP3-eGFP+ (Treg) cell populations were cell sorted from the dorsocranial lobe of the spleen. Corresponding cell populations were isolated at day 7 from the remaining ventral-caudal half of the spleen. Total RNA was isolated from all cells and subjected to TCR-Seq. (A) TCRβ Trb V (TRBV) and Trb J (TRBJ) gene segment family average usage among animals. (B) Representative number of Trb CDR3 clone reads. (C and D) Shannon–Weaver TCR diversity indices reported. (E) Intraanimal Venn analysis displaying shared Tra and Trb CDR3 clonotypes (n = 6 per group, 3 male and 3 female). Mean ± SEM. (C) R2/P (linear regression analysis); (D) *P < 0.05, **P < 0.01, ***P < 0.001, and ****P < 0.0001 (Student’s t test); and (E) ***P < 0.001 and ****P < 0.0001 (one-way ANOVA).
Fig. 3.
Fig. 3.
Kinetic analysis of Treg RNA-Seq. Foxp3eGFP mice infected with L. monocytogenes ΔactA-Ova with total RNA isolated from NK1.1CD4+TCR-β+FoxP3-eGFP+ Tregs at days 1, 3, and 7 postinfection or naïve animals. (A) RNA-Seq with hierarchical clustered, row-scaled log-transformed average reads per kilobase of transcript, per million mapped reads (RPKM) values. (B) GSEA against day 1 versus day 7 RNA-Seq comparisons performed with gene sets derived from clusters 1 to 3 (C1-3) in A. (C) PCA of Treg RNA-Seq. (D) Volcano plot of selected genes and log2 normalized expression with a Δ1.5 fold change cutoff against log10 normalized P values from day 1 versus day 7 comparisons. (E) IPA canonical pathways associated with day 1 versus day 7 comparisons (n = 3 per group). Reported are lymphocyte-related pathways and ratio of pathway coverage (P < 0.05 threshold for gene network overlap).
Fig. 4.
Fig. 4.
Temporal variation of Treg effector mechanisms. Naïve compared to day 1 and 7 L. monocytogenes ΔactA-Ova–infected C57BL/6 mice. (A) t-SNE analysis of CD4+ T cells with FoxP3, CD25, A2AR, PD-L1, CD39, and CD73 dimensions. Density plots (Upper) and heatmap statistic displays of each input parameter (Lower) are displayed (n = 6 per group). (B and C) Expression of A2AR, PD-L1, CD39, and CD73 on Treg surface defined in A (n = 6 per group). (D) Expression of surface displayed and intracellular TGF-β by Tregs after PMA/ionomycin restimulation (n = 4 per group). (E) Intracellular FoxP3-eGFP+ Treg cAMP concentration after sorting from naïve Foxp3eGFP mice and those at days 1, 3, and 7 following L. monocytogenes ΔactA-Ova infection (n = 4 per group). Filled histograms represent fluorescence minus one (FMO). Mean ± SEM. (C and E) **P < 0.01 and ****P < 0.0001 (one-way ANOVA).
Fig. 5.
Fig. 5.
Tregs display increased CD73 enzymatic activity at day 1 postinfection. (A) A total of 10 pmol mixed 1,N6-etheno-derivatized nucleotide standards (Ado, 5′-AMP, 5′-ADP, and 5′-ATP) resolved by HPLC. (BD) FoxP3-eGFP+ Tregs or FoxP3-eGFP Tconvs sorted from naïve (day 0) and L. monocytogenes ΔactA-Ova–infected (days 1 and 7) Foxp3eGFP mice were placed in the upper chamber of a 96-well transwell plate. The bottom chamber was pulsed with either 10 μM 5′-AMP or 5′-ATP. (B and C) Concentration of Ado in the bottom chamber determined in cultures exposed to a 15-min 5′-AMP pulse for assessment of CD73 enzymatic activity, and (D) 5′-AMP similarly measured with a 15-min 5′-ATP pulse for measurement of CD39-mediated hydrolysis (n = 4 per group). Expanded retention times (gray box) for (C) Ado and (D) 5′-AMP are indicated. Mean ± SEM. (B) *P < 0.05 and **P < 0.01 (Student’s t test); ††P < 0.01 (one-way ANOVA).
Fig. 6.
Fig. 6.
Day 1 versus day 7 bimodal Treg cAMP-mediated suppression. (A) CD45.2+CD4+FoxP3-eGFP+ Tregs sorted from naïve and day 1 or day 7 L. monocytogenes ΔactA-Ova–infected Foxp3eGFP mice were placed in the upper chamber of a 96-well transwell plate, with the bottom chamber containing naïve CTV-labeled CD45.1+CD8+ Tresps. At day 3 after anti-CD3/CD28 stimulation, CD45.1+CD8+ Tresp percent suppression in the presence or absence of 1 μM 5′-AMP was assessed (n = 4 per group). In vitro CD45.2+CD8+ Tresp proliferation of (B) C57BL/6 or (C) BALB/c compared to Adora2a−/− origin represented as percent suppression at day 3 after a cell-contact permissive, 1:1 coculture of naïve CTV-labeled CD45.2+CD8+ Tresps with CD45.1+CD4+FoxP3-eGFP+ Tregs isolated from day 1 infected CD45.1+ Foxp3eGFP mice in the presence or absence of 1 μM 5′-AMP (n = 4 per group). (D) The percent and absolute number of splenic Ova-specific CD8+ T cells at day 7 postinfection of C57BL/6 and Foxp3DTR-eGFP mice infected with L. monocytogenes ΔactA-Ova. DT injection dictated Treg depletion with control and early (days 0 to 2) versus late (days 5 to 6) CD73 blockade compared (n = 4 per group). (E) In vitro CD45.1+CD8+ Tresp percent suppression and (F) IL-2 detected in supernatant at day 3 after 1:1 coculture with CD45.2+CD4+FoxP3-eGFP+ Tregs isolated from naïve and day 1 or day 7 infected CD45.1+ Foxp3eGFP mice in the presence or absence of Gap27204–214 or scrambled control peptide (n = 6 to 10 per group). (G and H) Suppressor assay as in E and F with KT5720 selective inhibition of PKA with analysis of intracellular pCREB in CD45.1+CD8+ Tresps, and percent suppression exerted by day 7 Tregs (n = 7 per group). Numbers in histograms represent percentage. Mean ± SEM. (AF and H) *P < 0.05, **P < 0.01, and ***P < 0.001 (Student’s t test); (D) P < 0.05 (one-way ANOVA relative to negative control).
Fig. 7.
Fig. 7.
The CD73 pathway suppresses Ova-specific CD8+ T cell responses early after Listeria infection in vivo. (A) C57BL/6 mice infected with L. monocytogenes ΔactA-Ova. Absolute number of Ova-specific CD8+ T cells at 7 d postinfection in spleens with control and early (days 0 to 2) versus late (days 5 to 6) TGF-β and CD73 single and dual blockade compared (n = 4 per group). (B) Percent and absolute number of splenic Ova-specific CD8+ T cells at day 7 after L. monocytogenes ΔactA-Ova infection of C57BL/6 versus Foxp3DTR-eGFP mice. DT injection dictated specific Treg depletion with control and late (days 5 to 6) TGF-β and CD73 single and dual blockade compared (n = 4 per group). (C) Proposed model for biphasic Treg response to L. monocytogenes infection. Numbers in scatterplots represent percentage. Mean ± SEM. (A) *P < 0.05 and **P < 0.01 (Student’s t test); (A and B) P < 0.05, ††P < 0.01, and ††††P < 0.0001 (one-way ANOVA relative to negative control).

Comment in

  • Tregs tango with killer cells in acute infection.
    Sun X, Chi H. Sun X, et al. Proc Natl Acad Sci U S A. 2022 Mar 29;119(13):e2202400119. doi: 10.1073/pnas.2202400119. Epub 2022 Mar 21. Proc Natl Acad Sci U S A. 2022. PMID: 35312353 Free PMC article. No abstract available.

References

    1. Sakaguchi S., Wing K., Onishi Y., Prieto-Martin P., Yamaguchi T., Regulatory T cells: How do they suppress immune responses? Int. Immunol. 21, 1105–1111 (2009). - PubMed
    1. Sakaguchi S., Vignali D. A. A., Rudensky A. Y., Niec R. E., Waldmann H., The plasticity and stability of regulatory T cells. Nat. Rev. Immunol. 13, 461–467 (2013). - PubMed
    1. Wing J. B., Sakaguchi S., TCR diversity and Treg cells, sometimes more is more. Eur. J. Immunol. 41, 3097–3100 (2011). - PubMed
    1. Sakaguchi S., Sakaguchi N., Asano M., Itoh M., Toda M., Immunologic self-tolerance maintained by activated T cells expressing IL-2 receptor alpha-chains (CD25). Breakdown of a single mechanism of self-tolerance causes various autoimmune diseases. J. Immunol. 155, 1151–1164 (1995). - PubMed
    1. Benoist C., Mathis D., Treg cells, life history, and diversity. Cold Spring Harb. Perspect. Biol. 4, a007021–a007021 (2012). - PMC - PubMed

Substances