. 2022 Nov;18(11):2576-2592.
doi: 10.1080/15548627.2022.2039992. Epub 2022 Mar 3.

SARS-CoV-2 ORF3a induces RETREG1/FAM134B-dependent reticulophagy and triggers sequential ER stress and inflammatory responses during SARS-CoV-2 infection

Affiliations

SARS-CoV-2 ORF3a induces RETREG1/FAM134B-dependent reticulophagy and triggers sequential ER stress and inflammatory responses during SARS-CoV-2 infection

Xiaolin Zhang et al. Autophagy. 2022 Nov.

Abstract

SARS-CoV-2 infections have resulted in a very large number of severe cases of COVID-19 and deaths worldwide. However, knowledge of SARS-CoV-2 infection, pathogenesis and therapy remains limited, emphasizing the urgent need for fundamental studies and drug development. Studies have shown that induction of macroautophagy/autophagy and hijacking of the autophagic machinery are essential for the infection and replication of SARS-CoV-2; however, the mechanism of this manipulation and the function of autophagy during SARS-CoV-2 infection remain unclear. In the present study, we identified ORF3a as an inducer of autophagy (in particular reticulophagy) and revealed that ORF3a localizes to the ER and induces RETREG1/FAM134B-related reticulophagy through the HMGB1-BECN1 (beclin 1) pathway. As a consequence, ORF3a induces ER stress and inflammatory responses through reticulophagy and then sensitizes cells to the acquisition of an ER stress-related early apoptotic phenotype and facilitates SARS-CoV-2 infection, suggesting that SARS-CoV-2 ORF3a hijacks reticulophagy and then disrupts ER homeostasis to induce ER stress and inflammatory responses during SARS-CoV-2 infection. These findings reveal the sequential induction of reticulophagy, ER stress and acute inflammatory responses during SARS-CoV-2 infection and imply the therapeutic potential of reticulophagy and ER stress-related drugs for COVID-19.Abbreviations: CQ: chloroquine; DEGs: differentially expressed genes; ER: endoplasmic reticulum; GSEA: gene set enrichment analysis; HMGB1: high mobility group box 1; HMOX1: heme oxygenase 1; MERS-CoV: Middle East respiratory syndrome coronavirus; RETREG1/FAM134B: reticulophagy regulator 1; RTN4: reticulon 4; SARS-CoV-2: severe acute respiratory syndrome coronavirus 2; TN: tunicamycin.

Keywords: ER stress; ORF3a; SARS-CoV-2; inflammatory response; reticulophagy.


Conflict of interest statement

No potential conflict of interest was reported by the author(s).

Figures

Figure 1.
Figure 1.
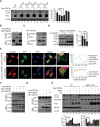
ORF3a induces autophagy. (A-B) HEK293T cells were transfected with empty vector or Flag-ORF3a-expressing plasmid for 48 h and then left untreated or treated with HBSS for 2 h. The cells were harvested, and the whole cell extracts were analyzed by Western blots as indicated to detect LC3-I-to-LC3-II conversion and SQSTM1 level (A) or AKT and ULK1 phosphorylation (B). (C) HeLa cells were transfected with empty vector or Flag-ORF3a- and GFP-LC3-expressing plasmid, left untreated or followed by HBSS treatment for 2 h, then fixed and subjected to confocal microscopy analysis. Scale bar: 10 μm. The LC3 puncta per cell were calculated from 20 cells/each from three independent experiments. *, p < 0.05; **, p < 0.01; ***, p < 0.001; ****, p < 0.0001, by Sidak’s multiple comparisons test. (D) HeLa cells were transfected with ptfLC3 and empty vector or Flag-ORF3a-expressing plasmid. Twenty-four hours post transfection, cells were fixed and subjected to confocal microscopy analysis. Scale bar: 5 μm. The red puncta represent autolysosomes and the yellow puncta indicate autophagosomes. The LC3 puncta per cell were calculated from 20 cells/each from three independent experiments. *, p < 0.05; **, p < 0.01; ***, p < 0.001; ****, p < 0.0001, by Sidak’s multiple comparisons test. (E) Autophagic vacuoles in control or Flag-ORF3a-expressing HEK293 cells were observed by electron microscopy analysis and representative images are shown. N, nuclei. Scale bar: 1 μm. The arrows indicate autophagosomes.
Figure 2.
Figure 2.
ORF3a localizes to the ER and induces RETREG1-mediated reticulophagy. (A-C) HeLa cells were transfected with mCherry-ORF3a and then stained with ER marker CANX (A), or co-transfected with mCherry-RTN3 and GFP-ORF3a (B), or GFP-RETREG1 and mCherry-ORF3a (C). Twenty-four hours post transfection, cells were fixed, and the images were visualized by confocal microscopy analysis. Scale bar: 5 μm. The coefficient of colocalization was determined by qualitative analysis of the fluorescence intensity of the selected area in merge. (D) Control or RETREG1-knockdown A549 cells were transfected with Flag-ORF3a-expressing plasmid or empty vector for 48 h. The cells were harvested, and the whole cell extracts were immunoblotted with the indicated antibodies. (E) Control or RETREG1-knockdown A549 cells (transfected with ACE2-expressing plasmid for 24 h) were left uninfected or infected with SARS-CoV-2 for 24 h, MOI = 1. the cells were harvested, and the whole cell extracts were analyzed by Western blots to detect the indicated antibodies. (F) A549 cells were transfected with Flag-ORF3a-expressing plasmid or empty vector and ACE2-expressing plasmid for 24 h and then left uninfected or infected with SARS-CoV-2 for 24 h, MOI = 1. The cells were harvested and the whole cell extracts were analyzed. (G) HeLa cells were transfected with SERP1-mCherry-GFP and empty vector or Flag-ORF3a-expressing plasmid. Twenty-four hours post transfection, cells were fixed and subjected to confocal microscopy analysis. The red puncta represent autolysosomes and the yellow puncta indicate autophagosomes. Scale bar: 5 μm. The SERP1 puncta per cell were calculated from 20 cells/each from three independent experiments. *, p < 0.05; **, p < 0.01, by Sidak’s multiple comparisons test.
Figure 3.
Figure 3.
ORF3a interacts with HMGB1 and induces BECN1-dependent reticulophagy. (A) Flag-ORF3a or empty vector was co-transfected into HEK293T cells with scramble or shRNA against EI24, HMGB1, HMOX1, VPS11 or VPS39. Thirty-six hours after transfection, cell pellets were collected, and the whole cell extracts were analyzed by Western blots as indicated to detect LC3-I-to-LC3-II conversion. The densities of LC3-II to ACTB bands were analyzed by a LI-COR Odyssey scanner and quantitated using ImageJ software. The results are shown as the mean ± SD (n = 3), *, p < 0.05; **, p < 0.01; ***, p < 0.001, by Sidak’s multiple comparisons test. (B) GST-tagged HMGB1-expressing plasmid or empty vector was transfected into HEK293T cells with Flag-ORF3a or empty vector for 36 h. Cells were collected, lysed and subjected to immunoprecipitation with GST-affinity beads, and then whole cell lysates and immunoprecipitated complexes were analyzed as indicated. (C) GFP-ORF3a or empty vector was transfected into HEK293T cells for 36 h. Cells were collected, lysed and subjected to immunoprecipitation with GFP-affinity beads, and then whole cell lysates and immunoprecipitated complexes were analyzed by Western blots with anti-HMGB1 antibody as indicated. (D) Different amounts of shRNA against HMGB1 were transfected into HEK293T cells in the presence of Flag-ORF3a-expressing plasmids or empty vector. Thirty-six hours after transfection, cell pellets were collected, and the whole cell extracts were analyzed by Western blots to detect LC3-I-to-LC3-II conversion and CANX. The densities of LC3-II to ACTB were visualized by a LI-COR Odyssey scanner and analyzed using Imagej software. The results are shown as the mean ± SD (n = 3), *, p < 0.05; **, p < 0.01; ***, p < 0.001, by Sidak’s multiple comparisons test. (E) HeLa cells were transfected with empty vector or GFP-ORF3a- and mCherry-HMGB1-expressing plasmid, and then fixed and subjected to confocal microscopy analysis. Scale bar: 10 μm. The coefficient of colocalization was determined by qualitative analysis of the fluorescence intensity of the selected area in merge. (F) Different amounts of Flag-ORF3a-expressing plasmid or empty vector were transfected into HEK293T cells in the presence of GST-HMGB1- and GFP-BECN1-expressing plasmids for 36 h. Cells were collected and lysed, and immunoprecipitation was performed with GST-affinity beads. The whole cell lysates and immunoprecipitated complexes were analyzed as indicated. (G) Flag-ORF3a plasmid or empty vector was transfected into HEK293T cells with GFP-BECN1 plasmid and empty vector or different amounts of GST-HMGB1-expressing plasmid for 36 h. Cells were collected, immunoprecipitation with anti-GFP-affinity beads was performed, and then whole cell lysates and immunoprecipitated complexes were analyzed as indicated. (H) WT and BECN1-KO HEK293T cells were transfected with Flag-ORF3a-expressing plasmid and then left untreated or treated with HBSS for 2 h. Cells were harvested after an additional 50 μM CQ treatment for 4 h, and then cell extracts were detected by Western blots with the indicated antibodies. The densities of LC3, SQSTM1 and ACTB were quantitated and analyzed using ImageJ software. The results are shown as the mean ± SD (n = 3), ****, p < 0.0001, by Sidak’s multiple comparisons test.
Figure 4.
Figure 4.
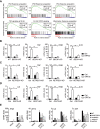
ORF3a activates ER stress through reticulophagy. (A) GSEA analyses of RNA-sequencing data of Flag-ORF3a-overexpressing A549 cells with “Hallmark gene sets” and “Curated gene sets”. NES, normalized enrichment score. FDR, false discovery rate. (B) Flag-ORF3a-expressing plasmid or empty vector was transfected into HEK293T cells. Thirty-six hours after transfection, cell pellets were lysed, and whole cell extracts were analyzed by Western blots with the indicated antibodies. (C) WT or BECN1-KO HEK293T cells were transfected with Flag-ORF3a-expressing plasmid for 36 h, and then lysates were immunoblotted with the indicated antibodies. (D) Control or shRETREG1-transduced A549 cells were transfected with Flag-ORF3a-expressing plasmid for 36 h, and then lysates were immunoblotted with the indicated antibodies. (E) Control and DDIT3 knockdown HEK293T cells were transfected with Flag-ORF3a-expressing plasmid or empty vector for 36 h, cell pellets were harvested after untreated or HBSS treatment for an additional 2 h, and then cell lysates were detected by Western blots with the indicated antibodies. (F) A549 cells were transfected with Flag-ORF3a-expressing plasmid or empty vector and ACE2-expressing plasmid for 24 h and then left uninfected or infected with SARS-CoV-2 for 24 h, MOI = 1. The cells were harvested and the whole cell extracts were analyzed as indicated. The relative ratio of HSPA5/p-EIF2A to ACTB were calculated and shown. (G) Control or RETREG1 knockdown A549 cells (transfected with ACE2-expressing plasmid for 24 h) were left uninfected or infected with SARS-CoV-2 for 24 h, MOI = 1. The cells were harvested, and the whole cell extracts were analyzed by Western blots.
Figure 5.
Figure 5.
ORF3a and SARS-CoV-2 infection activates inflammatory gene expression through reticulophagy and ER stress. (A) GSEA analyses of RNA-sequencing data of Flag-ORF3a-overexpressing A549 cells with “Hallmark gene sets” and “Curated gene sets”. NES, normalized enrichment score. FDR, false discovery rate. (B-D) WT vs. BECN1-KO HEK293T cells (B), control vs. shRETREG1 (C) and control vs. shDDIT3 A549 cells (D) were transfected with Flag-ORF3a-expressing plasmid or empty vector as a control. Twenty-four hours post transfection, cells were treated with poly(I:C) (5 μg/ml) for 24 h (B). And then total RNA was extracted and subjected to quantitative RT-PCR analysis to detect IL6, TNF, IFNB and IL1B expression. The results are shown as the mean ± SD (n = 3), *, p < 0.05; **, p < 0.01; ***, p < 0.001; ****, p < 0.0001, by Sidak’s multiple comparisons test. (E) Control vs. RETREG1, HMGB1, DDIT3 or ERN1 knockdown A549 cells (transfected with ACE2-expressing plasmid for 24 h) were untreated or infected with SARS-CoV-2 for 24 h, MOI = 1, and then total RNA was extracted and subjected to quantitative RT-PCR analysis to detect IL6, TNF, IFNB and IFIT2 expression. The results are shown as the mean ± SD (n = 3), *, p < 0.05; **, p < 0.01; ***, p < 0.001; ****, p < 0.0001, by Sidak’s multiple comparisons test.
Figure 6.
Figure 6.
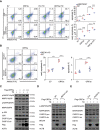
ORF3a enhances ER stress-induced apoptosis through autophagy. (A) WT vs. RETREG1-knockdown A549 cells were transfected with Flag-ORF3a-expressing plasmid or empty vector. After treated with 3 μg/ml TN for 15 h, cells were stained with ANXA5 FITC-PI for flow cytometric analysis, and the representative images and the percentages of apoptotic cells was measured and shown. *, p < 0.05; **, p < 0.01; ***, p < 0.001; ****, p < 0.0001, by Sidak’s multiple comparisons test. (B) WT vs. BECN1-KO HEK293T cells were transfected with Flag-ORF3a-expressing plasmid or empty vector for 48 h. Cells were stained with ANXA5 FITC-PI for flow cytometric analysis, and the representative images and the percentages of apoptotic cells was measured and shown. *, p < 0.05; **, p < 0.01; ***, p < 0.001; ****, p < 0.0001, by Sidak’s multiple comparisons test. (C) Flag-ORF3a-expressing plasmid or empty vector was transfected into HEK293T cells. Twenty-four hours after transfection, cells were treated with 3 μg/ml TN for 15 h, cell pellets were collected, and whole cell extracts were analyzed by Western blots with the indicated antibodies. (D) WT and BECN1-KO HEK293T cells were transfected with Flag-ORF3a-expressing plasmid, cells were harvested after 3 μg/ml TN treatment for 15 h, and then lysates were detected with the indicated antibodies. (E) WT and DDIT3 knockdown HEK293T cells were transfected with Flag-ORF3a-expressing plasmid, cell extracts were prepared after TN (3 μg/ml) treatment for 15 h, and then lysates were detected by Western blots with the indicated antibodies.
Figure 7.
Figure 7.
ORF3a induces virus replication through reticulophagy and ER stress. (A) Control vs. RETREG1 or DDIT3 knockdown A549 cells were transfected with empty vector or Flag-ORF3a- and ACE2-expressing plasmid for 24 h and then left untreated or infected with SARS-CoV-2 for 24 h, MOI = 1. The total RNA was extracted and subjected to quantitative RT-PCR analysis to the expression of SARS-CoV-2 S, N and RdRp. The results are shown as the mean ± SD (n = 3), *, p < 0.05; **, p < 0.01; ***, p < 0.001; ****, p < 0.0001, by Sidak’s multiple comparisons test. (B) Control vs. RETREG1, HMGB1, ERN1 or DDIT3 knockdown A549 cells (transfected with ACE2-expressing plasmid for 24 h) were infected with SARS-CoV-2 for 24 h, MOI = 1.The total RNA was extracted and subjected to quantitative RT-PCR analysis to detect the expression of SARS-CoV-2 S, N and RdRp. The results are shown as the mean ± SD (n = 3), *, p < 0.05; **, p < 0.01; ***, p < 0.001, by Sidak’s multiple comparisons test.
Figure 8.
Figure 8.
Diagram of ORF3a-induced reticulophagy, ER stress and inflammatory responses. During SARS-CoV-2 infection, ORF3a localizes to ER and interacts with HMGB1 and then enhances the association between HMGB1 and BECN1 to initiate RETREG1-mediated reticulophagy. Consequently, ER stress is induced by ORF3a through reticulophagy to facilitate SARS-CoV-2 infection, trigger proinflammatory responses and enhance the sensitivity of cells to CASP12-mediated ER apoptotic cell death. nHMGB1, nuclear HMGB1; cHMGB1, cytosolic HMGB1.

Similar articles

Cited by

  • The role of cell death in SARS-CoV-2 infection.
    Yuan C, Ma Z, Xie J, Li W, Su L, Zhang G, Xu J, Wu Y, Zhang M, Liu W. Yuan C, et al. Signal Transduct Target Ther. 2023 Sep 20;8(1):357. doi: 10.1038/s41392-023-01580-8. Signal Transduct Target Ther. 2023. PMID: 37726282 Free PMC article. Review.
  • The comprehensive SARS-CoV-2 'hijackome' knowledge base.
    Huuskonen S, Liu X, Pöhner I, Redchuk T, Salokas K, Lundberg R, Maljanen S, Belik M, Reinholm A, Kolehmainen P, Tuhkala A, Tripathi G, Laine P, Belanov S, Auvinen P, Vartiainen M, Keskitalo S, Österlund P, Laine L, Poso A, Julkunen I, Kakkola L, Varjosalo M. Huuskonen S, et al. Cell Discov. 2024 Dec 9;10(1):125. doi: 10.1038/s41421-024-00748-y. Cell Discov. 2024. PMID: 39653747 Free PMC article.
  • Autophagy of the ER: the secretome finds the lysosome.
    Knupp J, Pletan ML, Arvan P, Tsai B. Knupp J, et al. FEBS J. 2023 Dec;290(24):5656-5673. doi: 10.1111/febs.16986. Epub 2023 Nov 3. FEBS J. 2023. PMID: 37920925 Free PMC article. Review.
  • Contribution to pathogenesis of accessory proteins of deadly human coronaviruses.
    Hurtado-Tamayo J, Requena-Platek R, Enjuanes L, Bello-Perez M, Sola I. Hurtado-Tamayo J, et al. Front Cell Infect Microbiol. 2023 May 1;13:1166839. doi: 10.3389/fcimb.2023.1166839. eCollection 2023. Front Cell Infect Microbiol. 2023. PMID: 37197199 Free PMC article. Review.
  • Some aspects of the life of SARS-CoV-2 ORF3a protein in mammalian cells.
    Jiao S, Miranda P, Li Y, Maric D, Holmgren M. Jiao S, et al. Heliyon. 2023 Aug 1;9(8):e18754. doi: 10.1016/j.heliyon.2023.e18754. eCollection 2023 Aug. Heliyon. 2023. PMID: 37609425 Free PMC article.

References

    1. Zhou P, Yang X-L, Wang X-G, et al. A pneumonia outbreak associated with a new coronavirus of probable bat origin. Nature. 2020;579(7798):270–273. - PMC - PubMed
    1. Zhu N, Zhang D, Wang W, et al. A Novel Coronavirus from Patients with Pneumonia in China, 2019. N Engl J Med. 2020;382(8):727–733. - PMC - PubMed
    1. Fehr AR, Channappanavar R, Perlman S.. Middle east respiratory syndrome: emergence of a pathogenic human coronavirus. Annu Rev Med. 2017;68(1):387–399. - PMC - PubMed
    1. Channappanavar R, Fehr AR, Vijay R, et al. Dysregulated type i interferon and inflammatory monocyte-macrophage responses cause lethal pneumonia in SARS-CoV-INFECTED mice. Cell Host Microbe. 2016;19(2):181–193. - PMC - PubMed
    1. Chen Y, Liu Q, Guo D. Emerging coronaviruses: genome structure, replication, and pathogenesis. J Med Virol. 2020;92(4):418–423. - PMC - PubMed

Publication types