. 2022 Mar 3;20(3):e3001530.
doi: 10.1371/journal.pbio.3001530. eCollection 2022 Mar.

Complementary encoding of spatial information in hippocampal astrocytes

Affiliations

Complementary encoding of spatial information in hippocampal astrocytes

Sebastiano Curreli et al. PLoS Biol. .

Abstract

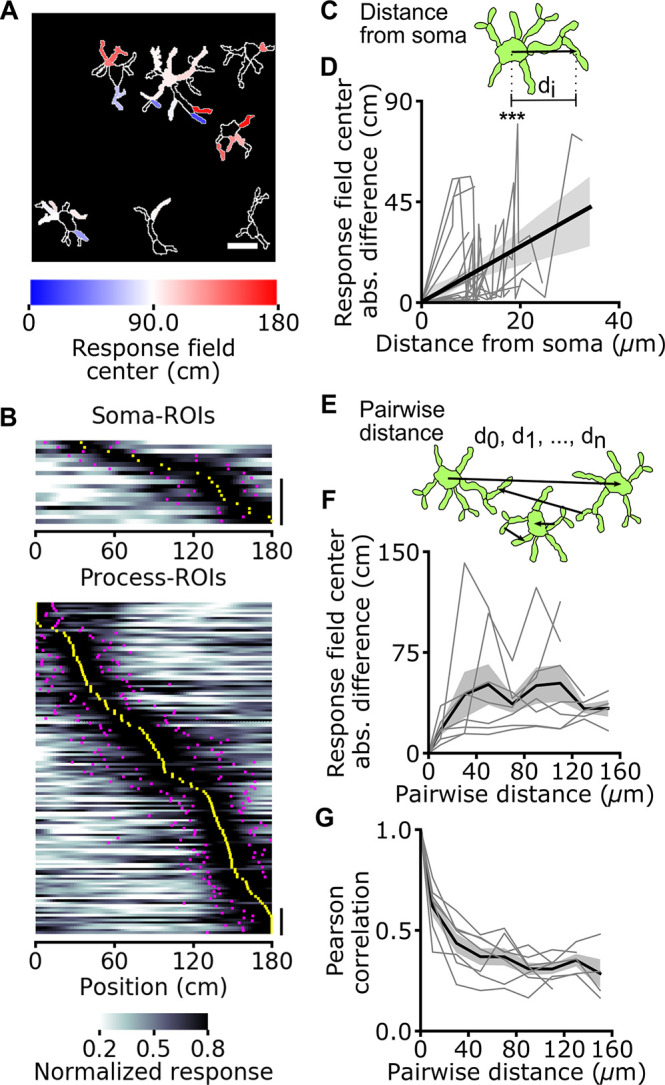
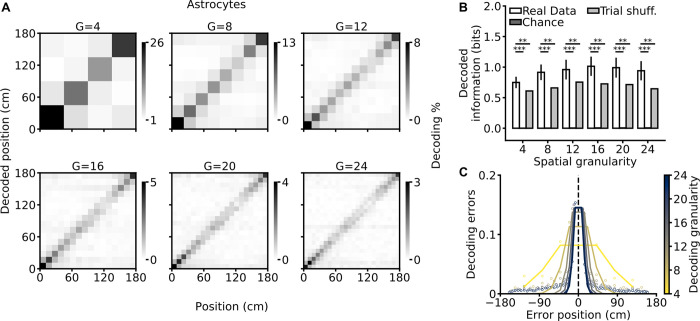
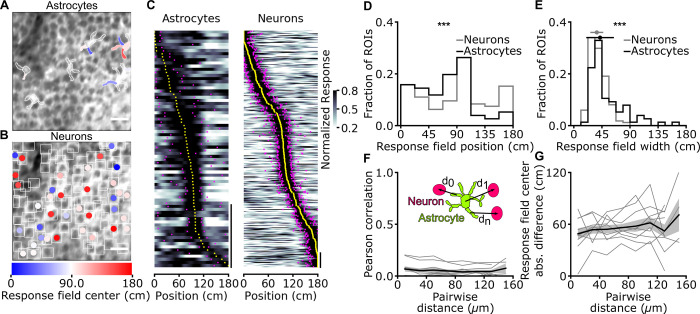
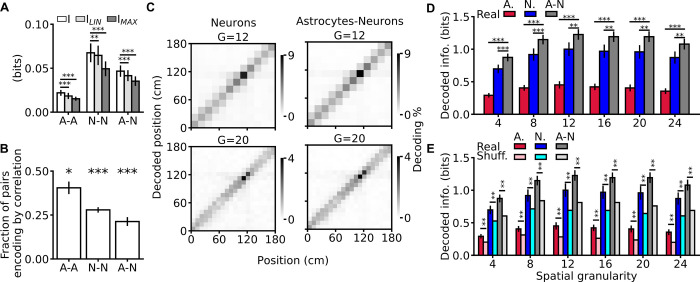
Calcium dynamics into astrocytes influence the activity of nearby neuronal structures. However, because previous reports show that astrocytic calcium signals largely mirror neighboring neuronal activity, current information coding models neglect astrocytes. Using simultaneous two-photon calcium imaging of astrocytes and neurons in the hippocampus of mice navigating a virtual environment, we demonstrate that astrocytic calcium signals encode (i.e., statistically reflect) spatial information that could not be explained by visual cue information. Calcium events carrying spatial information occurred in topographically organized astrocytic subregions. Importantly, astrocytes encoded spatial information that was complementary and synergistic to that carried by neurons, improving spatial position decoding when astrocytic signals were considered alongside neuronal ones. These results suggest that the complementary place dependence of localized astrocytic calcium signals may regulate clusters of nearby synapses, enabling dynamic, context-dependent variations in population coding within brain circuits.


Conflict of interest statement

The authors have declared that no competing interests exist.

Figures

Fig 1
Fig 1. Astrocytic calcium signals in the CA1 hippocampal area encode spatial information during virtual navigation.
(A) Two-photon fluorescence imaging was performed in head-fixed mice running along a monodirectional virtual track. (B) GCaMP6f was expressed in CA1 astrocytes, and imaging was performed through a chronic optical window. (C) Mice navigated in a virtual linear corridor in one direction, receiving a water reward in the second half of the virtual corridor. (D) Median projection of GCaMP6f-labeled astrocytes in the CA1 pyramidal layer. Scale bar: 20 μm. (E) Calcium signals for 5 representative astrocytic ROIs encoding spatial information across the corridor length. Solid black lines indicate the average astrocytic calcium response across trials as a function of spatial position. Dashed gray lines and filled gray areas indicate Gaussian fitting function and response field width (see Methods), respectively (see also S3 Fig). (F) Normalized astrocytic calcium responses as a function of position for astrocytic ROIs that contain significant spatial information (N = 155 ROIs with reliable spatial information out of 356 total ROIs, 7 imaging sessions from 3 animals). Responses are ordered according to the position of the center of the response field (from minimum to maximum). Left panel, astrocytic calcium responses from all trials. Center and right panels, astrocytic calcium responses from odd (center) or even (right) trials. Yellow dots indicate the center position of the response field, and magenta dots indicate the extension of the field response (see Methods, vertical scale: 50 ROIs). (G) Distribution of response field position. (H) Distribution of field width. (I) Distribution of the differences between the center position of the response fields in cross-validated trials and odd trials (black) or cross-validated and even trails (gray). Deviations for odd and even trials are centered at 0 cm: median deviation for odd trials 2 ± 13 cm; median deviation for even trials −1 ± 17 cm, neither is significantly different from zero (p = 0.07 and p = 0.69, respectively, Wilcoxon signed rank test with Bonferroni correction. N = 155 ROIs from 7 imaging sessions on 3 animals). The data presented in this figure can be found in S1 Data. ROI, region of interest.
Fig 2
Fig 2. Topographic organization of spatial information encoding in astrocytes: somas versus processes.
(A) Astrocytic ROIs in a representative FOV are color coded according to response field position along the virtual corridor. Scale bar: 20 μm. (B) Normalized astrocytic calcium responses as a function of position for astrocytic ROIs with reliable spatial information corresponding to somas (top) and processes (bottom) (somas: 19 ROIs with reliable spatial information out of 46 total ROIs; processes: 136 ROIs with reliable spatial information out of 310 total ROIs; data from 7 imaging sessions in 3 animals). Vertical scale: 10 ROIs. (C) Distance between the center of a process ROI and corresponding soma ROI computed for each astrocyte. (D) Absolute difference in response field position of a process ROI with respect to the field position of the corresponding soma ROI as a function of the distance between the 2 (R2 = 0.21, p = 3.2E-6, Wald test, data from 19 cells in which there was significant spatial modulation in the soma and at least 1 process; 7 imaging sessions on 3 animals). (E) The distance between the centers of pairs of ROIs (d0, d1, dn) is computed across recorded astrocytic ROIs. (F, G) Pearson correlation (F) and difference between response field position (G) for pairs of astrocytic ROIs containing reliable spatial information across the whole FOV as a function of pairwise ROI distance. Gray lines indicate single experiments, and black line and the gray shade indicate mean ± SEM, respectively. Data from 41 cells in which there was significant spatial modulation in at least 1 ROI; 7 imaging sessions in 3 animals. In this as well as in other figures: *, p < 0.05; **, p ≤ 0.01; ***, p ≤ 0.001. The data presented in this figure can be found in S1 Data. FOV, field of view; ROI, region of interest; SEM, standard error of the mean.
Fig 3
Fig 3. Efficient decoding of the animal’s spatial location from astrocytic calcium signals.
(A) Confusion matrices of an SVM classifier for different decoding granularities (G = 4, 8, 12, 16, 20, and 24). The actual position of the animal is shown on the x-axis, and decoded position is on the y-axis. The gray scale indicates the number of events in each matrix element. (B) Decoded information as a function of decoding granularity on real (white), chance (dark gray), and trial-shuffled (gray) data (see Methods). Trial shuffling disrupts temporal coupling within astrocytic population vectors while preserving single ROI activity patterns. Data are shown as mean ± SEM. See also S2 Table. (C) Decoding error as a function of the error position within the confusion matrix. The color code indicates decoding granularity. Data in all panels were obtained from 7 imaging sessions in 3 animals. The data presented in this figure can be found in S1 Data. ROI, region of interest; SEM, standard error of the mean; SVM, support vector machine.
Fig 4
Fig 4. The majority of spatial information in astrocytes is genuine spatial information that cannot be explained by tuning to visual cues.
(A) Fraction of astrocytic ROIs encoding reliable spatial information showing a significant decrease in their information content when position is shuffled within the same visual cue (see Methods). Shuffling position within the same visual cue decouples spatial information encoded in the astrocytic response from the information related to visual cues identity (see Methods). The fraction of ROIs showing significant information loss is shown as function of the number of position bins used to compute mutual information. p = 3.5E-168, p = 3.2E-138, p = 5.0E-133, and p = 5.2E-85 for 9, 12, 15, and 18 position bins, respectively; N = 155, binomial test. (B) Decoded information as a function of decoding granularity on real data (I, white) and for data in which position is shuffled within the same visual cue (IV, gray). p = 1.6E-2, p = 1.6E-2, p = 1.6E-2, and p = 1.6E-2 for decoding granularity of 9, 12, 15, and 18, respectively. N = 7 imaging sessions, Wilcoxon signed rank test. See also S10 Fig. (C) Fraction of genuine spatial information in astrocytic population vectors computed shuffling position within individual visual cues. Results are shown as a function of decoding granularity. In all panels, data are shown as mean ± SEM and were obtained from 7 imaging sessions in 3 animals. The data presented in this figure can be found in S1 Data. ROI, region of interest; SEM, standard error of the mean.
Fig 5
Fig 5. Astrocytes have broader response field width and a different distribution of field position compared to neurons.
(A, B) ROIs corresponding to simultaneously recorded GCaMP6f-labeled astrocytes (A) and jRCaMP1a-labeled neurons (B) in the CA1 pyramidal layer. ROIs are color coded according to response field and place field center along the virtual corridor, respectively. Scale bar: 20 μm. (C) Normalized calcium responses as a function of position for astrocytic ROIs (left) and neuronal ROIs (right) that contain a significant amount of spatial information (astrocytic ROIs, N = 76 ROIs with reliable spatial information out of 341 total ROIs; neuronal ROIs, N = 335 ROIs with reliable spatial information out of 870 total ROIs, data from 11 imaging sessions in 7 animals). Responses are ordered according to the position of the center of the response field for astrocytes and place field for neurons. Vertical scale bar, 20 ROIs. (D) Distribution of astrocytic response field position (black line) and neuronal place field position (gray line, p = 5E-4, Kolmogorov–Smirnov test for comparison between astrocytic and neuronal distribution). (E) Distribution of astrocytic response field width (black line) and neuronal place field width (gray line, median width of astrocytic response field: 42 ± 22 cm, N = 76; median width of neuronal place field: 37 ± 10 cm, N = 335, p = 2E-5, Wilcoxon rank sums test for comparison between astrocytic and neuronal distribution). (F, G) The inset shows astrocytic ROIs (green) and neuronal ROIs (pink). For all pairs, the distance (d0, d1, dn) between the center of an astrocytic ROI and the center of a neuronal ROI, both containing reliable spatial information, is computed. Pairwise Pearson correlation (F) and difference between response field position for astrocyte–neuron ROI pairs (G) as a function of pair distance. In (F,G) Data are expressed as mean ± SEM. Data are from 11 imaging sessions in 7 animals (see also S15 Fig). The data presented in this figure can be found in S1 Data. ROI, region of interest; SEM, standard error of the mean.
Fig 6
Fig 6. Spatial information encoding in astrocytes is complementary and synergistic to spatial information encoding in neurons.
(A) Information about position carried by pairs of ROIs (I) compared to the sum (ILIN) or the maximum (IMAX) of the information separately encoded by each member of the pair. A-A, pair composed of 2 astrocytic ROIs; N-N, pair composed of 2 neuronal ROIs; A-N, mixed pair composed of one astrocytic and one neuronal ROI (I versus ILIN: A-A: p = 1E-3, N-N: p = 5E-3, A-N: p = 1E-3; I versus IMAX: A-A: p = 1E-3, N-N: p = 1E-3, A-N: p = 1E-3, Wilcoxon signed rank test, see also S19 Fig and S3 Table). (B) Fraction of pairs encoding spatial information encoding by correlations (A-A: p = 3E-2, N-N: p = 1E-3, A-N: p = 1E-3, Wilcoxon signed rank-test with respect to the null hypothesis that a pair could be either synergistic or nonsynergistic with equal probability set at 0.5). (C) Representative confusion matrices of an SVM classifier decoding mouse position using population vectors comprising neuronal (left) or astrocytic and neuronal ROIs (right), for different decoding granularities (G = 12, 20, see also S21 Fig). (D) Decoded information for population vectors of different compositions (A, astrocytic ROIs only; N, neuronal ROIs only; A-N, population vector considering all ROIs) as a function of decoding granularity (see S4 Table). (E) Same as in (D) but adding comparison with trial-shuffled data (lighter bars) (see S5 Table). In panels A, B, D, and E, data are represented as mean ± SEM. In all panels, data are obtained from 11 imaging sessions in 7 animals. The data presented in this figure can be found in S1 Data. ROI, region of interest; SEM, standard error of the mean; SVM, support vector machine.

Comment in

References

    1. Bazargani N, Attwell D. Astrocyte calcium signaling: the third wave. Nat Neurosci. 2016;19(2):182–9. doi: 10.1038/nn.4201 - DOI - PubMed
    1. Panatier A, Vallee J, Haber M, Murai KK, Lacaille JC, Robitaille R. Astrocytes are endogenous regulators of basal transmission at central synapses. Cell. 2011;146(5):785–98. doi: 10.1016/j.cell.2011.07.022 - DOI - PubMed
    1. Di Castro MA, Chuquet J, Liaudet N, Bhaukaurally K, Santello M, Bouvier D, et al.. Local Ca2+ detection and modulation of synaptic release by astrocytes. Nat Neurosci. 2011;14(10):1276–84. doi: 10.1038/nn.2929 - DOI - PubMed
    1. Srinivasan R, Huang BS, Venugopal S, Johnston AD, Chai H, Zeng H, et al.. Ca(2+) signaling in astrocytes from Ip3r2(-/-) mice in brain slices and during startle responses in vivo. Nat Neurosci. 2015;18(5):708–17. doi: 10.1038/nn.4001 - DOI - PMC - PubMed
    1. Bindocci E, Savtchouk I, Liaudet N, Becker D, Carriero G, Volterra A. Three-dimensional Ca(2+) imaging advances understanding of astrocyte biology. Science. 2017;356(6339). doi: 10.1126/science.aai8185 - DOI - PubMed

Publication types