. 2022 Mar 3;18(3):e1010106.
doi: 10.1371/journal.pgen.1010106. eCollection 2022 Mar.

ER-PM membrane contact site regulation by yeast ORPs and membrane stress pathways

Affiliations

ER-PM membrane contact site regulation by yeast ORPs and membrane stress pathways

Evan Quon et al. PLoS Genet. .

Abstract

In yeast, at least seven proteins (Ice2p, Ist2p, Scs2/22p, Tcb1-Tcb3p) affect cortical endoplasmic reticulum (ER) tethering and contact with the plasma membrane (PM). In Δ-super-tether (Δ-s-tether) cells that lack these tethers, cortical ER-PM association is all but gone. Yeast OSBP homologue (Osh) proteins are also implicated in membrane contact site (MCS) assembly, perhaps as subunits for multicomponent tethers, though their function at MCSs involves intermembrane lipid transfer. Paradoxically, when analyzed by fluorescence and electron microscopy, the elimination of the OSH gene family does not reduce cortical ER-PM association but dramatically increases it. In response to the inactivation of all Osh proteins, the yeast E-Syt (extended-synaptotagmin) homologue Tcb3p is post-transcriptionally upregulated thereby generating additional Tcb3p-dependent ER-PM MCSs for recruiting more cortical ER to the PM. Although the elimination of OSH genes and the deletion of ER-PM tether genes have divergent effects on cortical ER-PM association, both elicit the Environmental Stress Response (ESR). Through comparisons of transcriptomic profiles of cells lacking OSH genes or ER-PM tethers, changes in ESR expression are partially manifested through the induction of the HOG (high-osmolarity glycerol) PM stress pathway or the ER-specific UPR (unfolded protein response) pathway, respectively. Defects in either UPR or HOG pathways also increase ER-PM MCSs, and expression of extra "artificial ER-PM membrane staples" rescues growth of UPR mutants challenged with lethal ER stress. Transcriptome analysis of OSH and Δ-s-tether mutants also revealed dysregulation of inositol-dependent phospholipid gene expression, and the combined lethality of osh4Δ and Δ-s-tether mutations is suppressed by overexpression of the phosphatidic acid biosynthetic gene, DGK1. These findings establish that the Tcb3p tether is induced by ER and PM stresses and ER-PM MCSs augment responses to membrane stresses, which are integrated through the broader ESR pathway.


Conflict of interest statement

The authors have declared that no competing interests exist.

Figures
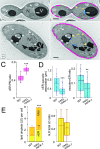
Fig 1
Fig 1. Effect of eliminating all Osh proteins on cortical ER-PM contact, nuclear ER-vacuole and nuclear ER-lipid droplet association.
(A) Transmission electron micrographs of WT (SEY6210) and (B) osh4-1ts oshΔ (CBY926) cells at 37°C for 1 h. Right panels highlight cortical ER association with the PM (magenta), nuclear ER association with vacuoles (blue), and nuclear ER association with lipid droplets (yellow). N, nucleus;V, vacuole, arrowheads indicate examples of lipid droplets. (C) Quantification of WT and osh4-1ts oshΔ cell electron micrographs of the ratio of total lengths of cortical associated ER (cER) relative to the total PM lengths in WT and osh4-1ts oshΔ cells (n = 25 cells for each strain). (D) Left: quantification of the average length (μm) of nuclear ER (nER) in association with vacuolar membrane in WT and osh4-1ts oshΔ cells (n ≥ 29 cells). Right: ratio of nER associated with vacuolar membrane per the total nER (n ≥ 31 cells). (E) Left: comparison of total numbers of lipid droplets (LD) per cell (orange) and the number of those LDs associated with nER (yellow) in WT and osh4-1ts oshΔ cells (n ≥ 32 cells; error bars indicate standard error of the mean [SEM]). Right: ratios of these nER-associated LDs (nLDs) to total LDs per cell (n ≥ 32 cells). In all box and whisker plots, boxes indicate the interquartile range around the mean, median values are shown by lines within boxes, error bars indicate standard deviations. All statistical significance was calculated using two tail student’s t-test with heteroscedastic variance. ***p ≤ 0.0001, **p ≤ 0.002. Scale bars = 1 μm.
Fig 2
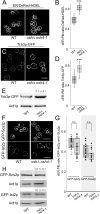
Fig 2. Cortical ER-PM association and levels of the Tcb3p tether increase upon inactivation of Osh proteins.
(A) Representative fluorescent microscopy images of WT (SEY6210) and osh4-1ts oshΔ (CBY926) cells, incubated at 37°C for 1 h, expressing episomal DsRed-HDEL (pRS416-DsRed-HDEL) showing ER localization and increased cortical fluorescence in osh4-1ts oshΔ cells. (B) Quantified ratios of total lengths of DsRed-HDEL-fluorescent cER relative to total PM lengths (PM) in WT and osh4-1ts oshΔ cells at 37°C for 1 h (n = 20 cells per strain). (C) Images of WT (CBY6087) and osh4-1ts oshΔ (CBY6091) expressing integrated TCB3-GFP after incubation at 37°C for 1 h. (D) Quantified ratios of total cortical Tcb3p-GFP fluorescence length to total PM length in WT and osh4-1ts oshΔ cells (n = 20 cells per strain). (E) Corresponding to panel C, representative immunoblots probed with anti-GFP and anti-actin antibodies showing relative Tcb3-GFP levels in WT and osh4-1ts oshΔ at 37°C for 1 h, as compared to the actin (Act1p) control. In osh4-1ts oshΔ cells the fold increase in Tcb3-GFP levels was 2.1 ± 0.1 relative to WT (mean ± SD; n = 3). (F) Images of WT and osh4-1ts oshΔ cells expressing integrated GFP-IST2 (CBY7300 and CBY7302, respectively) or integrated GFP-SCS2 (CBY7304 and CBY7306, respectively). (G) Quantified ratios of total lengths of cortical GFP-Ist2p or -Scs2p fluorescence relative to total PM length in WT and osh4-1ts oshΔ cells (n = 20 cells per strain). (H) Representative immunoblots probed with anti-GFP and anti-actin antibodies shown relative GFP-Ist2p or -Scs2p levels in WT and osh4-1ts oshΔ at 37°C for 1 h, relative to the actin (Act1p) control (mean ± SD; n = 3). Box and whisker plots and statistics as described in Fig 1. ***p ≤ 9 x 10⁻⁸; n.s. = not significant. Scale bars = 5 μm.
Fig 3
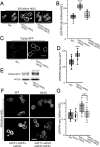
Fig 3. Elimination of FFAT-containing (long) Osh proteins increase Tcb3p-dependent cortical ER-PM association.
(A) Representative fluorescent microscopy images of WT (SEY6210), osh1Δ osh2Δ osh3Δ (lacking “long” OSHs; JRY6253) and osh4Δ osh5Δ osh6Δ osh7Δ (lacking “short” OSHs; JRY6272) cells expressing DsRed-HDEL (pRS416-DsRed-HDEL) cultured at 30°C. (B) Quantified ratios for total cortical DsRed-HDEL fluorescence length per total PM length in WT, osh1Δ osh2Δ osh3Δ, and osh4Δ osh5Δ osh6Δ osh7Δ cells (n = 20 cells per strain). ***p = 1.9 x 10⁻¹⁶ compared to WT. (C) Images of WT and osh1Δ osh2Δ osh3Δ (CBY7274) expressing TCB3-GFP cultured at 30°C. (D) Quantified ratios of total cortical Tcb3p-GFP fluorescence length to total PM length in WT and osh1Δ osh2Δ osh3Δ cells (n = 20 cells per strain). ***p = 1.4 x 10⁻⁶ compared to WT. (E) Corresponding to panel C, representative immunoblots probed with anti-GFP and anti-actin antibodies showing relative Tcb3-GFP levels in WT and osh1Δ osh2Δ osh3Δ, as compared to the actin (Act1p) control. (F) Representative images of WT (SEY6210), osh1Δ osh2Δ osh3Δ (JRY6253), and osh1Δ osh2Δ osh3Δ tcb3Δ (CBY7392) cells expressing DsRed-HDEL cultured at 30°C. (G) Quantification of cER per total PM in WT and osh1Δ osh2Δ osh3Δ, and osh1Δ osh2Δ osh3Δ tcb3Δ cells corresponding to the images in F (n = 20 cells per strain). ***p = 8.2 x 10⁻⁵ comparing to osh1Δ osh2Δ osh3Δ cells with and without TCB3 deletion. Arrowheads indicate cells with increased coverage of cortical ER. Box and whisker plots and statistics as in Fig 1. Scale bars = 5 μm.
Fig 4
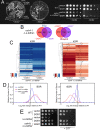
Fig 4. Transcriptomic profiles of osh4-1ts Δ-s-tether, Δ-s-tether and osh4-1ts oshΔ cells.
Volcano plots showing relative transcript abundance in (A) osh4-1ts Δ-s-tether (CBY6031), (B) Δ-s-tether (CBY5898) and (C) osh4-1ts oshΔ (CBY926) cells grown in synthetic minimal media at 37°C. Plots show log2-fold expression change relative to WT (SEY6210) versus the negative log10-P value (y-axis). Transcript changes log2 ≥ or ≤ 1 are shown in black whereas representative stress pathway genes are blue and red, corresponding to induction or repression, respectively. (D) Venn Diagram showing overlapping subsets of upregulated (blue) or downregulated genes (red) in osh4-1ts Δ-s-tether, Δ-s-tether and osh4-1ts oshΔ cells.
Fig 5
Fig 5. Effects of osh4-1ts oshΔ, Δ-s-tether, and osh4-1ts Δ-s-tether mutations on membrane stress pathways.
Heatmap analyses of transcriptional responses relative to WT (SEY6210) at 37°C for 1 h in osh4-1ts Δ-s-tether (CBY6031), Δ-s-tether (CBY5898), and osh4-1ts oshΔ (CBY926) cells affecting (A) UPR, (B) heat shock and (C) high-osmolarity glycerol (HOG) pathway genes. Downregulated genes are shown in red, upregulated genes are shown in blue. UPR-responsive genes were curated from Kimata et al. [86] and using the Saccharomyces Genome Database (SGD), heat shock genes were curated from Hsf1p target genes and HOG pathway genes compiled from listed target genes of Msn2p/4p, Smp2p, Hot1p, and Sko1p. Histograms within each column represent the number of transcripts for each color in the heatmap.
Fig 6
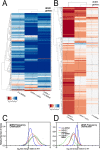
Fig 6. ESR responses to OSH and ER-PM tether mutations.
Heatmap analyses of transcriptional responses relative to WT (SEY6210) at 37°C for 1 h in osh4-1ts Δ-s-tether (CBY6031), Δ-s-tether (CBY5898), and osh4-1ts oshΔ (CBY926) cells affecting (A) iESR and (B) rESR genes. Downregulated genes are shown in red, upregulated genes are shown in blue. iESR and rESR regulated genes were curated from previous reports [51,87]. Histograms within each column represents the number of transcripts for each color in the heatmap. (C) Graphical representations of the distribution of iESR and (D) rESR gene responses in osh4-1ts Δ-s-tether, Δ-s-tether, and osh4-1ts oshΔ cells.
Fig 7
Fig 7. Hierarchical clustering of transcriptomic responses in osh4-1ts oshΔ, Δ-s-tether, and osh4-1ts Δ-s-tether cells.
(A) Hierarchical clustering analysis of genomic transcriptional changes corresponding to osh4-1ts Δ-s-tether (CBY6031) and osh4-1ts oshΔ (CBY926) cells relative to WT (SEY6210) at 37°C for 1 h, and Δ-s-tether (CBY5898) relative to WT cultured at 30°C. Based on differential gene expression, genomic responses were separated into five distinct clusters, as denoted by the colours and numbers adjacent to the heatmaps and analyzed using Metaspace. (B) Clustered Gene Ontology (GO) analysis of gene functions corresponding to each of the five gene clusters. As specified by colour and described in the figure key, each node represents a distinct enrichment of gene sets that reflect a separate GO term. Clusters of nodes are grouped as corresponds to the clusters as shown in (A).
Fig 8
Fig 8. Phospholipid gene dysregulation due to Opi1p nuclear translocation defects.
(A) Relative to WT (SEY6210), transcript abundance of OPI1, INO1, INO2 and INO4 in Δ-s-tether (CBY5838) cells cultured with or without 75 μM inositol at 30°C for 1 h. Relative mRNA levels of these phospholipid regulatory genes were also determined in osh4-1ts oshΔ (CBY926) cells at 37°C for 1 h, with or without inositol. (B) Representative confocal fluorescent microscopy images of WT, osh4-1ts oshΔ, and Δ-s-tether cells expressing GFP-Opi1p (pRS416-PHO5-GFP-OPI1) grown with or without 300 μM inositol at the growth temperatures indicated. Arrows indicate examples of GFP-Opi1p at the ER/nuclear membrane, arrowheads indicate intranuclear localization, and asterisks indicate examples of GFP-Opi1p localization distinct from either nuclear ER or intranuclear fluorescence. Inserts show examples of magnified images of nuclear membrane or intranuclear GFP-Opi1p. Scale bar = 5 μm. (C) Quantification of GFP-Opi1p localization in cells corresponding to panel (B). In response to inositol addition, the percentage of cells with GFP-Opi1p localization in the ER membrane, intranuclear, or other cellular membrane is indicated as shown (n = 300 cells per each strain).
Fig 9
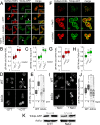
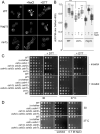
Fig 9. Both ER UPR and PM osmotic stresses increase Tcb3p-dependent ER-PM MCSs.
(A) Representative fluorescent microscopy images of WT cells (CBY6087) expressing DsRed-HDEL (pRS416-DsRed-HDEL) and TCB3-GFP. Cells grown in synthetic minimal media with or without 75 μM inositol were treated with 2 mM DTT at 30°C for 2 h. (B) Ratios of the total length of cortical DsRed-HDEL fluorescence (cER) per total PM in WT, and (C) Relative ratios of cortical Tcb3p-GFP fluorescence per PM in WT cells, corresponding to A (n = 20 cells per condition). (D) Representative images of WT (BY4742) and tcb3Δ (CBY7354) cells expressing DsRed-HDEL treated with 2 mM DTT at 30°C for 2 h. (E) Quantification of WT and tcb3Δ cER per total PM corresponding to D (n = 20 cells per strain). (F) Representative fluorescent microscopy images of WT (CBY6087) cells expressing DsRed-HDEL (pRS416-DsRed-HDEL) and TCB3-GFP. Cells were cultured in synthetic minimal media with or without 0.7 M NaCl or 1 M sorbitol at 30°C for 2 h. (G) Relative ratios of cortical DsRed-HDEL fluorescence (cER) per PM in WT, and (H) Ratios of cortical Tcb3p-GFP fluorescence per PM in WT, corresponding to F (n = 20 cells per condition). (I) Representative images of WT (BY4742) and tcb3Δ (CBY7354) cells expressing DsRed-HDEL treated with 0.7 M NaCl at 30°C for 2 h. (J) Quantification of WT and tcb3Δ cER per total PM corresponding to I (n = 20 cells per strain). (K) Representative immunoblot probed with anti-GFP and anti-actin antibodies showing relative GFP-Tcb3p levels in WT cells cultured with 2 mM DTT or 0.7 M NaCl for 2 h at 30°C, relative to the actin (Act1p) control (mean ± SD; n = 3). Arrowheads indicate cells with nearly absolute coverage of the cortex with ER or Tcb3p. Box and whisker plots and statistics as described in Fig 1. Statistical significances compare treated to untreated cells for panels B, C, G, and H, and treated WT versus treated tcb3Δ cells for E and J. ***p ≤ 2 x 10⁻⁷. Scale bars = 5 μm.
Fig 10
Fig 10. ER-PM MCS dependence on IRE1, HOG1, and OSHs.
(A) Representative fluorescent microscopy images of WT (BY4741), ire1Δ (CBY1048), and hog1Δ (CBY6465) cells expressing DsRed-HDEL (pRS416-DsRed-HDEL). Cells cultured in synthetic complete media were treated with 2 mM DTT or 0.7 M NaCl at 30°C for 2 h. Arrowheads indicate examples of nearly complete association of ER with the cell cortex. (B) Ratios of the total length of cortical DsRed-HDEL fluorescence (cER) per total PM length in WT, ire1Δ, and hog1Δ cells (n = 20 cells for strain and each condition; statistical significance shown for treated versus untreated cells of the same genotype). (C) Tenfold serial dilutions of WT (SEY6210), Δ-s-tether (CBY5838), osh4-1ts oshΔ (CBY926), osh1Δ osh2Δ osh3Δ (JRY6253), osh4Δ osh5Δ osh6Δ osh7Δ (JRY6272), ire1Δ (CBY1048) and WT (BY4741) cells spotted onto solid synthetic minimal media with or without 4 mM DTT or 75 μM inositol and cultured at 30°C or 37°C for 2–4 days. (D) Tenfold serial dilutions of WT, Δ-s-tether, osh4-1ts oshΔ, osh1Δ osh2Δ osh3Δ, osh4Δ osh5Δ osh6Δ osh7Δ cells grown on solid synthetic minimal media with or without 0.7 M NaCl or 1M sorbitol at 30°C or 37°C for 3–5 days. Box and whisker plots and statistics as described in Fig 1. ***p ≤ 1.2 x 10⁻⁷, **p = 0.001, *p = 0.01. Scale bars = 5 μm.
Fig 11
Fig 11. The “artificial ER-PM staple” rescues UPR inactivation, and deletion of HOG1 or IRE1 is synthetically lethal with osh1Δ osh2Δ osh3Δ.
(A) Tenfold serial dilutions of osh4-1ts Δ-s-tether cells with its congenic WT (SEY6210) control, and hog1Δ and ire1Δ with their congenic WT (BY4741) control, expressing either the “artificial membrane staple” (pCB1185) or the vector control (YCplac111). Cells were grown at 30°C or 37°C on synthetic medium with or without 4 mM DTT for 3 or 5 days, respectively. (B) Tenfold serial dilutions of WT (SEY6210), osh1Δ osh2Δ osh3Δ (JRY6263), and osh1Δ osh2Δ osh3Δ ire1Δ (CBY6916) cells containing an episomal copy of OSH2 (+OSH2; pCB113). Cells were spotted onto selective solid medium, or on solid medium containing 5-FAA to select against the OSH2 containing plasmid (-OSH2) and grown for 3 days at 30°C. Removal of the OSH2 plasmid from osh1Δ osh2Δ osh3Δ ire1Δ cells is lethal. (C) Tenfold serial dilutions of WT (SEY6210), hog1Δ (CBY6912), osh1Δ osh2Δ osh3Δ (JRY62563), osh1Δ osh2Δ osh3Δ hog1Δ (CBY6914) cells that all contain an episomal copy of OSH2 (+OSH2; pCB113). Cells were spotted onto selective solid media, with or without 5-FAA to select against the OSH2 containing plasmid (-OSH2) and grown for 4 days at 30°C. The OSH2 plasmid is necessary for osh1Δ osh2Δ osh3Δ hog1Δ cells growth indicating that HOG1 deletion in osh1Δ osh2Δ osh3Δ cells is lethal.
Fig 12
Fig 12. DGK1 is a multicopy suppressor of osh4 Δ-s-tether lethality that alleviates rESR gene repression.
(A) Left: WT (SEY6210) and osh4Δ Δ-s-tether cells (CBY5988) that contain SCS2 on a URA3-marked plasmid (pSCS2), transformed with a high-copy 2μ plasmid expressing DGK1 (pCB1346) or a vector control (YEplac181), onto solid growth medium. Cells were cultured for 5 days at 30°C on growth medium (containing 5’-FOA) to select against the SCS2-containing plasmid (-SCS2). As compared to growth on standard synthetic medium (+SCS2), osh4Δ Δ-s-tether cells are only viable when DGK1 was present without SCS2. Right: Similar to above, tenfold serial dilutions of WT and osh4Δ Δ-s-tether cells containing both the SCS2 plasmid and high-copy DGK1, or the vector control, spotted on solid growth media with 5’-FOA (-SCS2) or without (+SCS2). High-copy DGK1 rescues the lethality of osh4Δ Δ-s-tether mutations. (B) Venn Diagram indicating numbers of upregulated (↑UP) or downregulated genes (DOWN↓) in osh4-1ts Δ-s-tether cells with (+ DGK1; purple) or without (- DGK1; light red) high-copy DGK1 plasmids at 37°C for 1 h, relative to WT. (C) Heatmap analyses of iESR and rESR transcriptional responses in osh4-1ts Δ-s-tether cells with or without high-copy DGK1 expression relative to WT, at 37°C for 1 h. Downregulated genes shown in red; upregulated genes shown in blue. (D) Graphical representation of the distribution of iESR and rESR gene responses in osh4-1ts Δ-s-tether, with and without high-copy DGK1 expression. (E) Tenfold serial dilutions of WT and Δ-s-tether (CBY5838) cells transformed either with vector or high-copy DGK1, and osh4Δ Δ-s-tether cells suppressed with high copy DGK1 (CBY6506). Cells were grown at 30°C on synthetic medium with or without 4 mM DTT for 4–5 days.
Fig 13
Fig 13. Representative fluorescent microscopy images of WT (SEY6210) and Δ-s-tether (CBY5838) cells both transformed with a control vector (YEplac181) or high-copy DGK1 (pCB1346), osh4Δ Δ-s-tether cells suppressed with high-copy DGK1 (CBY6506), all expressing DsRed-HDEL (pRS416-DsRed-HDEL).
Cells were cultured in synthetic growth medium at 30°C. Arrowheads indicate examples of cortical ER association with the PM. (B) Ratios of the total length of cortical DsRed-HDEL fluorescence (cER) per PM in WT, Δ-s-tether, and osh4Δ Δ-s-tether cells with or without high-copy 2μ DGK1 as indicated (n = 20 cells; statistical significance shown for Δ-s-tether versus Δ-s-tether and osh4Δ Δ-s-tether cells transformed with high-copy DGK1; ***p ≤ 3 x 10⁻⁷). Box and whisker plots and statistics as described in Fig 1. (C) Relative to WT, mRNA levels of OPI1, INO1, INO2 and INO4 in osh4-1ts Δ-s-tether (CBY6031) cells transformed with the vector (- DGK1) or high-copy DGK1 (+ DGK1) cultured at 37°C for 1 h.

References

    1. West M, Zurek N, Hoenger A, Voeltz GK. A 3D analysis of yeast ER structure reveals how ER domains are organized by membrane curvature. J Cell Biol. 2011;193(2):333–46. doi: 10.1083/jcb.201011039 . - DOI - PMC - PubMed
    1. Manford AG, Stefan CJ, Yuan HL, Macgurn JA, Emr SD. ER-to-plasma membrane tethering proteins regulate cell signaling and ER morphology. Dev Cell. 2012;23(6):1129–40. doi: 10.1016/j.devcel.2012.11.004 . - DOI - PubMed
    1. Quon E, Sere YY, Chauhan N, Johansen J, Sullivan DP, Dittman JS, et al.. Endoplasmic reticulum-plasma membrane contact sites integrate sterol and phospholipid regulation. PLoS Biol. 2018;16(5):e2003864. doi: 10.1371/journal.pbio.2003864 . - DOI - PMC - PubMed
    1. Loewen CJ, Young BP, Tavassoli S, Levine TP. Inheritance of cortical ER in yeast is required for normal septin organization. J Cell Biol. 2007;179(3):467–83. doi: 10.1083/jcb.200708205 . - DOI - PMC - PubMed
    1. Toulmay A, Prinz WA. A conserved membrane-binding domain targets proteins to organelle contact sites. J Cell Sci. 2012;125:49–58. doi: 10.1242/jcs.085118 . - DOI - PMC - PubMed

Publication types

MeSH terms

LinkOut - more resources