. 2022 Mar 3;18(3):e1010024.
doi: 10.1371/journal.pgen.1010024. eCollection 2022 Mar.

Transposable element landscapes in aging Drosophila

Affiliations

Transposable element landscapes in aging Drosophila

Nachen Yang et al. PLoS Genet. .

Abstract

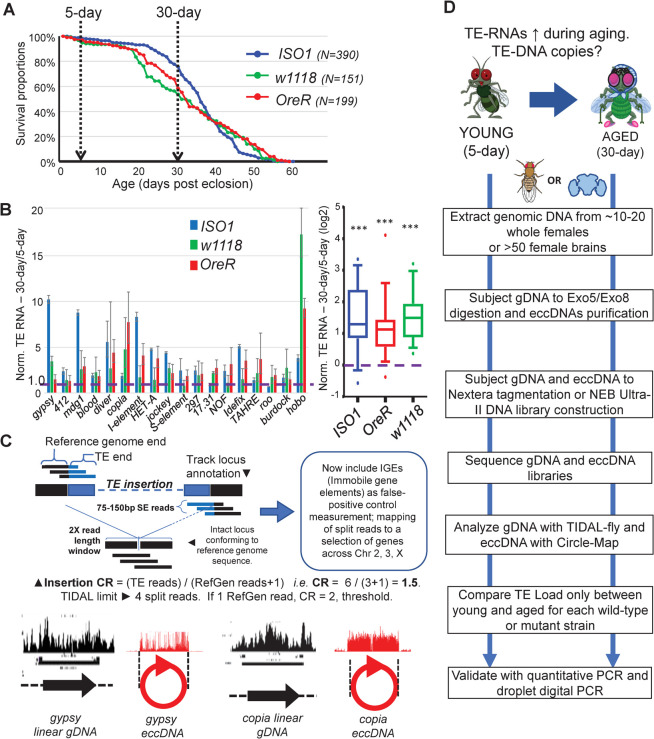
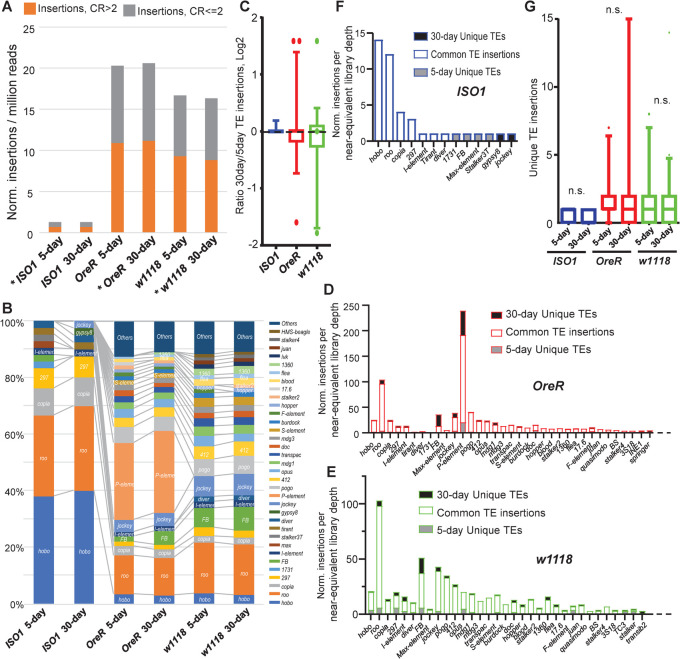
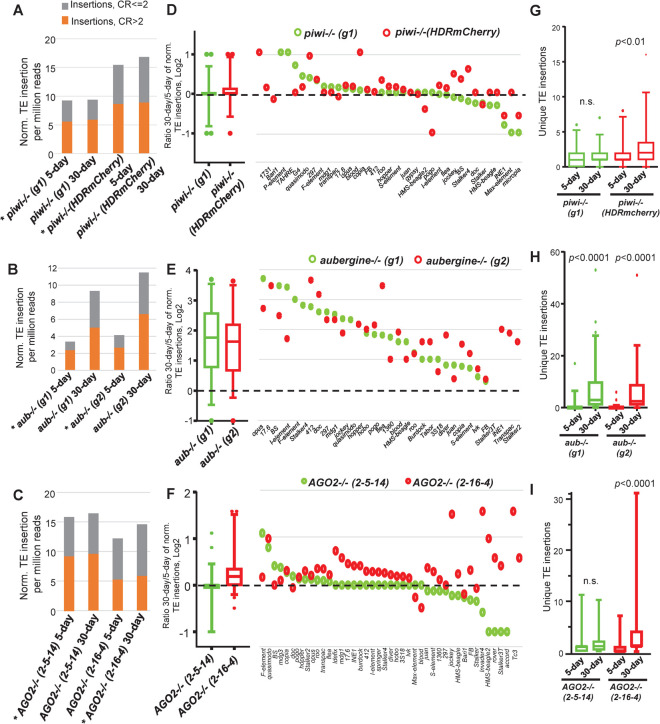
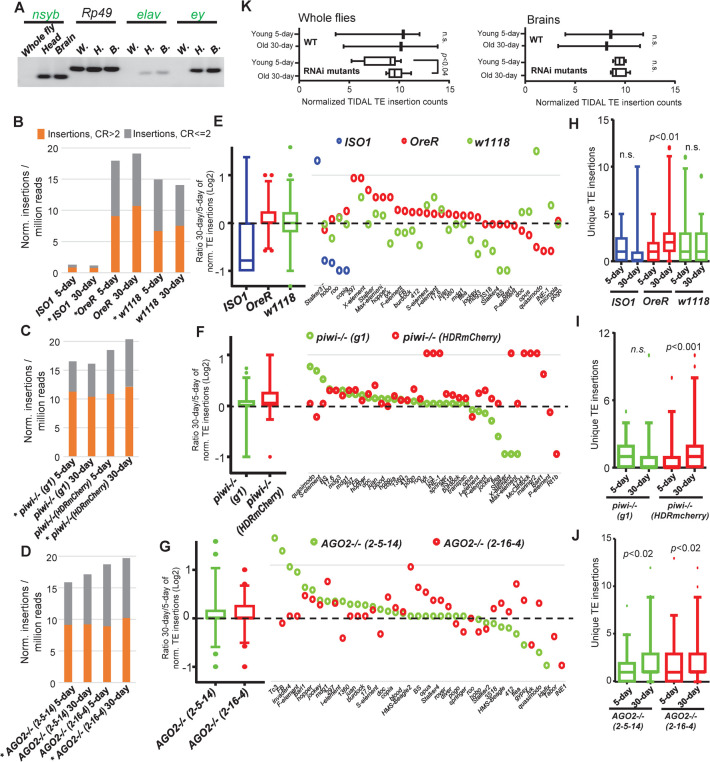
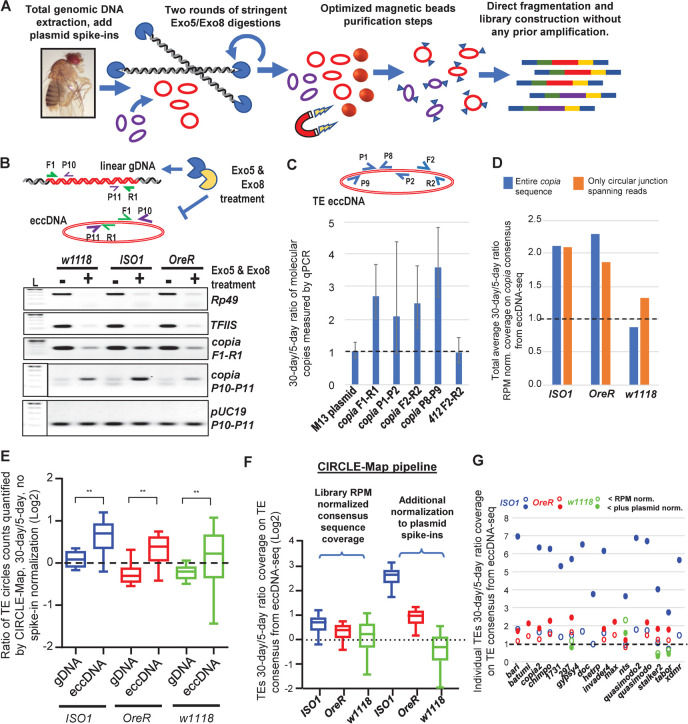
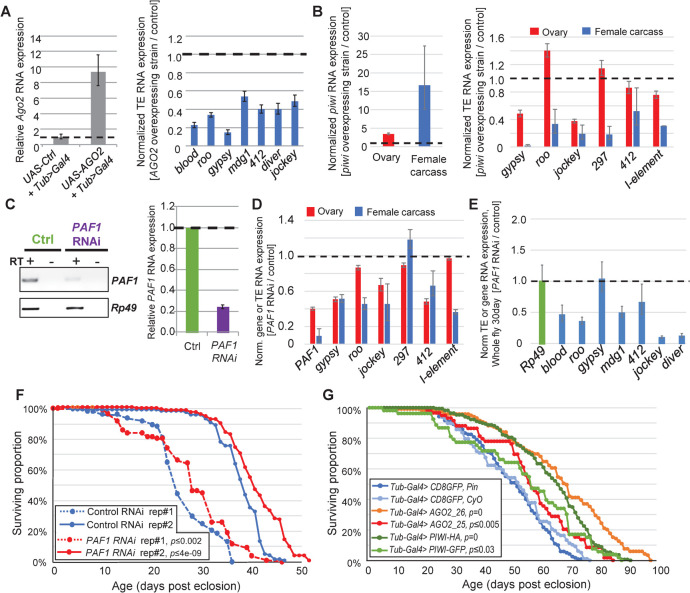
Genetic mechanisms that repress transposable elements (TEs) in young animals decline during aging, as reflected by increased TE expression in aged animals. Does increased TE expression during aging lead to more genomic TE copies in older animals? To address this question, we quantified TE Landscapes (TLs) via whole genome sequencing of young and aged Drosophila strains of wild-type and mutant backgrounds. We quantified TLs in whole flies and dissected brains and validated the feasibility of our approach in detecting new TE insertions in aging Drosophila genomes when small RNA and RNA interference (RNAi) pathways are compromised. We also describe improved sequencing methods to quantify extra-chromosomal DNA circles (eccDNAs) in Drosophila as an additional source of TE copies that accumulate during aging. Lastly, to combat the natural progression of aging-associated TE expression, we show that knocking down PAF1, a conserved transcription elongation factor that antagonizes RNAi pathways, may bolster suppression of TEs during aging and extend lifespan. Our study suggests that in addition to a possible influence by different genetic backgrounds, small RNA and RNAi mechanisms may mitigate genomic TL expansion despite the increase in TE transcripts during aging.


Conflict of interest statement

The authors have declared that no competing interests exist.

Figures

Fig 1
Fig 1. Overview of study to examine whether TE-DNA copy numbers change during fly aging.
(A) Survival curves of the three wild-type (WT) fly strains carried out in this study, indicating the selection of 30-day adults as a representative timepoint of aging onset (B) Validation of TE transcript expression increases during fly aging through RT-qPCR of TE RNAs normalized to Rp49 transcripts from whole female fly bodies. Error bars are propagated standard deviations of delta-CT values from three replicates. Boxplot on the right summarizes the data on the left plot and tests the statistical significance of TE RNA up-regulation by the Wilcoxon test in all three WT strains, p-value<0.0001. (C) Overview of TE detection strategy from Whole Genome Sequencing (WGS) data using updated TIDAL and extra-chromosomal circular DNA (eccDNAs) detection scripts. The coverage plots for WGS and eccDNA data are illustrated in black diagrams and red diagrams, respectively. (D) Study designed for comparing TE load between 5-day young and 30-day aged flies within each WT and mutant strain.
Fig 2
Fig 2. WGS analysis of TE insertion numbers between 5-day young versus 30-day aged wild-type fly strains.
(A) Quantification of new TE insertions as compared to the reference genome using the TIDAL-fly program. Categories of total TE insertions broken by the Coverage Ratios (CR) of CR>2 and CR< = 2. (B) Within each strain, TE families’ percentages are ordered by the color legend. (C) Ratios of the 30-day versus 5-day of normalized TE insertions from panels D-F. (D-F) Number of unique TE insertions (filled bars) present in 5-day and 30-day relative to common insertions present in both samples (open bar) of OreR, w1118 and ISO1 fly strains. These panels display only the TE families that were detected by TIDAL be at least 1% of total number of TE families (i.e. all the TEs not lumped into the “Others” category of Fig 2B). (G) Boxplot for conducting paired Wilcoxon tests does not show statistical significance for the gain of unique TE insertions in aging WT flies. n.s. = not statistically significant.
Fig 3
Fig 3. WGS analysis of TE insertion numbers between 5-day young versus 30-day aged RNAi mutant fly strains.
(A-C) Quantification of new TE insertions as compared to the reference genome using the TIDAL program. Categories of total TE insertions broken by the coverage ratios (CR) of CR>2 and CR< = 2. Asterisks mark the library that was downsampled to the equivalent depth of the cognate comparison library. (D-F) Left, 5–95 percentile boxplots of ratios of the 30-day versus 5-day of normalized TE insertions from panels A-C. Right, dot plots display only the TE families with significant changes between the two timepoints in at least one of the mutant strains. (G-I) Boxplots for conducting paired Wilcoxon tests for statistical significance in the gain of unique TE insertions in aging RNAi mutant flies. p-value from Wilcoxon tests, n.s. = not statistically significant.
Fig 4
Fig 4. Aging-associated TE landscapes in fly brains of WT and RNAi mutant strains.
(A) Validation of fly brain dissections by RT-PCR of brain-specific gene expression. TIDAL analysis of WGS for new TE insertions in the brains of (B) Wild-type (WT) strains, (C) piwi mutants, and (D) AGO2 mutants. The bar graphs on the left represent categories of total TE insertions broken by the coverage ratios (CR) of CR>2 and CR< = 2. Asterisks mark the library that was downsampled to the equivalent depth of the cognate comparison library. (E-G) Left, 5–95 percentile boxplots of ratios of the 30-day versus 5-day of normalized TE insertions from panels B-D. Right dot plots display only the TE families with significant changes between the two timepoints in at least one of the mutant strains. (H-J) Boxplots for conducting paired Wilcoxon tests for statistical significance in the gain of unique TE insertions in aging RNAi mutant fly brains. (K) Boxplots of the grouped differences of paired TE insertion counts between 30-day versus 5-day amongst whole flies and fly brain WGS libraries between WT and RNAi mutants. p-value from a one-tailed Wilcoxon rank-sum tests, n.s. = not statistically significant. Details of the samples and values in used to build these plots are in S1 Table, which only include the newer CRISPR/genome edited mutants versus the wild-type strains, as discussed in the main figures and discussion.
Fig 5
Fig 5. Aging Drosophila display increases in TEs existing as extra-chromosomal circular DNA (eccDNA).
(A) Diagram of methodology to enrich and purify eccDNAs for direct library construction and sequencing without requiring prior amplification. (B) Genomic PCR from WT flies demonstrating the depletion of linear gDNA and enrichment of eccDNA with TE sequences during exonucleases treatments. The diagram above explains configuration of PCR primers. L = DNA ladder. (C) qPCR validation of spike-in plasmids and copia eccDNA after exonucleases treatments of ISO1 gDNA from young versus aged adult flies. The diagram above explains the configuration of PCR primers. (D) Ratio of the read coverage just across the copia consensus sequence comparing young versus aged flies. (E) Comparison of the ratios of 30-day to 5-day CIRCLE-Map counts of TE circles between total gDNA libraries and eccDNA-enriched libraries without plasmid spike-in normalization. (F) Box plots of 30-day/5-day ratios of read coverage for eccDNA TE sequences rated by the CIRCLE-Map pipeline with a positive “circle score” [79] comparing to additional normalization to plasmid spike in. (G) Dot graph highlighting specific TE eccDNAs whose 30-day/5-day sequencing ratios are normalized to library RPMs (outlined dots) and to the plasmid spike-ins (filled-in dots) from a subset of (F) for TE families that had significant “circle score” >50.
Fig 6
Fig 6. Genetic interventions of TE expression in adult Drosophila.
(A) Overexpressing AGO2 [UAS-HA-AGO2/Tub>Gal4] and (B) overexpressing PIWI [UAS-3X-HA piwi/+; Tub>Gal4/+] results in a reduction of TE RNA expression in 5-day young adult Drosophila. Left graphs confirm gene overexpression and right graphs detail TE RNA expression measured by RT-qPCR of the target gene compared to the Rp49 housekeeping gene and with error bars representing propagated standard deviation of triplicate measurements. (C) Adult-specific knockdown of PAF1 in 5-day young females qualitatively assessed in the gel (left) and RT-qPCR (middle), which reduces TE RNA expression (right) using Tub>Gal4; PAF1 RNAi. Examining the effect of TE RNA reduction in the PAF1 knockdown in the ovary and carcass of 5-day flies (D) and 30-day whole flies (E). (F) Life span comparison between control versus PAF1 RNAi knockdown of adult female flies upon raising them at 29°C to release the Gal80ts inhibitor to induce RNAi from the Tub>GAL4. PAF1 RNAi N = 112,119, Control RNAi N = 170,153, rep#1 and rep#2, respectively. (G) Life span comparison between strains overexpressing AGO2 and PIWI and control strains CD8GFP. AGO2_25, N = 119, AGO2_26, N = 59, PIWI-HA, N = 169, PIWI-GFP, n = 53, CD8GFP/+,CyO/+, n = 98, CD8GFP/+,Pin/+, N = 120. p-values are from the log rank test calculated with the Oasis tool [123].

References

    1. Smith JJ, Timoshevskaya N, Timoshevskiy VA, Keinath MC, Hardy D, Voss SR. A chromosome-scale assembly of the axolotl genome. Genome research. 2019;29(2):317–24. Epub 2019/01/27. doi: 10.1101/gr.241901.118 ; PubMed Central PMCID: PMC6360810. - DOI - PMC - PubMed
    1. Nowoshilow S, Schloissnig S, Fei JF, Dahl A, Pang AWC, Pippel M, et al.. The axolotl genome and the evolution of key tissue formation regulators. Nature. 2018;554(7690):50–5. Epub 2018/01/25. doi: 10.1038/nature25458 . - DOI - PubMed
    1. Lander ES, Linton LM, Birren B, Nusbaum C, Zody MC, Baldwin J, et al.. Initial sequencing and analysis of the human genome. Nature. 2001;409(6822):860–921. doi: 10.1038/35057062 . - DOI - PubMed
    1. Adams MD, Celniker SE, Holt RA, Evans CA, Gocayne JD, Amanatides PG, et al.. The genome sequence of Drosophila melanogaster. Science. 2000;287(5461):2185–95. doi: 10.1126/science.287.5461.2185 . - DOI - PubMed
    1. Kaminker JS, Bergman CM, Kronmiller B, Carlson J, Svirskas R, Patel S, et al.. The transposable elements of the Drosophila melanogaster euchromatin: a genomics perspective. Genome biology. 2002;3(12):RESEARCH0084. doi: 10.1186/gb-2002-3-12-research0084 ; PubMed Central PMCID: PMC151186. - DOI - PMC - PubMed

Publication types

LinkOut - more resources