. 2022 Mar 3;18(3):e1010091.
doi: 10.1371/journal.pgen.1010091. eCollection 2022 Mar.

Co-transmission of neuropeptides and monoamines choreograph the C. elegans escape response

Affiliations

Co-transmission of neuropeptides and monoamines choreograph the C. elegans escape response

Jeremy T Florman et al. PLoS Genet. .

Abstract

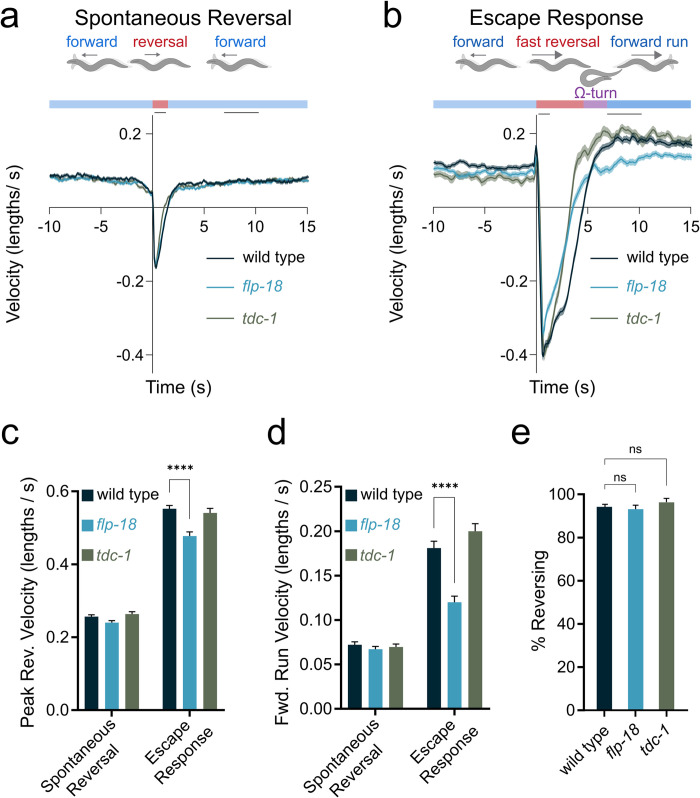
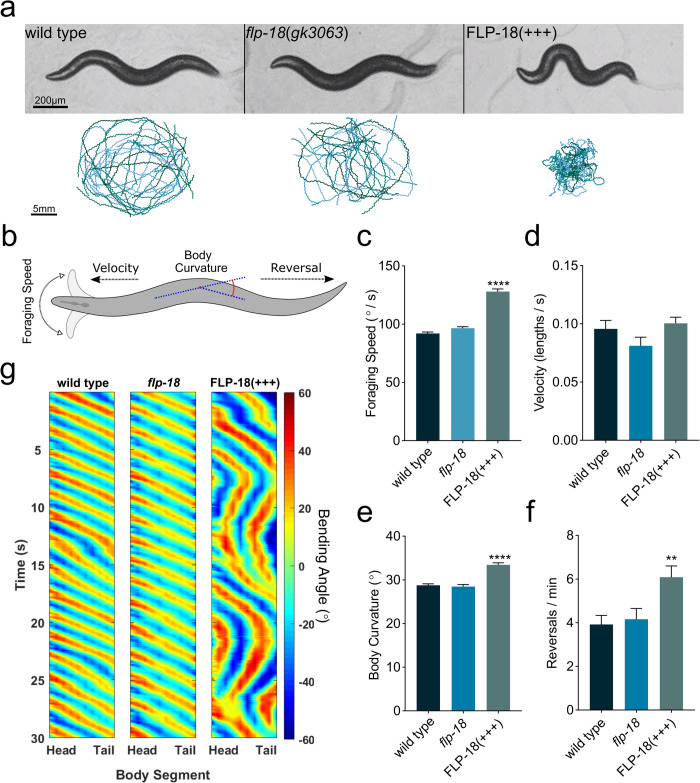
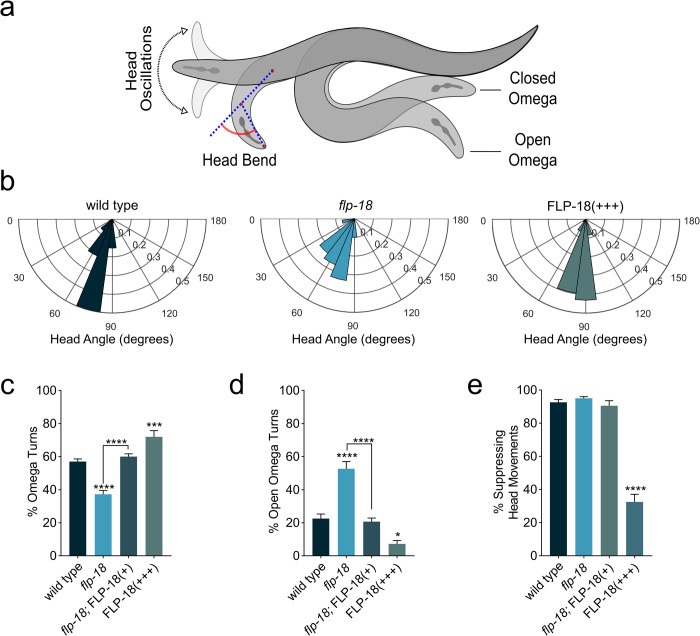
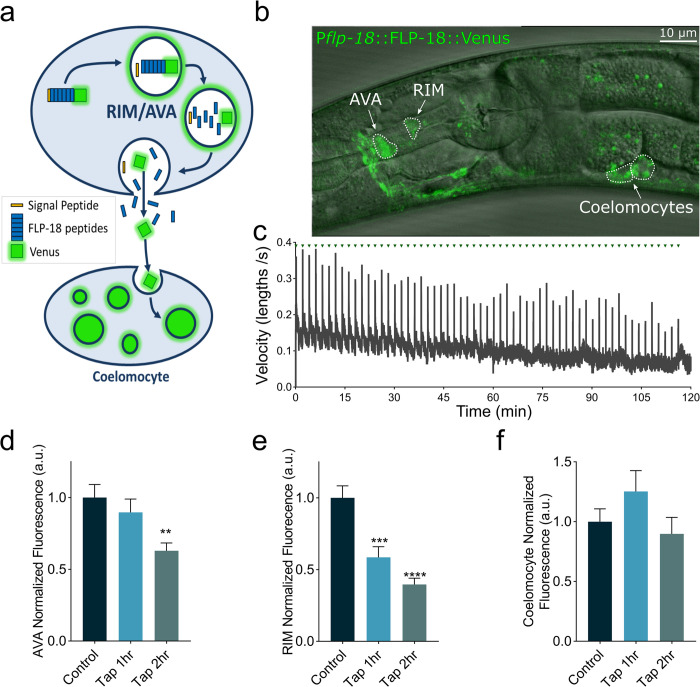
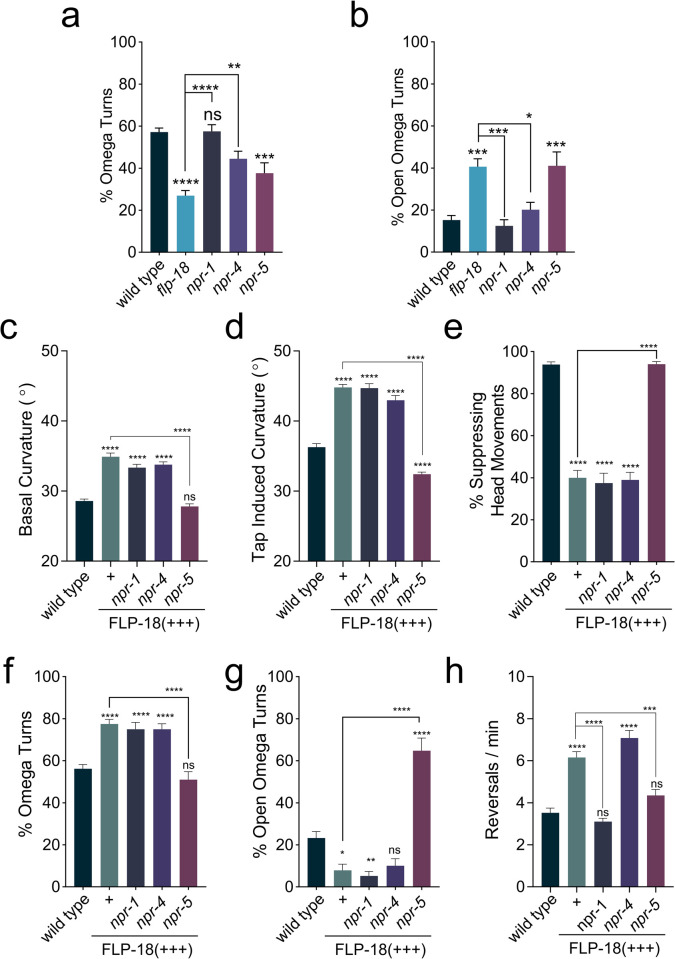
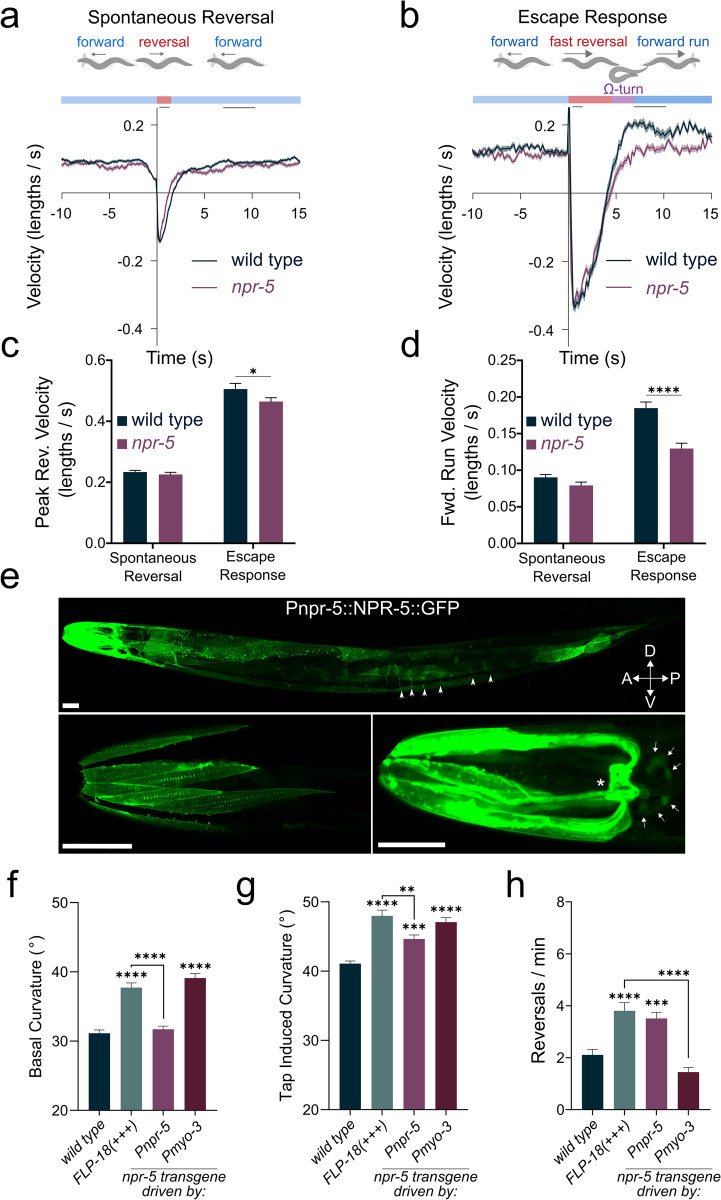
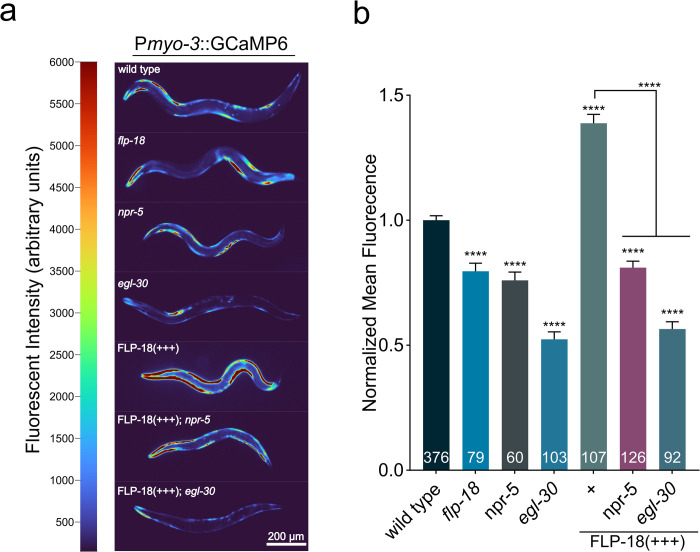
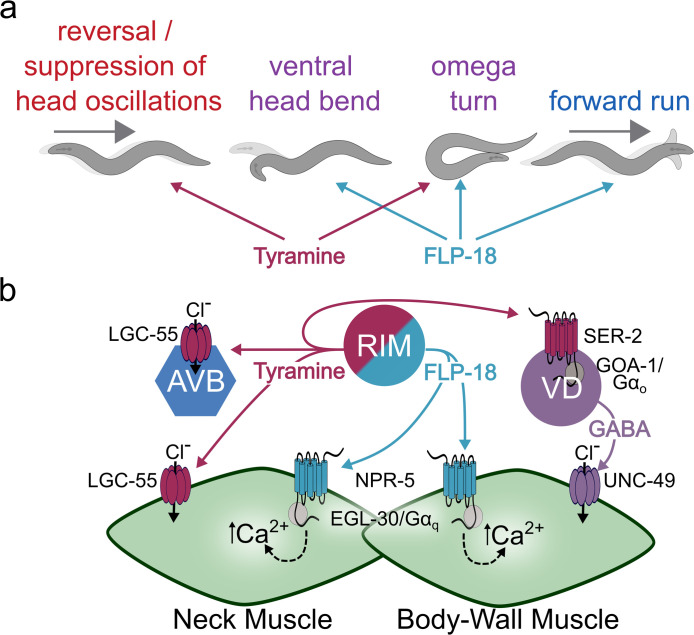
Co-localization and co-transmission of neurotransmitters and neuropeptides is a core property of neural signaling across species. While co-transmission can increase the flexibility of cellular communication, understanding the functional impact on neural dynamics and behavior remains a major challenge. Here we examine the role of neuropeptide/monoamine co-transmission in the orchestration of the C. elegans escape response. The tyraminergic RIM neurons, which coordinate distinct motor programs of the escape response, also co-express the neuropeptide encoding gene flp-18. We find that in response to a mechanical stimulus, flp-18 mutants have defects in locomotory arousal and head bending that facilitate the omega turn. We show that the induction of the escape response leads to the release of FLP-18 neuropeptides. FLP-18 modulates the escape response through the activation of the G-protein coupled receptor NPR-5. FLP-18 increases intracellular calcium levels in neck and body wall muscles to promote body bending. Our results show that FLP-18 and tyramine act in different tissues in both a complementary and antagonistic manner to control distinct motor programs during different phases of the C. elegans flight response. Our study reveals basic principles by which co-transmission of monoamines and neuropeptides orchestrate in arousal and behavior in response to stress.


Conflict of interest statement

The authors have declared that no competing interests exist.

Figures

Fig 1
Fig 1. Increase in locomotion speed following a mechanical stimulus.
Backward- and forward-velocity upon a spontaneous or tap-induced reversal. Wild-type animals show a persistent increase in locomotion speed in response to a strong tap stimulus (“forward run”). flp-18 mutants do not show a robust increase locomotion speed in response to a strong tap stimulus. (A-B) Schematic illustrating behavioral sequence (top) and velocity traces (bottom) from wild type animals, flp-18, and tdc-1 mutants, aligned to reversal events. Negative velocity indicates backward locomotion. Dark lines represent mean velocity and shaded region represents standard error. Black lines at the top of the graph indicate the time periods when reversal and forward run speed were quantified. Reversals were spontaneous (A) or induced by a tap stimulus (B). (C) Peak backward velocity during the reversal phase was quantified by identifying the maximum backward locomotion rate for each animal during a 1 second period following the tap. (D) Forward run velocity was quantified as the average speed for each animal during the time period between 7 to 10 seconds following the tap. (E) Quantification of the percentage of animals initiating a reversal within 1 second after a tap was delivered. Graphs represent mean ± SEM, significance was calculated using ANOVA with Šidák’s (C and D) and Dunnett’s (E) multiple comparison test (P> 0.05 = ns, P<0.005 = **, P<0.0001 = ****). Sample sizes: Spontaneous reversals and escape response (A-D), (n = # animals). Spontaneous (A, C, and D): wild type (n = 506), flp-18 (n = 512), tdc-1 (n = 512). Escape (b-d): wild type (n = 275), flp-18 (n = 208), tdc-1 (n = 124). % Reversing (E), (n = # of experiments, 20 worms per experiment): wild type (n = 30), flp-18 (n = 23), tdc-1 (n = 11).
Fig 2
Fig 2. Overexpression of FLP-18 causes locomotion defects.
(A) Behavioral tracking of wild type, flp-18(gk3063) mutants, and transgenic animals that overexpress FLP-18 (FLP-18(+++)). Representative images of each genotype (upper panel) and locomotion tracks recorded from multiple animals freely moving on a plate for 5 min (lower panel). Scale bars represent 200 μm (top) and 5 mm (bottom). (B) Schematic illustrating quantified behaviors. (C-F) Quantification of locomotion behavior. (C) Speed of foraging head movements. (D) locomotion velocity. (E) Body bend curvature. (F) Spontaneous reversal frequency. (G) Kymographs showing body bending along the body over 30 s of locomotion. Color map represents degrees of bending, positive values represent dorsal bends and negative values represent ventral bends. Graphs represent mean ± SEM, significance was calculated using ANOVA with Dunnett’s multiple comparison test (P<0.005 = **, P<0.0001 = ****). Sample sizes: (C), wild type (n = 38), flp-18 (n = 28), FLP-18(+++) (n = 31). (D-F) wild type, flp-18, and FLP-18(+++) (n = 16 experiments per genotype, 20 animals per experiment).
Fig 3
Fig 3. flp-18 mutants are defective in head bending and turning during the escape response.
(A) Schematic depicting head oscillations, ventral turn head angle and open vs closed omega turns. (B) Angle of ventral head bend following touch induced reversal of animals that make omega turns (probability histogram with a bin size of 15°). Each concentric circle represents a probability of 0.1. (C-D) Quantification of omega turning behavior. (C) Percentage of animals that execute omega turns in response to gentle anterior touch. (D) Fraction of open omega turns out of total omega turns. (E) Quantification of the percentage of animals suppressing head oscillations upon gentle anterior touch. Mean ± SEM. significance was calculated using ANOVA with Šidák’s multiple comparison correction (P<0.05 = *, P<0.0005 = ***, P<0.0001 = ****). Sample sizes: Ventral head bend measurement (B) (n = # of animals), wild type (n = 52), flp-18 (n = 30), FLP-18(+++) (n = 58). Suppression of head movement and omega quantification (C-E) (n = # of experiments, 20 worms per experiment) wild type (n = 17), flp-18 (n = 16), flp-18; FLP-18(+) (n = 9), FLP-18(+++) (n = 10).
Fig 4
Fig 4. The escape response stimulates FLP-18 release from the AVA and RIM.
Animals expressing a FLP-18::Venus fusion protein were subjected to repeated mechanical plate taps. The decrease in fluorescent intensity of the RIM and AVA cell bodies and the anterior-most coelomocyte were quantified as a readout of FLP-18 release. (A) Schematic illustrating the processing and exocytosis of the FLP-18::Venus fusion protein. (B) Representative image showing an animal expressing FLP-18::Venus, DIC and GFP overlay. Scale bar represents 10 μm. (C) Average velocity of a population of animals as they are subjected to mechanical plate taps. Green arrows indicate the delivery of a tap every 2 min. The spikes in velocity coincide with the initiation of the escape response (D-E) Quantification of fluorescence (arbitrary units–a.u.) in the AVA (D), RIM (E), and coelomocytes (F), at 0-, 1- and 2-hour time points. Graphs represent mean ± SEM, significance was calculated using ANOVA with Dunnett’s multiple comparison test (P<0.005 = **, P<0.0005 = ***, P<0.0001 = ****). Sample size: (C) n = 3 replicates, >30 animals per replicate. (D-F) Control (n = 32), Tap 1 hr. (n = 26), Tap 2 hr. (n = 35).
Fig 5
Fig 5. Loss of npr-5 impedes omega turning and suppresses FLP-18 overexpression phenotypes.
Overexpression of FLP-18 causes uncoordinated locomotion, frequent reversals, and excessive bending, which is suppressed in an npr-5 mutant background. (A-B) Quantification of omega turning behavior. (A) Percentage of animals that execute omega turns in response to gentle anterior touch. (B) Fraction of open omega turns out of total omega turns. (C and D) Mean body curvature averaged over 5 seconds prior to a tap stimulus (C) or immediately following a strong tap stimulus (D). (E) Percentage of animals suppressing head movements in response to gentle anterior touch with an eyelash. (F and G) Omega turning behavior in FLP-18 overexpressors. (F) Percentage of animals initiating omega turns after gentle anterior touch. (G) Proportion of open omega turns out of total omega turns. (H) Mean number of spontaneous reversals per minute per worm averaged over 3 minutes. Graphs represent mean ± SEM, significance was calculated using ANOVA with Šidák’s multiple comparison correction (P> 0.05 = ns, P<0.05 = *, P<0.005 = **, P<0.0005 = ***, P<0.0001 = ****). Sample sizes (n = # of experiments, 20 animals per experiment): Omega turn quantification (A and B) wild type (n = 21), flp-18 (n = 21), npr-1 (n = 12), npr-4 (n = 14), npr-5 (n = 21). Curvature and reversal measurements (C, D, and H) wild type (n = 46), FLP-18(+++) (n = 33), npr-1; FLP-18(+++) (n = 23), npr-4; FLP-18(+++) (n = 27), npr-5; FLP-18(+++) (n = 23). Suppression of head movements and omega turn quantification (E-G) wild type (n = 22), FLP-18(+++) (n = 10), npr-1; FLP-18(+++) (n = 12), npr-4; FLP-18(+++) (n = 10), npr-5; FLP-18(+++) (n = 10).
Fig 6
Fig 6. npr-5 mutants have defects in forward run speed, body bending and reversal frequency.
(A-B) Schematic illustrating behavioral sequence (top) and velocity traces (bottom) from wild type and npr-5 mutants aligned to reversal events, backward locomotion is negative. Dark lines represent mean velocity and shaded region represents standard error. Reversals were spontaneous (A) or induced by a tap stimulus (B). (C) Peak reversal velocity during the first second following the tap stimulus. (D) Mean locomotion velocity during the forward run phase (t = 7-10s). (E) Confocal images of animals expressing an NPR-5::GFP translational fusion protein: zfEx852 [Pnpr-5::NPR-5::GFP]. Upper panel: Z-projection shows strongest expression in head- and neck-muscles and muscle arms. NPR-5::GFP localizes to body-wall and vulval muscle. Body wall muscle arms are visible (arrow heads). Lower left panel: confocal slice showing NPR-5::GFP localization to dense bodies in head muscle. Lower right panel: Z-projection showing high expression in head- and neck- muscle arms and in the muscle plate in the nerve ring (asterisk). Neuronal cell bodies that express NPR-5::GFP are indicated by arrows. Scale bars represent 25 μm. (F-H) Behavioral analysis of NPR-5 overexpression, either from its endogenous promoter (Pnpr-5) or from a muscle specific promoter (Pmyo-3). Mean body curvature averaged over 5 seconds prior to (F), or immediately following (G), a tap stimulus. (H) Quantification of spontaneous reversal frequency. Graphs represent mean ± SEM, significance was calculated using ANOVA with Šidák’s multiple comparison correction (P>0.05 = ns, P<0.005 = **, P<0.0005 = ***, P<0.0001 = ****). Sample sizes: (A-C) (n = # of animals), wild type (n = 512), npr-5 (n = 258). (F-H) (n = # of experiments, 20 animals per experiment). wild type (n = 20), FLP-18(+++) (n = 13), Pnpr-5::NPR-5 (n = 12), Pmyo-3::NPR-5 (n = 14).
Fig 7
Fig 7. FLP-18 increases muscle calcium levels and requires NPR-5 and EGL-30/Gαq.
(A) Loss of flp-18 or npr-5 reduces calcium transients in body wall muscle. FLP-18 overexpression causes a large increase in muscle GCaMP6 fluorescence, which is suppressed by loss of npr-5 or egl-30. Representative images of animals expressing a Pmyo-3::GCaMP6 transgene in different genetic backgrounds. Grayscale images have been recolored for visibility. Pixel intensity values (arbitrary units) and corresponding colormap are depicted in the color bar to the left of images. Scale bar represents 200 μm. (B) Quantification of mean GCaMP6 fluorescence in body wall muscle in different genetic backgrounds. Graphs represent mean ± SEM, significance was calculated using ANOVA with Šidák’s multiple comparison correction (P<0.0001 = ****). Sample size for each genotype is indicated at the base of each bar.
Fig 8
Fig 8. Model: FLP-18 / tyramine co-transmission in the choreography of escape behavior.
Schematic depicting the effects of tyramine and FLP-18 on behavior (A) and the underlying molecular pathway (B). Touch leads to the activation of the AVA (not pictured) and RIM neurons resulting in the release of FLP-18 and tyramine (RIM only) during the escape response. Tyramine activates LGC-55 chloride channels which hyperpolarize AVB neurons and neck muscle. Hyperpolarization of the AVB suppresses forward locomotion, indirectly increasing reversal length, while hyperpolarization of neck muscle leads to the suppression of head oscillations (SHO) during the reversal. Tyramine also activates the Gαo coupled SER-2 receptor in GABAergic VD motor neurons enhancing ventral bending during the omega turn. FLP-18 activates NPR-5 in neck and body wall muscle resulting in an EGL-30/Gαq mediated Ca2+ influx. FLP-18 antagonizes the effect of tyramine in neck muscles, facilitating the re-initiation of head movements following the omega turn. FLP-18 and tyramine act synergistically on divergent targets to orchestrate the omega turn. FLP-18 increases forward run velocity in an NPR-5 dependent manner. See text for details.

References

    1. Nusbaum MP, Blitz DM, Marder E. Functional consequences of neuropeptide and small-molecule co-transmission. Nat Rev Neurosci. 2017;18(7):389–403. doi: 10.1038/nrn.2017.56 - DOI - PMC - PubMed
    1. Svensson E, Apergis-Schoute J, Burnstock G, Nusbaum MP, Parker D, Schiöth HB. General principles of neuronal co-transmission: Insights from multiple model systems. Front Neural Circuits. 2019;12(January):1–28. doi: 10.3389/fncir.2018.00117 - DOI - PMC - PubMed
    1. Cannon WB. Bodily Changes in Pain, Hunger, Fear and Rage; An Account of Recent Researches into the Function of Emotional Excitement. NEW YORK AND LONDON D. APPLETON AND COMPANY; 1915.
    1. Horn JP, Swanson LW. Principles of Neural Science. 5th ed. Kandel ER, Schwartz JH, Jessell TM, Siegelbaum SA, Hudspeth AJ, editors. New York: McGraw Hill; 2013. doi: 10.1126/science.1239052 - DOI
    1. Li HY, Sawchenko PE. Hypothalamic effector neurons and extended circuitries activated in “neurogenic” stress: A comparison of footshock effects exerted acutely, chronically, and in animals with controlled glucocorticoid levels. J Comp Neurol. 1998;393(2):244–66. - PubMed

Publication types

MeSH terms