

Innovative computational approaches shed light on genetic mechanisms underlying cognitive impairment among children born extremely preterm
- PMID: 35240980
- PMCID: PMC8903548
- DOI: 10.1186/s11689-022-09429-x
Innovative computational approaches shed light on genetic mechanisms underlying cognitive impairment among children born extremely preterm
Abstract
Background: Although survival rates for infants born extremely preterm (gestation < 28 weeks) have improved significantly in recent decades, neurodevelopmental impairment remains a major concern. Children born extremely preterm remain at high risk for cognitive impairment from early childhood to adulthood. However, there is limited evidence on genetic factors associated with cognitive impairment in this population.
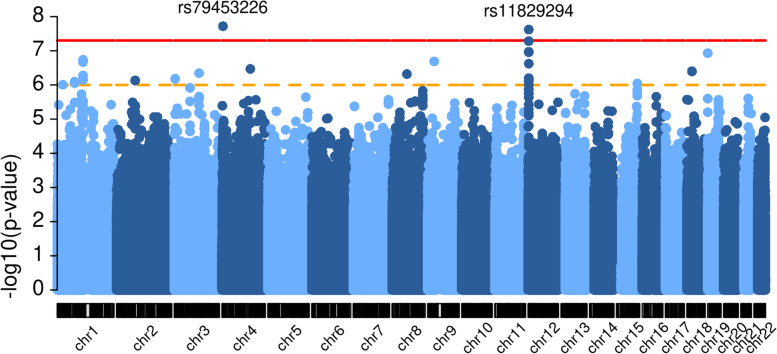
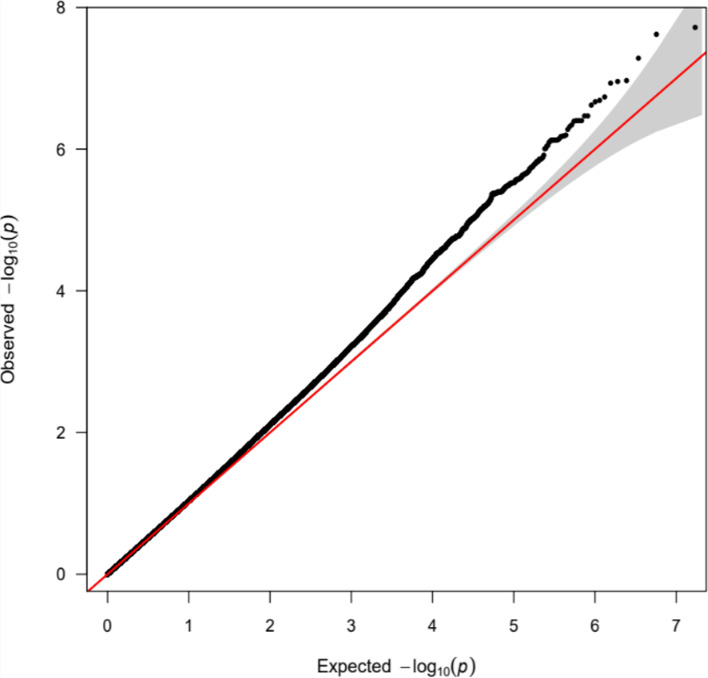
Methods: First, we used a latent profile analysis (LPA) approach to characterize neurocognitive function at age 10 for children born extremely preterm. Children were classified into two groups: (1) no or low cognitive impairment, and (2) moderate-to-severe cognitive impairment. Second, we performed TOPMed-based genotype imputation on samples with genotype array data (n = 528). Third, we then conducted a genome-wide association study (GWAS) for LPA-inferred cognitive impairment. Finally, computational analysis was conducted to explore potential mechanisms underlying the variant x LPA association.
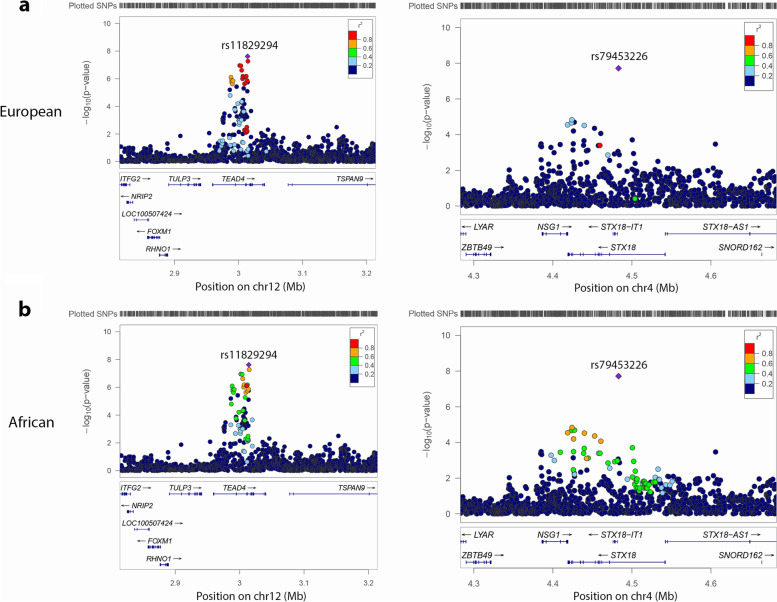
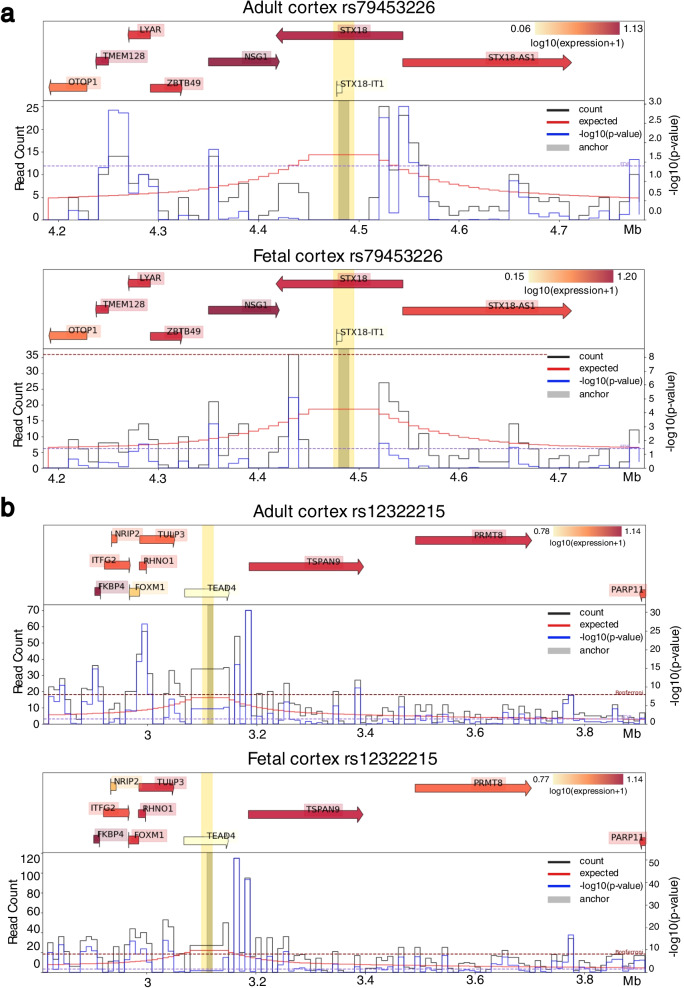
Results: We identified two loci reaching genome-wide significance (p value < 5e-8): TEA domain transcription factor 4 (TEAD4 at rs11829294, p value = 2.40e-8) and syntaxin 18 (STX18 at rs79453226, p value = 1.91e-8). Integrative analysis with brain expression quantitative trait loci (eQTL), chromatin conformation, and epigenomic annotations suggests tetraspanin 9 (TSPAN9) and protein arginine methyltransferase 8 (PRMT8) as potential functional genes underlying the GWAS signal at the TEAD4 locus.
Conclusions: We conducted a novel computational analysis by utilizing an LPA-inferred phenotype with genetics data for the first time. This study suggests that rs11829294 and its LD buddies have potential regulatory roles on genes that could impact neurocognitive impairment for extreme preterm born children.
Keywords: Cognitive impairment; Genetic mechanisms; Genome-wide association study (GWAS); Latent profile analysis (LPA); Neurodevelopment; Preterm children.
© 2022. The Author(s).
Conflict of interest statement
The authors declare no competing interests.
Figures
References
-
- Mathews TJ, Driscoll AK. Trends in Infant Mortality in the United States, 2005-2014. NCHS Data Brief. 2017. pp. 1–8. - PubMed
-
- Ding S, Lemyre B, Daboval T, Barrowman N, Moore GP. A meta-analysis of neurodevelopmental outcomes at 4-10 years in children born at 22-25 weeks gestation. Acta Paediatr. 2019;108:1237–1244. - PubMed
-
- Serenius F, Källén K, Blennow M, Ewald U, Fellman V, Holmström G, et al. Neurodevelopmental outcome in extremely preterm infants at 2.5 years after active perinatal care in Sweden. JAMA. 2013;309:1810–1820. - PubMed
Publication types
MeSH terms
Substances
Grants and funding
LinkOut - more resources
Full Text Sources
Research Materials
Miscellaneous
