. 2022 Apr 20;42(16):3365-3380.
doi: 10.1523/JNEUROSCI.2145-21.2022. Epub 2022 Mar 3.

A Computational Model of Direction Selectivity in Macaque V1 Cortex Based on Dynamic Differences between On and Off Pathways

Affiliations

A Computational Model of Direction Selectivity in Macaque V1 Cortex Based on Dynamic Differences between On and Off Pathways

Logan Chariker et al. J Neurosci. .

Abstract

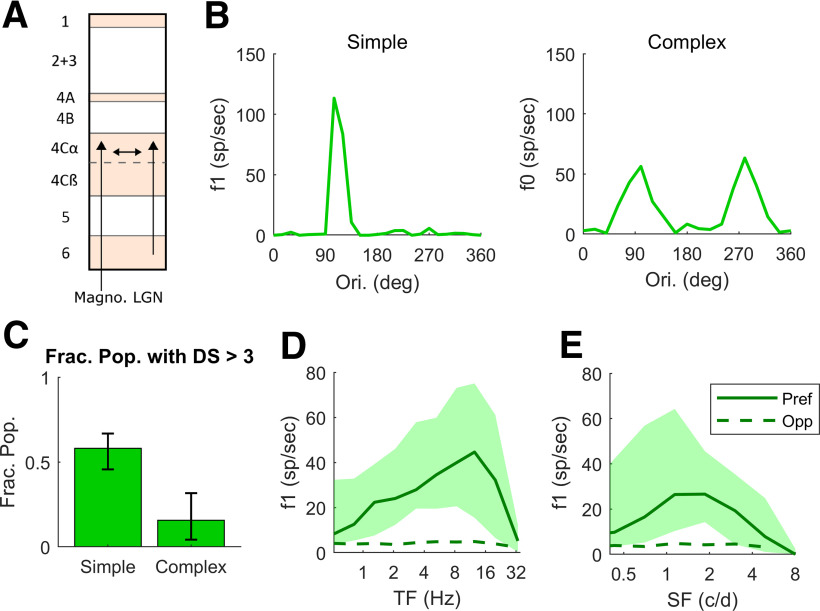
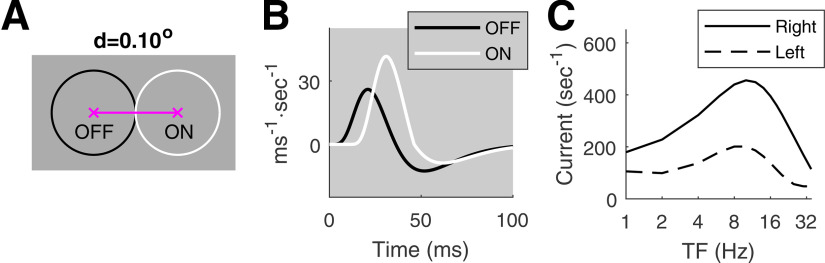
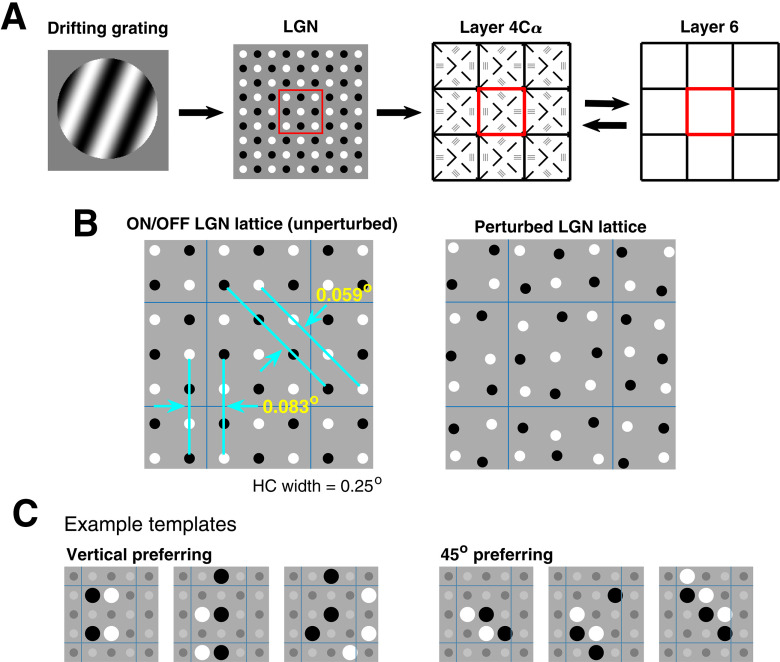
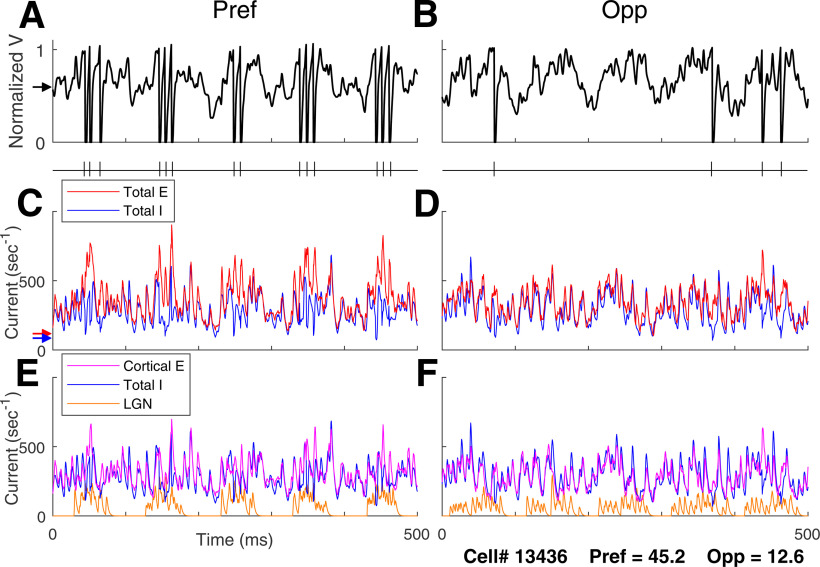
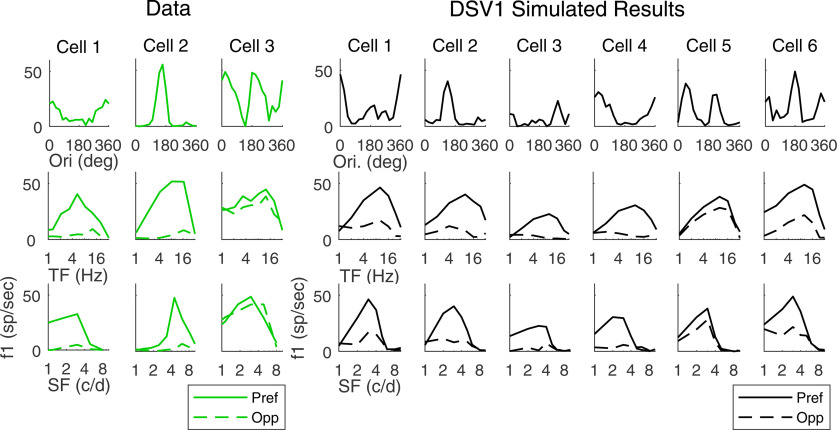
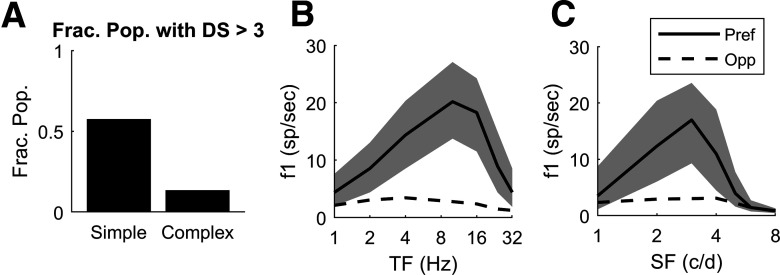
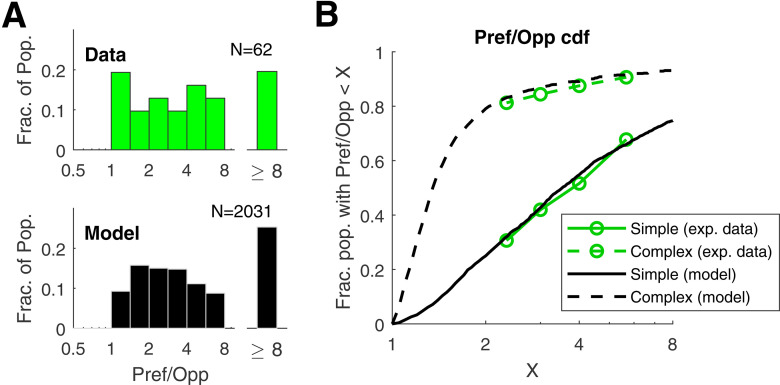
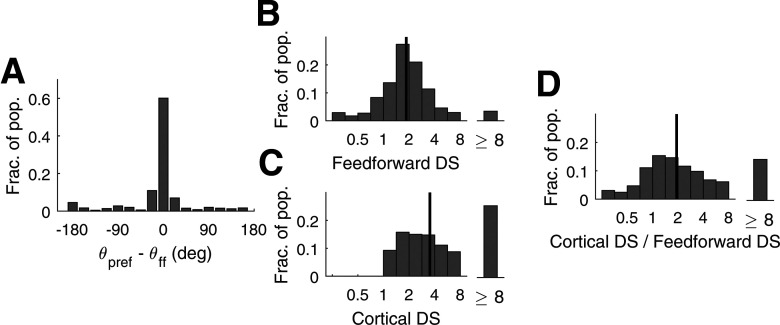
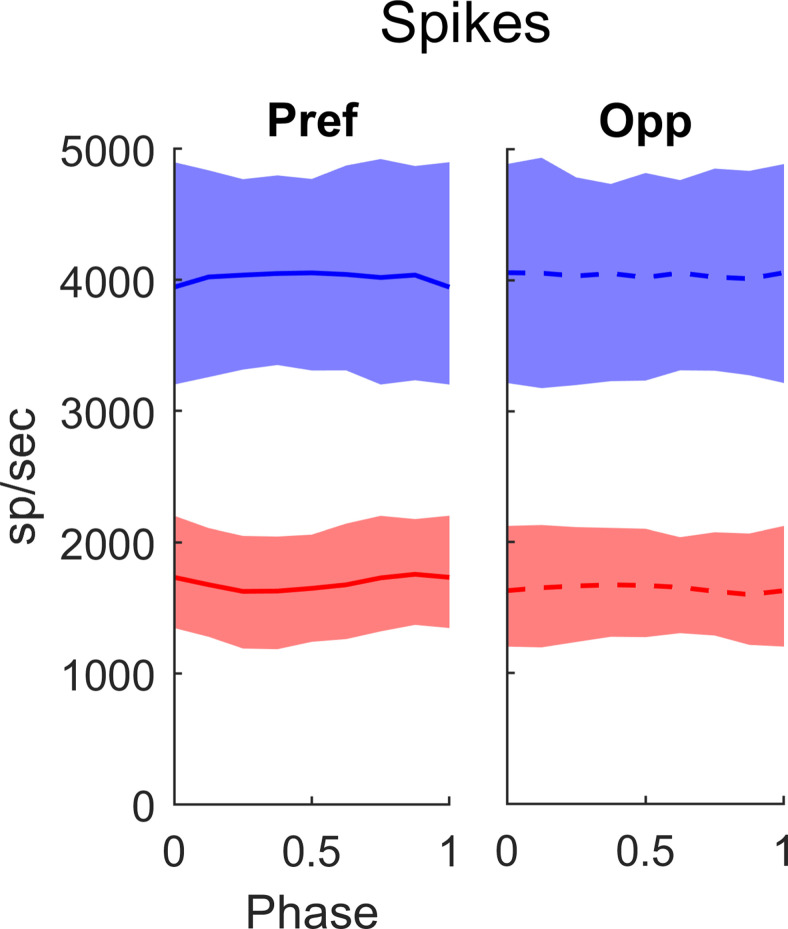
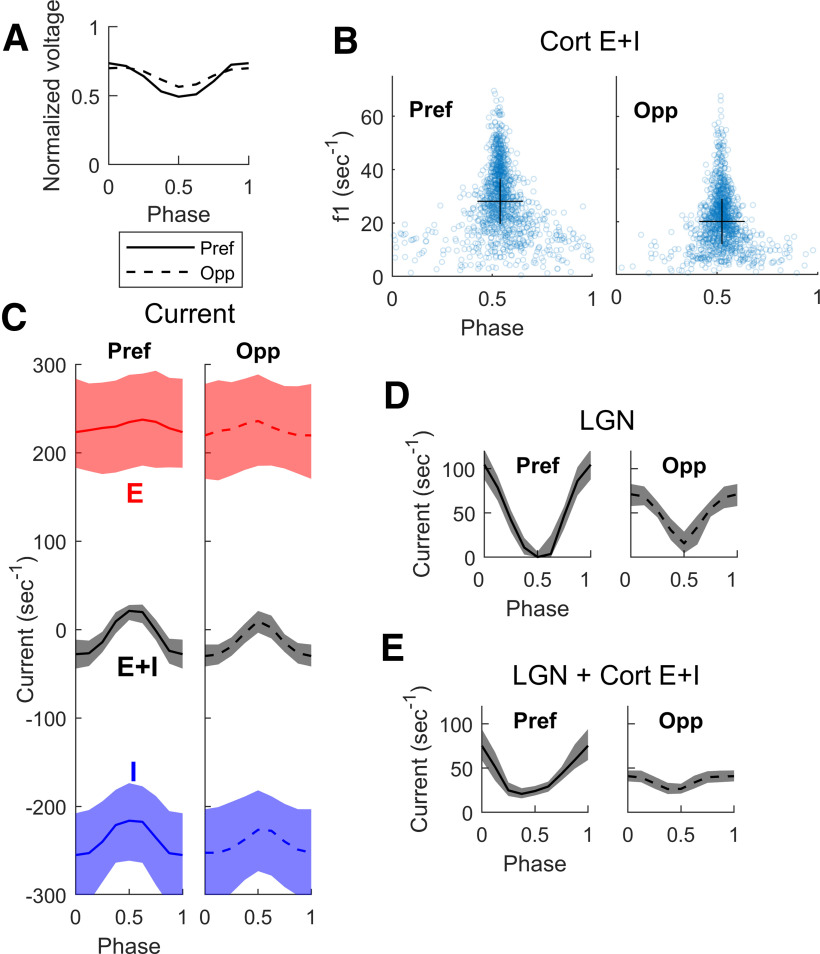
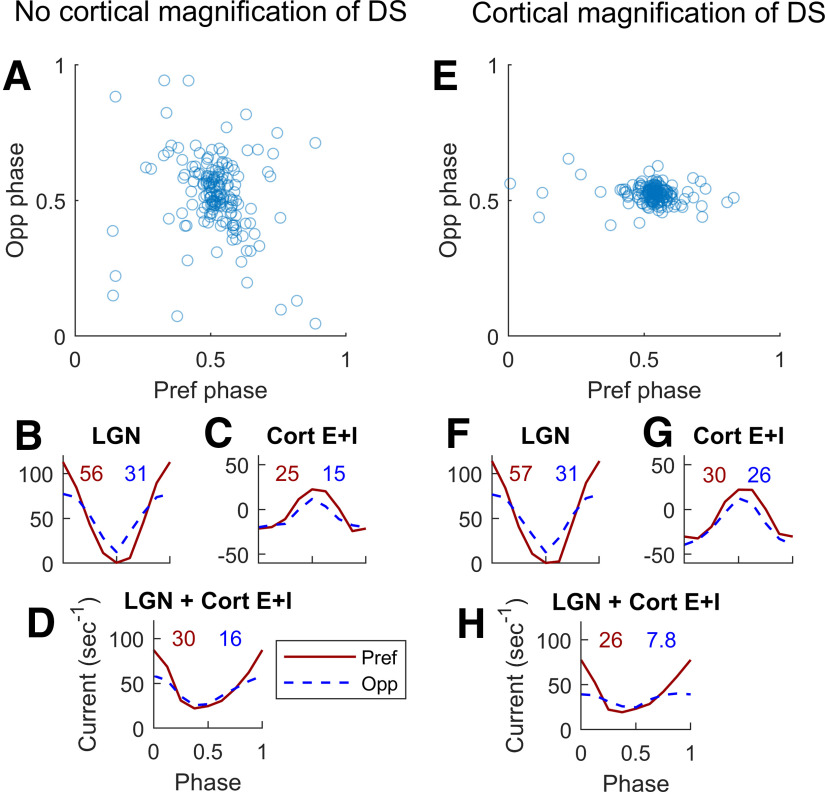
This paper is about neural mechanisms of direction selectivity (DS) in macaque primary visual cortex, V1. We present data (on male macaque) showing strong DS in a majority of simple cells in V1 layer 4Cα, the cortical layer that receives direct afferent input from the magnocellular division of the lateral geniculate nucleus (LGN). Magnocellular LGN cells are not direction-selective. To understand the mechanisms of DS, we built a large-scale, recurrent model of spiking neurons called DSV1. Like its predecessors, DSV1 reproduces many visual response properties of V1 cells including orientation selectivity. Two important new features of DSV1 are (1) DS is initiated by small, consistent dynamic differences in the visual responses of OFF and ON Magnocellular LGN cells, and (2) DS in the responses of most model simple cells is increased over those of their feedforward inputs; this increase is achieved through dynamic interaction of feedforward and intracortical synaptic currents without the use of intracortical direction-specific connections. The DSV1 model emulates experimental data in the following ways: (1) most 4Cα Simple cells were highly direction-selective but 4Cα Complex cells were not; (2) the preferred directions of the model's direction-selective Simple cells were invariant with spatial and temporal frequency (TF); (3) the distribution of the preferred/opposite ratio across the model's population of cells was very close to that found in experiments. The strong quantitative agreement between DS in data and in model simulations suggests that the neural mechanisms of DS in DSV1 may be similar to those in the real visual cortex.SIGNIFICANCE STATEMENT Motion perception is a vital part of our visual experience of the world. In monkeys, whose vision resembles that of humans, the neural computation of the direction of a moving target starts in the primary visual cortex, V1, in layer 4Cα that receives input from the eye through the lateral geniculate nucleus (LGN). How direction selectivity (DS) is generated in layer 4Cα is an outstanding unsolved problem in theoretical neuroscience. In this paper, we offer a solution based on plausible biological mechanisms. We present a new large-scale circuit model in which DS originates from slightly different LGN ON/OFF response time-courses and is enhanced in cortex without the need for direction-specific intracortical connections. The model's DS is in quantitative agreement with experiments.

Keywords: ON/OFF pathways; computational model; direction selectivity; mechanisms; motion perception; primary visual cortex.


Figures

Figure 1.
Figure 1.
Experimental Data on DS and firing rates as a function of TF and SF in macaque layer 4Cα. A, Diagram showing a cross section of the layers of V1, with arrows indicating the recurrent interaction within layer 4Cα, feedforward inputs to layer 4Cα from LGN and feedback to layer 4Cα from layer 6. All data in this figure are from cells recorded in layer 4Cα. B, Orientation tuning curves for a highly DS Simple cell and a non-DS Complex cell. C, Fraction of Simple and Complex cells with DS (= Pref/Opp) > 3. In our sample, 36 of 62 Simple cells and 5 of 32 Complex cells had DS > 3, with 95% confidence intervals. D, TF tuning curves of Pref and Opp firing rates in Simple Cells with DS > 3. The thick solid curve shows median Pref firing rate and dashed curve shows median Opp firing rate. Quartiles indicted by the shading around the median. E, SF tuning curves; same setup as in D. Note that the median rate here is lower because there is a range of preferred SF across the population therefore the median underestimates the median of the rate at the preferred SF.
Figure 2.
Figure 2.
Summed response from a pair of ON and OFF LGN cells (redrawn from Chariker et al., 2021). A, ON-OFF pair separated by do, with ON to the right of OFF; the circles represent 1 SD of the center Gaussian of each LGN receptive field. B, Relative to the OFF-kernel (black), the ON-kernel (white) has a 10-ms delay and is of type (1.6, 0.7; see Results, DSV1 model description). C, Right versus left responses (summed ON and OFF currents) as functions of TF, at SF = 2.5 c/d.
Figure 3.
Figure 3.
The DSV1 model and its LGN templates. A, General layout of the three components of the DSV1 model. The visual stimulus is represented by the drifting grating on the left. This information goes to the sheet of Magnocellular LGN cells. Each cell computes a response R(t) as described in Results. LGN outputs are then passed to layer 4Cα of V1, the primary input layer of the Magno stream. Layer 4Cα receives feedback from layer 6. B, LGN sheet showing ON-OFF separation distances: ON cells in white, OFF cells in black; square lattice unperturbed (left), perturbed (right). C, Six example LGN templates, three for vertical and three for 45°, with nLGN = 4, 5, 6.
Figure 4.
Figure 4.
Voltage and input current traces in Pref and Opp directions for a model high DS Simple cell. Responses of a high DS cell in the model to drifting gratings of 3 c/d and 10 Hz, optimal for this cell. Panels A, C, E are for Pref; B, D, F are corresponding panels for Opp. A (Pref), B (Opp), Voltage traces and spike times. C (Pref), D (Opp), Total synaptic input currents: total excitatory current (= L4+L6+LGN+amb; red), negative of inhibitory current (blue). E (Pref), F (Opp), Synaptic input currents by source: LGN current (orange), cortical E-current (= L4+L6+amb; purple), negative of I-current (blue). Arrows on the left show time averages during spontaneous activity of (A) membrane potential (black), (C) total E (red) and Total I (blue) synaptic currents.
Figure 5.
Figure 5.
DS properties of single cells from experimental data and model output. Tuning curves of three recorded V1 simple cells (left) and six model simple cells (right) are shown. Top, Orientation tuning curves at optimal TF, SF. Middle, Reponses in Pref and Opp directions versus TF. Bottom, Reponses in Pref and Opp directions versus SF.
Figure 6.
Figure 6.
Model data on DS and firing rate as a function of TF and SF. A, Fraction of model Simple and Complex cells with Pref/Opp > 3 (compare to Fig. 1C, experimental data); the fraction is computed on the population of N = 2031 Simple cells and 914 Complex cells in the central HC of the DSV1 model (Fig. 2A). B, Pref and Opp firing rates as a function of TF for those model Simple cells with Pref/Opp > 3; N = 1164. Thick solid curve shows median Pref firing rate, with quartiles shown by the shaded areas. Dashed curve shows median Opp firing rates. C, Pref and Opp firing rates as a function of SF for the same population of 1164 model Simple cells as in B with Pref/Opp > 3.
Figure 7.
Figure 7.
Population statistics of DS in model V1 neurons and comparison with V1 data. A, Distribution of DS in model and data for Simple cells. The plots show the distributions of Pref/Opp in model and data for Simple cells for the <Ori, SF, TF> combination that produced maximum f1 response. The data histogram is plotted in green; the model histogram is plotted in black. B, Cumulative distribution functions (CDFs) of Pref/Opp shown for Simple and Complex populations for data (green) and model (black).
Figure 8.
Figure 8.
Comparison of DS in feedforward input current and in V1 firing rate for model Simple cells. A, Deviations of cortical directional preference from those in feedforward LGN inputs. The statistics shown are for high DS (Pref/Opp > 3) Simple cells with two ON/OFF subregions in their receptive fields (N = 659). All cells were high DS cells in the central HC of the DSV1 model. The x-axis measures deviation of the cell's preferred direction from that of its LGN feedforward inputs. B, Distribution of DS in the f1 response of the feedforward input current (FF-DS) to Simple cells. C, Distribution of DS in the f1 response in V1 firing rate in Simple cells. D, The distribution of the ratio of Cortex-DS/FF-DS cell-by-cell. In BD, the grating that optimizes f1 of the output spike train of the V1 cell is used as Pref in both FF-DS and Cortex-DS. Data are for all Simple cells in the central HC. Black vertical lines are medians; N = 2031.
Figure 9.
Figure 9.
Summed spike rates received by L4 E cells from other L4 cells, in Pref and in Opp directions, plotted against LGN phase (as fractions of a cycle). The E-spikes received are plotted in red, I-spikes in blue. Medians are plotted as the solid (Pref) and dashed (Opp) curves; 25–75% quartiles are indicated by the shading. Data are from high DS cells in the central HC of DSV1; N = 1164. The stimuli were drifting gratings with SF = 3 c/d and TF = 10 Hz, near the peaks of the population tuning curves (like Fig. 6B,C). Here and in Figure 10, LGN phase is depicted as fraction of the stimulus cycle and is in the range [0,1] with 0 corresponding to peak spiking in the LGN input.
Figure 10.
Figure 10.
Membrane potential and cortical currents as function of LGN phase in the DSV1 model. Same cell population, stimuli and notation as in Figure 9. A, Median modulation of membrane potential in Pref (solid) and Opp (dashed) directions. B, The amplitude of the f1 component of net cortical synaptic current (E + I) plotted versus the phase (fraction of a cycle) of the E + I current with respect to the phase of LGN input. Data plotted for the Pref and Opp directions, for each cell in the population. In both directions, the cortical currents are predominantly out of phase (phase ∼ 1/2 cycle) with LGN input. Crosses show medians for both x- and y-axes. C, E and I synaptic currents versus phase with respect to LGN, in both Pref and Opp directions. E plotted in red, I in blue; medians and quartiles plotted for each. Gray curves and shaded regions are medians and quartiles of the net cortical current, E + I. D, LGN excitatory current versus phase with respect to its peak, for Pref and Opp directions. Medians and quartiles plotted as in C. E, Sum of LGN and cortical currents, plotted versus phase with respect to LGN.
Figure 11.
Figure 11.
Dynamic interactions between cortical and feedforward synaptic currents in two groups of model L4 Simple DS cells. A–D, From a group of 167 L4 cells that inherit all their DS and do not enhance it. E–H, From a different group of 176 L4 cells, cells that enhance DS well above that in the LGN input. Both groups were selected to receive the same Pref/Opp ratio of ∼1.8 in their LGN inputs. A, Phase of membrane current versus LGN phase in response to a drifting grating <SF = 3 c/d, TF = 10 Hz>. Opp phase is plotted vertically, and Pref phase horizontally. Note the wide spread of the phases especially in Opp (SD = 0.14 in the Opp direction). B, Medians of the cycle averages of LGN synaptic current; Pref (solid), Opp (dashed). F1 (in normalized units of s−1) for the median are written above the plotted curves. C, Corresponding median synaptic currents (E + I) for L4 cells in Pref and Opp directions. D, Medians of the sums of LGN and cortical synaptic currents in Pref and Opp directions. The Pref/Opp ratio = 1.9 is roughly the same as for the LGN input in B. E–H are analogous to A–D for the second group of cells. Note that in E, the SD of the phase in the Opp direction (= 0.03) is much less than in A, and the Pref/Opp ratio (= 3.3) of the Summed LGN + Cort E + I current is higher in H than in D.

Similar articles

Cited by

References

    1. Adelman JP, Maylie J, Sah P (2012) Small-conductance Ca2+-activated K+ channels: form and function. Annu Rev Physiol 74:245–269. 10.1146/annurev-physiol-020911-153336 - DOI - PubMed
    1. Adelson EH, Bergen JR (1985) Spatiotemporal energy models for the perception of motion. J Opt Soc Am A 2:284–299. 10.1364/josaa.2.000284 - DOI - PubMed
    1. Alonso JM, Usrey WM, Reid RC (2001) Rules of connectivity between geniculate cells and simple cells in cat primary visual cortex. J Neurosci 21:4002–4015. - PMC - PubMed
    1. Angelucci A, Sainsbury K (2006) Contribution of feedforward thalamic afferents and corticogeniculate feedback to the spatial summation area of macaque V1 and LGN. J Comp Neurol 498:330–351. 10.1002/cne.21060 - DOI - PubMed
    1. Baker PM, Bair W (2012) Inter-neuronal correlation distinguishes mechanisms of direction selectivity in cortical circuit models. J Neurosci 32:8800–8816. 10.1523/JNEUROSCI.1155-12.2012 - DOI - PMC - PubMed

Publication types

LinkOut - more resources