Clinical Trial
. 2022 Mar 3;13(1):1150.
doi: 10.1038/s41467-022-28653-6.

An orally available, brain penetrant, small molecule lowers huntingtin levels by enhancing pseudoexon inclusion

Affiliations
Clinical Trial

An orally available, brain penetrant, small molecule lowers huntingtin levels by enhancing pseudoexon inclusion

Caroline Gubser Keller et al. Nat Commun. .

Abstract

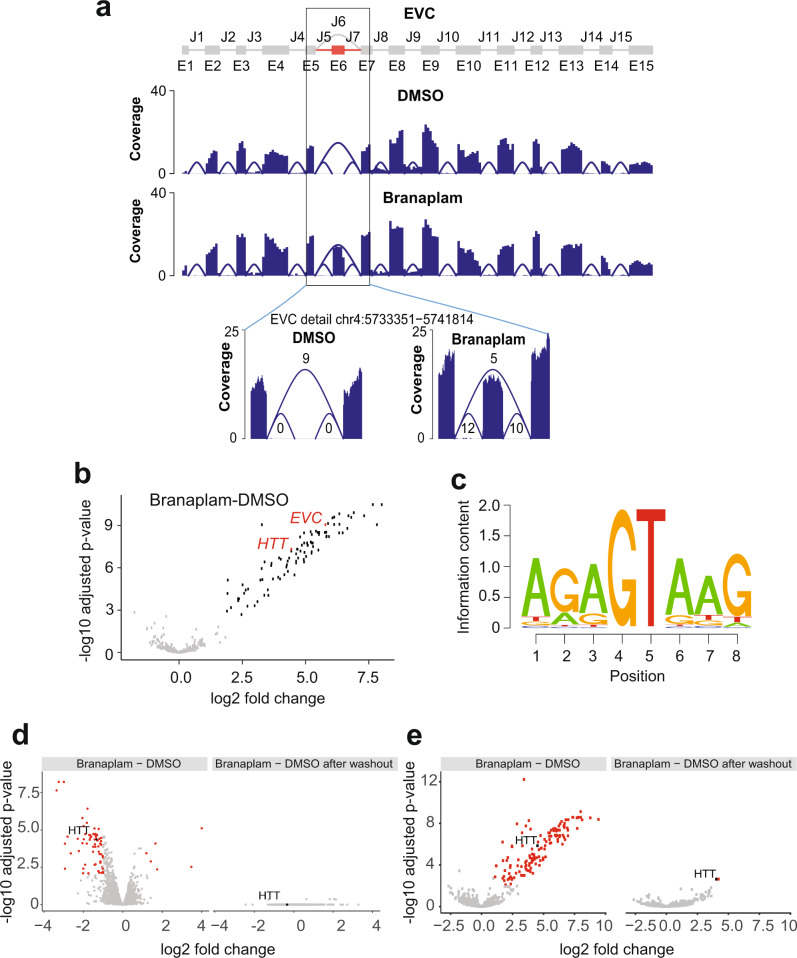
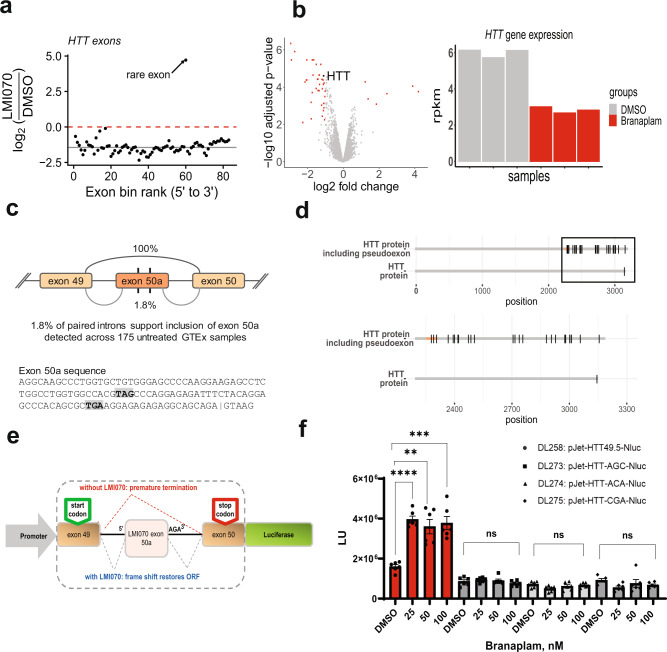
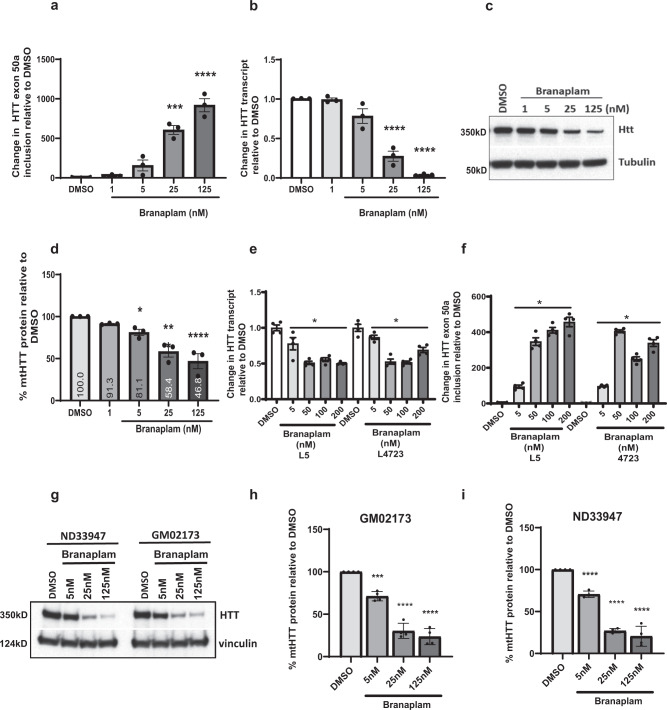
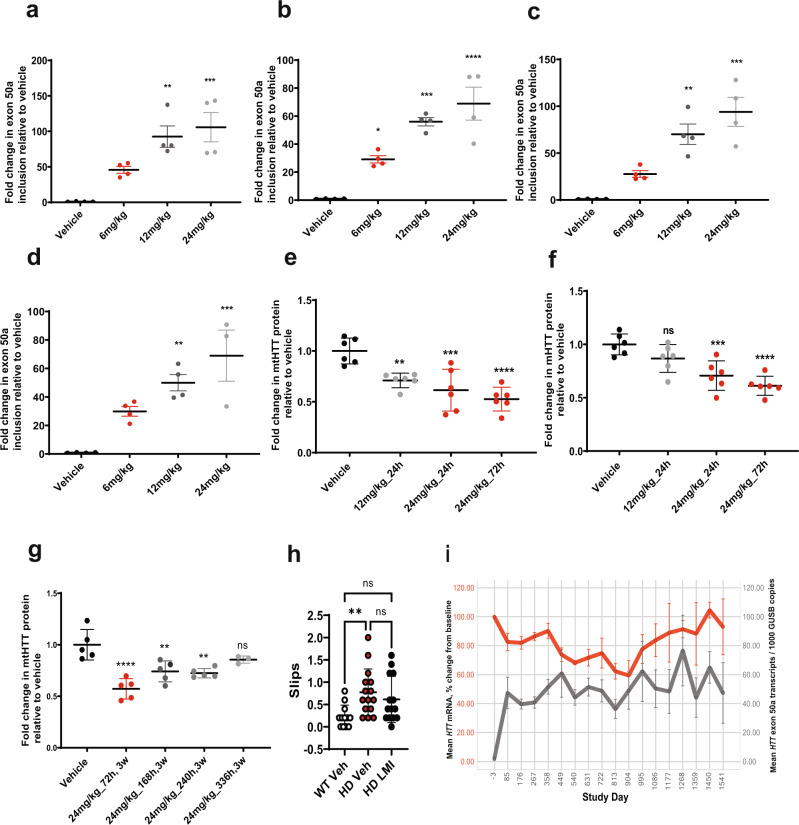
Huntington's Disease (HD) is a progressive neurodegenerative disorder caused by CAG trinucleotide repeat expansions in exon 1 of the huntingtin (HTT) gene. The mutant HTT (mHTT) protein causes neuronal dysfunction, causing progressive motor, cognitive and behavioral abnormalities. Current treatments for HD only alleviate symptoms, but cerebral spinal fluid (CSF) or central nervous system (CNS) delivery of antisense oligonucleotides (ASOs) or virus vectors expressing RNA-induced silencing (RNAi) moieties designed to induce mHTT mRNA lowering have progressed to clinical trials. Here, we present an alternative disease modifying therapy the orally available, brain penetrant small molecule branaplam. By promoting inclusion of a pseudoexon in the primary transcript, branaplam lowers mHTT protein levels in HD patient cells, in an HD mouse model and in blood samples from Spinal Muscular Atrophy (SMA) Type I patients dosed orally for SMA (NCT02268552). Our work paves the way for evaluating branaplam's utility as an HD therapy, leveraging small molecule splicing modulators to reduce expression of dominant disease genes by driving pseudoexon inclusion.


Conflict of interest statement

A.R., B.B., C.G.K., D.T., G.R., J.H.C. J.K., M.B., M.H., N.D., N.R., R.D., R.S., T.F., T.P., and Y.S. are (or were at the time the research was conducted) employees of Novartis. B.L.D. and A.M.M. have sponsored research from Novartis.

Figures

Fig. 1
Fig. 1. Branaplam promotes pseudoexon definition and inclusion.
a SGSeq predicted exons for the EVC gene. Pseudoexon E6 is not annotated in UCSC Refseq and is marked in red (top). Coverage plots of the EVC gene for DMSO and branaplam averaged over replicates (introns rescaled) with zoom in on coverage plots for exons E5, E6, and E7, for both DMSO and branaplam are displayed. The average number of junction counts over replicates are shown (bottom). b First RNA-seq study. Volcano plot for changes in expression of 577 candidates pseudoexons. The pseudoexon E6 in the EVC gene and the pseudoexon in HTT are marked in red and other pseudoexons with an adjusted P value <0.01 and a log2 fold change >1 are highlighted in black. Of these 97 candidates, 94 map to GENCODE genes and are shown in Supplementary Table 2. Statistical analysis was performed with limma/voom. P values are two-sided and multiplicity adjusted. The adjusted P value for the pseudoexon in EVC is 8.86e-10 and the adjusted P value for the pseudoexon in HTT is 4.82e-08. c The panel shows motif enrichment of the 3’ end, in XXX | YYYYY format, (last three bases exonic and first five bases intronic) for the 94 differential pseudoexons that map to GENCODE genes (Supplementary Table 2) obtained with seqLogo. d Washout study. Volcano plots for genes differentially regulated after branaplam treatment. The 45 genes highlighted in red are differentially regulated before washout and return to baseline expression 48 h. after washout (left panel). e Volcano plot for 1543 pseudoexon candidates before (left) and after washout (right). The pseudoexon in HTT is marked in black. Highlighted in red are 139 candidates before washout and 2 candidates (HTT and TBCA) after washout with an adjusted P value <0.01 and a log2 fold change >1. Of these (including HTT), 138 (before washout) and 2 (after washout) respectively map to GENCODE genes and are shown in Supplementary Table 4. Statistical analysis was performed with limma/voom. P values are two-sided and multiplicity adjusted. The adjusted P value for the pseudoexon in HTT is 1.41e-06 before washout and 2.30e-03 after washout. The adjusted P value for the pseudoexon in TBCA after washout is also 2.30e-03.
Fig. 2
Fig. 2. Branaplam enhances inclusion of a pseudoexon in human HTT.
a Washout study. Identification of the novel pseudoexon in HTT following branaplam treatment. The y axis shows the log2 fold change as a function of the exon position rank of the disjoint exon model (from 5’ to 3’). The dark horizontal solid line shows the median of the log2 fold changes of the HTT exon and the horizontal red line highlights the zero line of the y axis (i.e., no change). All exons are consistently downregulated in branaplam-treated cells with the exception of the novel HTT pseudoexon, which is induced by branaplam. b First RNA-seq study. Volcano plot for changes in gene expression in human neuroblastoma cells following treatment with branaplam. Genes with an adjusted P value <0.01 and an absolute log2 fold change >1 are highlighted in red (left panel). Statistical analysis was performed with limma/voom. P values are two-sided and multiplicity adjusted (Benjamini–Hochberg false discovery rate). The adjusted P value for the HTT gene is 1.90E-05. The right panel shows human Huntingtin gene expression values from RNA-seq experiments in a SH-SY5Y cells following DMSO (gray) or branaplam (red) treatment. c The top panel shows that the HTT pseudoexon is a rare exon, detectable in normal human tissue at low levels. The bottom panel shows the sequence of the HTT pseudoexon that is spliced-in after treatment with branaplam and induces a frameshift resulting in two stop codons, both in the pseudoexon itself (highlighted by a gray box). d The top panel shows the wildtype HTT protein and the HTT protein with the inclusion of the pseudoexon (shown in orange), with black vertical lines depicting the stop codons. The bottom panel is focused on the C-terminal end of both isoforms. Shown as vertical black lines are stop codons that are included when the pseudoexon is induced. e Graphic depicting the design of the HTT minigene reporters. f Data showing the effect of DMSO or branaplam on wild-type and point-mutant HTT minigene reporters as measured by luciferase reporter activity. Data represent mean + /−STDEV (n = 6). Response of the wildtype reporter (DL258) to indicated doses of branaplam, **P < 0.01, ***P < .001, ****P < 0.0001, Unpaired t test with Welch’s correction. Response of the three mutant reporters (DL273, DL274, DL275) to branaplam was not significantly different compared to DMSO. Unpaired t test with Welch’s correction.
Fig. 3
Fig. 3. Branaplam lowers HTT-transcript and protein levels in normal and HD patient cells.
a Quantitative PCR results showing the transcript levels of HTT exon 50a included after DMSO or branaplam treatment (at indicated doses), ****P < 0.0001, one-way ANOVA. The data are presented as mean ± SEM of three independent experiments. b HTT-transcript changes after DMSO or branaplam treatment (at indicated doses) for 24 h in SH-SY5Y human neuroblastoma cells, ***P < 0.001, ****P < 0.0001, one-way ANOVA. The data are presented as mean ± SEM of three independent experiments. c Western blot and d quantitation showing total HTT protein levels after DMSO or branaplam treatment (at indicated doses) for 48 h in SH-SY5Y cells, *P < 0.05, ***P < 0.001, ****P < 0.0001, one-way ANOVA. The data are presented as mean ± SEM of three independent experiments. e Quantitative PCR results showing HTT mRNA expression levels after DMSO or Branaplam treatment (at indicated doses) for 24 h. Two independent HD patient fibroblasts cell lines (GM04723 and ND31551 (L5)), and a TaqMan™ assay priming for human HTT exons 64–65 was used. Samples are normalized to human GAPDH, and data are the mean ± SEM relative to HD fibroblasts treated with DMSO (eight biological replicates, *P value <0.001, one-way ANOVA followed by a Bonferroni’s post hoc). f Quantitative PCR results showing HTT50a exon inclusion levels in two HD patient fibroblasts cell lines (GM04723 and ND31551 (L5)) after 24-h treatment with DMSO or branaplam (at indicated doses). Samples are normalized to human GAPDH, and data are the mean ± SEM relative to HD fibroblasts treated with DMSO (four biological replicates, *P value <0.001, one-way ANOVA followed by a Bonferroni’s post hoc). g western blot and h, i quantitation showing mutant HTT protein levels after DMSO or branaplam treatment (at indicated doses) for 96 h in HD patient fibroblast cells, ****P < 0.0001, one-way ANOVA. Data are the mean ± SD relative to DMSO from four independent experiments.
Fig. 4
Fig. 4. Branaplam modulates human mHTT transcript and protein levels in the brain and rescues narrow beam performance in BacHD mice.
Q-PCR analysis of HTT Exon 50a inclusion in a, striatum b, cortex c, thalamus and d, cerebellum in response to vehicle or branaplam administrated at 6, 12, and 24 mg/kg every other day for a total of three doses. Data are the mean ± SEM of four mice per group, ****P < 0.0001, ***P < 0.001, **P < 0.01, *P < 0.05 vehicle vs branaplam-treated groups, one-way ANOVA followed by Bonferroni’s post hoc. e mHTT protein levels in the striatum of BacHD mice (n = 6) treated with 12 mg/kg or 24 mg/kg of branaplam for 3 weeks and analyzed at the indicated timepoints after last treatment. Data are the mean ± SEM of six mice per group. One-way ANOVA with Dunnett’s multiple comparisons test: **P = 0.048, ***P = 0.0003, ****P < 0.0001, and (b) ****P < 0.0001, **P value = 0.003. f mHTT protein levels in the cortex of BacHD mice (n = 6) treated with 12 mg/kg or 24 mg/kg of branaplam and taken down at indicated timepoints. Data are the mean ± SEM of six mice per group. One-way ANOVA with Dunnett’s multiple comparisons test: ***P value = 0.0008, (Vehicle vs 24 mg/kg, 72 h) ****P value <0.0001. g Time-course of mHTT protein levels in the striatum of BacHD mice (n = 6) treated with 12 mg/kg or 24 mg/kg of branaplam for 3 weeks and analyzed at the indicated timepoints after last treatment. Data are the mean ± SEM of six mice per group. One-way ANOVA with Dunnett’s multiple comparisons test: **P value = 0.0017, ****P value <0.0001. h Branaplam treatment in BACHD females rescues the number of slips on the narrow beam. Data represent mean ± SEM of 12 WT and 15 BACHD mice treated with vehicle, and 14 HD mice treated with branaplam. *P ≤0.05 and **P ≤0.01 indicates a significant difference detected by a Kruskal–Wallis test with Dunn’s multiple comparisons tests. i HTT transcripts in whole-blood samples from Type I SMA patients dosed weekly with branaplam. The mean age at screening was 4.21 months (SD, 1.481 months; range, 1.8‒7.5 months) with slightly more females (57.9%) enrolled into the study. The gray curve depicts average number of copies of HTT mRNA transcripts with exon 50a inclusion per 1000 GUSB mRNA copies in the blood of infants with SMA Type I after multiple weekly administrations branaplam. The red curve represents the average percentage change from baseline in total blood HTT mRNA levels in infants with SMA type I after multiple weekly administration of oral branaplam as measured using primers upstream (exons 36–37) of exon 50a. Error Bars represent mean ± SEM.

References

    1. MacDonald, M.E. et al. A novel gene containing a trinucleotide repeat that is expanded and unstable on Huntington’s disease chromosomes. The Huntington’s Disease Collaborative Research Group. Cell72, 971–983 (1993). - PubMed
    1. Melkani GC. Huntington’s disease-induced cardiac disorders affect multiple cellular pathways. React. Oxyg. Species (Apex) 2016;2:325–338. - PMC - PubMed
    1. Mochel F, Haller RG. Energy deficit in Huntington disease: why it matters. J. Clin. Invest. 2011;121:493–499. doi: 10.1172/JCI45691. - DOI - PMC - PubMed
    1. Stanek LM, et al. Silencing mutant huntingtin by adeno-associated virus-mediated RNA interference ameliorates disease manifestations in the YAC128 mouse model of Huntington’s disease. Hum. Gene. Ther. 2014;25:461–474. doi: 10.1089/hum.2013.200. - DOI - PMC - PubMed
    1. Kordasiewicz HB, et al. Sustained therapeutic reversal of Huntington’s disease by transient repression of huntingtin synthesis. Neuron. 2012;74:1031–1044. doi: 10.1016/j.neuron.2012.05.009. - DOI - PMC - PubMed

Publication types

Substances

Associated data