. 2022 Mar 3;13(1):1135.
doi: 10.1038/s41467-022-28743-5.

Intestinal AMPK modulation of microbiota mediates crosstalk with brown fat to control thermogenesis

Affiliations

Intestinal AMPK modulation of microbiota mediates crosstalk with brown fat to control thermogenesis

Eryun Zhang et al. Nat Commun. .

Abstract

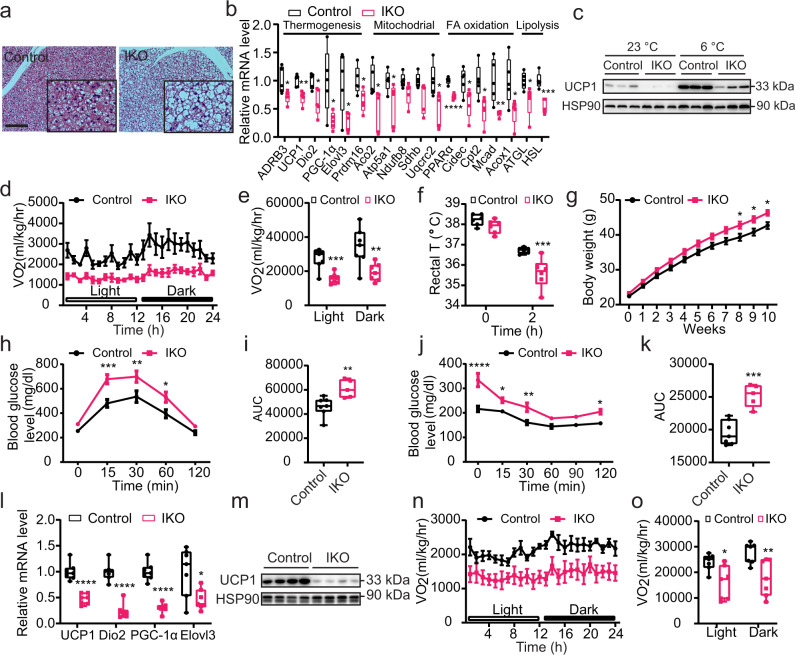
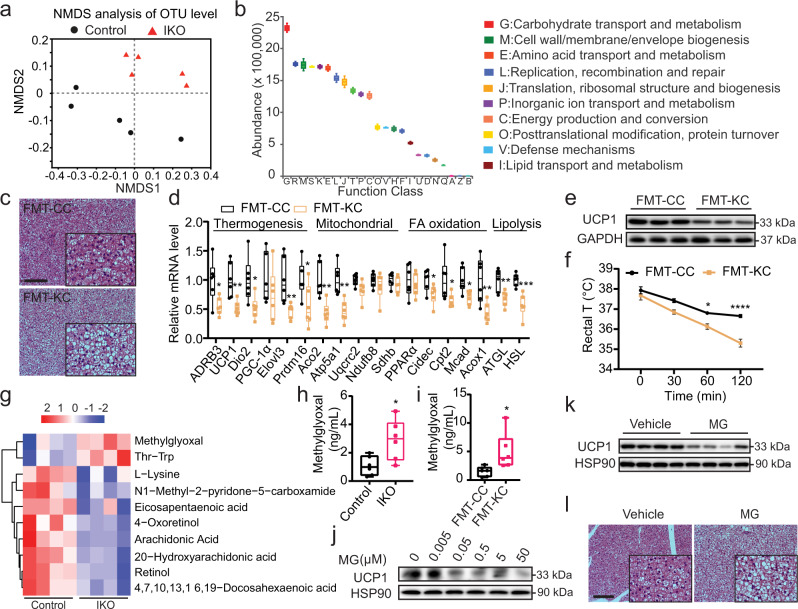
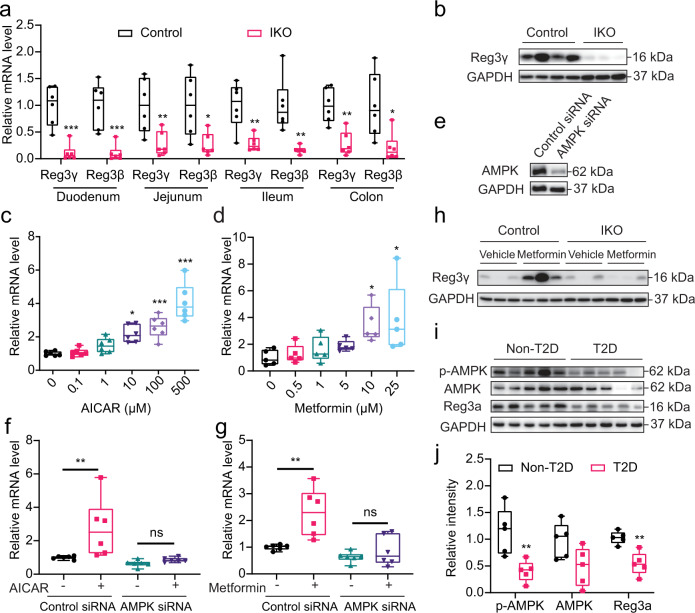
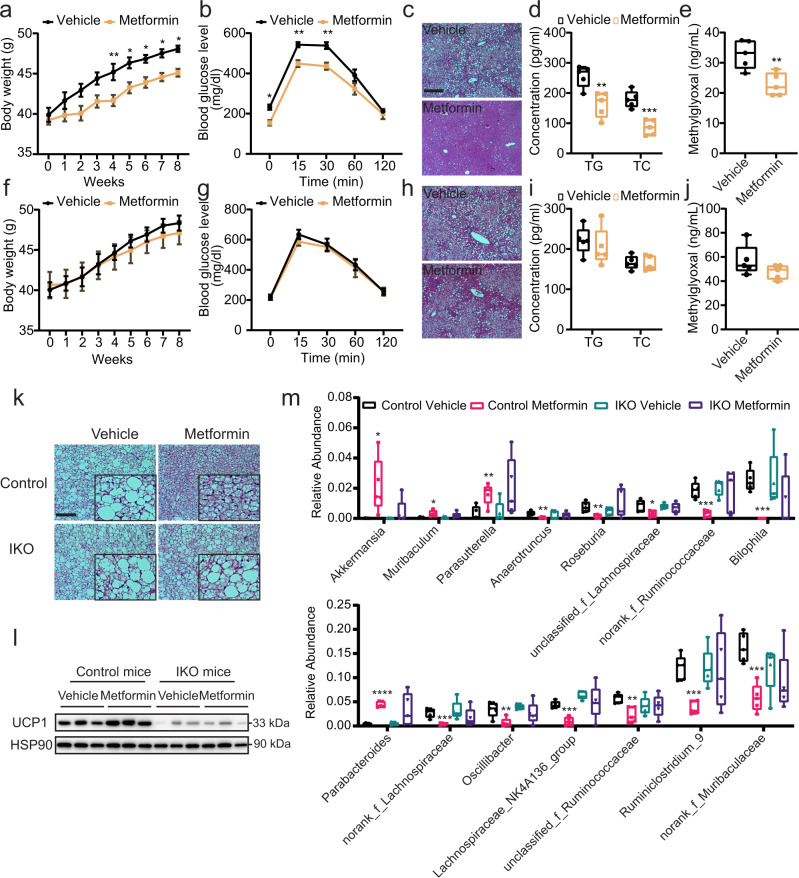
The energy-dissipating capacity of brown adipose tissue through thermogenesis can be targeted to improve energy balance. Mammalian 5'-AMP-activated protein kinase, a key nutrient sensor for maintaining cellular energy status, is a known therapeutic target in Type II diabetes. Despite its well-established roles in regulating glucose metabolism in various tissues, the functions of AMPK in the intestine remain largely unexplored. Here we show that AMPKα1 deficiency in the intestine results in weight gain and impaired glucose tolerance under high fat diet feeding, while metformin administration fails to ameliorate these metabolic disorders in intestinal AMPKα1 knockout mice. Further, AMPKα1 in the intestine communicates with brown adipose tissue to promote thermogenesis. Mechanistically, we uncover a link between intestinal AMPKα1 activation and BAT thermogenic regulation through modulating anti-microbial peptide-controlled gut microbiota and the metabolites. Our findings identify AMPKα1-mediated mechanisms of intestine-BAT communication that may partially underlie the therapeutic effects of metformin.


Conflict of interest statement

The authors declare no competing interests.

Figures

Fig. 1
Fig. 1. Intestinal epithelial AMPK knockout mice have impaired BAT function.
For af, AMPKα1fl/fl (Control) and AMPKα1-IKO mice were fed chow diet. a Representative images of H&E-stained BAT sections. Scale bar = 100 µm. b Relative mRNA levels of genes in BAT (n = 5 biologically independent 0.0495, 0.0271, <0.0001, 0.0364, 0.0152, 0.0093, 0.0329, 0.0328, 0.0006. c Western blot analysis of UCP1 protein levels in BAT before and after cold exposure (6 °C) for 1 week. d, e VO2 of mice over 24 h (n = 7 biologically independent samples). P value: 0.0007, 0.0075. f Rectal temperatures of mice exposed to 6 °C for 2 h (n = 6 biologically independent samples). P value: 0.0004. For go, mice were fed HFD for 10–12 weeks. g Body weights of mice during the HFD feeding period. Mice were fed HFD from 6-week-old (n = 20 biologically independent samples for control group, n = 16 biologically independent samples for IKO group). P value: 0.0326, 0.0197, 0.0209. h, i Glucose tolerance test results at 10 weeks of HFD feeding (n = 7 biologically independent samples for control group, n = 5 group). P value for h: 0.0004, 0.0047, 0.0255. P value for i: 0.0088. j, k Insulin tolerance test results at 11 weeks of HFD feeding (n = 7 biologically independent samples for control group, n = 5 biologically independent samples for IKO group). P value for j: <0.0001, 0.0301, 0.0011, 0.0225. P value for k: 0.0003. l Relative mRNA levels of thermogenesis genes in BAT (n = 7 biologically independent samples). P value: <0.0001, <0.0001, <0.0001, 0.0165. m UCP1 protein levels in BAT. n, o VO2 of mice over 24 h (n = 7 biologically independent samples). P value: 0.0119, 0.0079. Values are means ± s.e.m. for d, g, h, j, n. The boxplot elements (for b, e, f, i, k, l, and o) are defined as following: center line, median; box limits, upper and lower quartiles; whiskers, 1.5 × interquartile range. *P < 0.05, **P < 0.01, ***P < 0.001 and ****P < 0.0001 cf. control mice by two-tailed Student’s t-tests (for b, e, i, k, l, o) and two-way ANOVA with Tukey’s post-hoc tests for fh, o. Source data are provided as a Source Data file.
Fig. 2
Fig. 2. Intestinal AMPK remotely regulates BAT function by modulating gut microbiota and their metabolites.
a Non-metric multidimensional scaling (NMDS) analysis of operational taxonomic unit (OTU) levels in AMPKα1fl/fl (Control) and AMPKα1-IKO mice fed chow diet (n = 5 biologically independent samples). b Functional classification of microbiota with differential abundance in AMPKα1-IKO mice compared to AMPKα1fl/fl mice, based on the Clusters of Orthologous Groups (COGs) database (n = 5 biologically independent samples). c Representative images of H&E-stained BAT sections from FMT recipient mice. Scale bar = 100 µm. FMT-CC, FMT from AMPKα1fl/fl mice to WT mice; FMT-KC, FMT from AMPKα1-IKO mice to WT mice. d Relative mRNA levels of genes expressed in the BAT of recipient mice (n = 6 biologically independent samples). P value: 0.0171, 0.0041, 0.0203, 0.0097, 0.0380, 0.0025, 0.0018, 0.0357, 0.0371, 0.0121, 0.0080, 0.0080, 0.0007. e Representative Western blot analysis of UCP1 protein levels in the BAT of recipient mice. f Rectal temperatures of recipient mice exposed to 6 °C for 2 h (n = 6 biologically independent samples for FMT-CC group and n = 8 biologically independent samples for FMT-KC group). P value: 0.0152, <0.0001. g Metabolomic analysis of serum samples from DIO Control and AMPKα1-IKO mice. h, i Serum methylglyoxal levels in DIO mice (h) and FMT recipient mice (i), measured using ELISA (n = 6 biologically independent samples). P value for h: 0.0172, P value for i: 0.0266. j Representative Western blot analysis of UCP1 protein expression in HIB1B cells treated with methylglyoxal (MG) for 24 h. k UCP1 protein expression in the BAT of WT mice after intraperitoneally (i.p.) with methylglyoxal (50 mg/kg) once daily for 14 days. l Representative images of H&E-stained BAT sections of mice treated with methylglyoxal. Scale bar = 100 µm. Values are means ± s.e.m. for b, f. The boxplot elements (for d, h, i) are defined as following: center line, median; box limits, upper and lower quartiles; whiskers, 1.5 × interquartile range. *P < 0.05, **P < 0.01, ***P < 0.001 and ****P < 0.0001 by two-tailed Student’s t-tests for d, h, j and two-way ANOVA with Tukey’s post-hoc tests for (f). Source data are provided as a Source Data file.
Fig. 3
Fig. 3. Intestinal AMPKα1 regulates the AMP Reg3.
a Relative mRNA levels of Reg3γ and Reg3β in the duodenum, jejunum, ileum, and colon of AMPKα1fl/fl (Control) and AMPKα1-IKO mice fed chow diet (n = 6 biologically independent samples). P value: 0.0003, 0.0007, 0.0095, 0.0143, 0.0029, 0.0022, 0.0011, 0.0143. b Representative Reg3γ protein levels in the jejunum of mice fed chow diet. c, d Relative mRNA levels of Reg3α in HT-29 cells treated with gradient concentrations of AICAR (c, n = 6 biologically independent samples, P value: 0.0078, 0.0004, <0.0001) and metformin (d, n = 5 biologically independent samples, P value: 0.0315, 0.0120). e Western blot analysis of AMPK protein in HT-29 cells treated with control siRNA or AMPK siRNA. f, g Relative mRNA levels of Reg3α in AMPK knockdown HT-29 cells treated with 100 µM of AICAR (f) or 10 µM of metformin (g) for 24 h. n = 6 biologically independent samples. P value for f: 0.0128. P value for g: 0.0023. h Representative Reg3γ protein levels in WT DIO mice treated with metformin. i Western blot analysis of total AMPK, phosphorylated AMPK (p-AMPK), and Reg3α in duodenal mucosa samples from patients with obesity and T2D. j The quantitated densities of these Western blot bands are also shown (n = 5 biologically independent samples). P value: 0.0089, 0.0023. The boxplot elements (for a, c, d, f, g, j) are defined as following: center line, median; box limits, upper and lower quartiles; whiskers, 1.5 × interquartile range. *P < 0.05, **P < 0.01, ***P < 0.001 and ****P < 0.0001 by two-tailed Student’s t-test (for a, cf. Control mice; for j, cf. non-T2D human samples), and one- or two-way ANOVA with Tukey’s post-hoc tests (for c, d, cf. vehicle-treated cells; for f, g, cf. vehicle-treated cells infected with control siRNA). Source data are provided as a Source Data file.
Fig. 4
Fig. 4. The therapeutic effects of metformin on metabolic disorders depend on intestinal AMPK.
DIO AMPKα1fl/fl (Control; ad) and AMPKα1-IKO (eh) mice were orally garaged with metformin (100 mg/kg) once daily for 8 weeks. a, f Body weights of mice during metformin treatment (n = 7 biologically independent samples). P value for a: 0.0066, 0.0264, 0.0417, 0.0400, 0.0384. b, g Glucose tolerance test results at 8 weeks of metformin administration (n = 7 biologically independent samples). P value for b: 0.0308, 0.0055, 0.0022. c, h Representative images of H&E-stained liver sections. Scale bar = 100 µm. d, i Fasting serum levels of triglycerides (TG) and total cholesterol (TC) (n = 5 biologically independent samples). P value for d: 0.0054, 0.0006. e, j Serum methylglyoxal levels measured by LC/MS–MS methods (n = 5 biologically independent samples). P value for e: 0.0061. k Representative images of H&E-stained BAT sections, Scale bar = 100 µm. l Representative UCP1 protein expression in BAT. m Relative abundance of microbiota at the genus level (n = 5 biologically independent samples). P value for the upper panel: 0.0313, 0.0173, 0.0081, 0.0016, 0.0049, 0.0193, 0.0004, 0.0001. P value for the lower panel: <0.0001, 0.0007, 0.0091, 0.0001, 0.0032, 0.0002, 0.0005. Values are means ± s.e.m. for a, b and f, g. The boxplot elements are defined as following: center line, median; box limits, upper and lower quartiles; whiskers, 1.5 × interquartile range for d, e, i, j, and m. *P < 0.05, **P < 0.01, ***P < 0.001 and ****P < 0.0001 cf. vehicle-treated mice by two-tailed Student’s t-test (for d, e, i, j, m), and two-way ANOVA with Tukey’s post-hoc tests (for a, b, f, g). Source data are provided as a Source Data file.

Comment in

References

    1. Jackson VM, et al. Latest approaches for the treatment of obesity. Expert Opin. Drug Discov. 2015;10:825–839. - PubMed
    1. Lin SC, Hardie DG. AMPK: sensing glucose as well as cellular energy status. Cell Metab. 2018;27:299–313. - PubMed
    1. Hardie DG, Sakamoto K. AMPK: a key sensor of fuel and energy status in skeletal muscle. Physiology. 2006;21:48–60. - PubMed
    1. Harmel E, et al. AMPK in the small intestine in normal and pathophysiological conditions. Endocrinology. 2014;155:873–888. - PubMed
    1. Woods A, et al. LKB1 is the upstream kinase in the AMP-activated protein kinase cascade. Curr. Biol. 2003;13:2004–2008. - PubMed

Publication types