

Loss of transcriptional plasticity but sustained adaptive capacity after adaptation to global change conditions in a marine copepod
- PMID: 35241657
- PMCID: PMC8894427
- DOI: 10.1038/s41467-022-28742-6
Loss of transcriptional plasticity but sustained adaptive capacity after adaptation to global change conditions in a marine copepod
Abstract
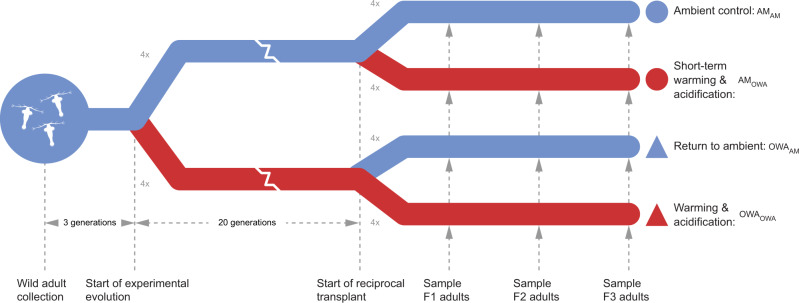
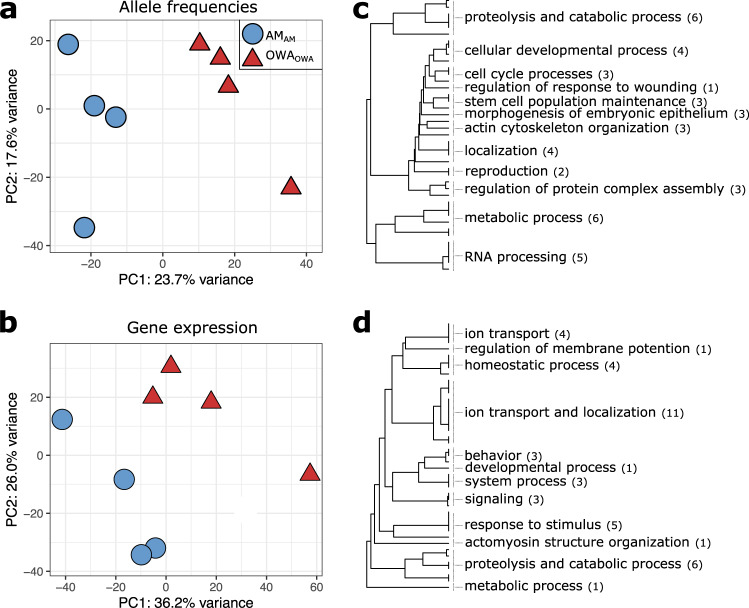
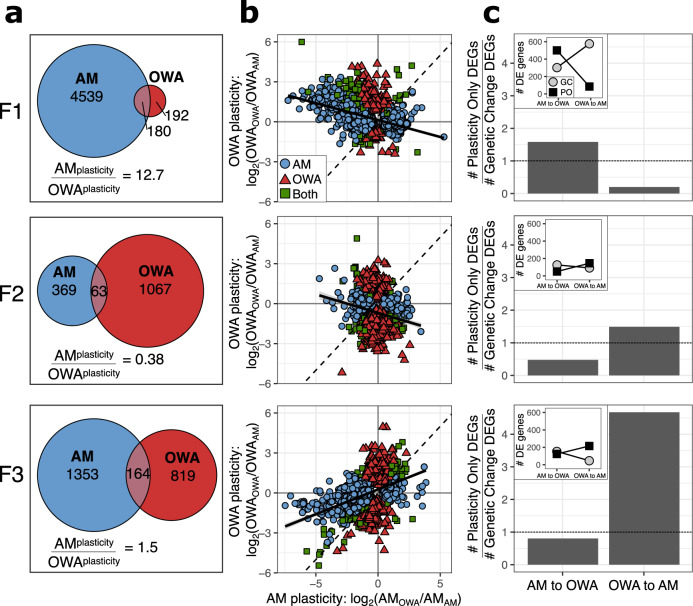
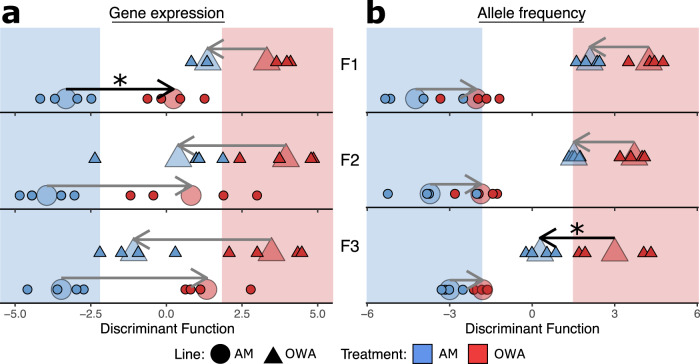
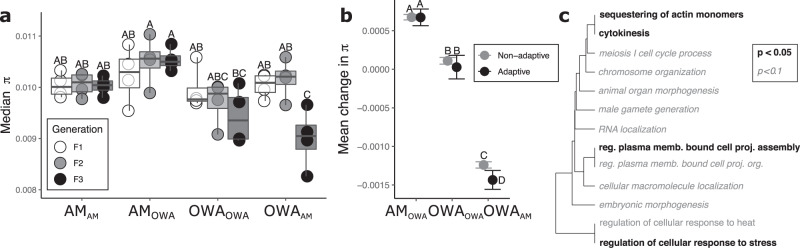
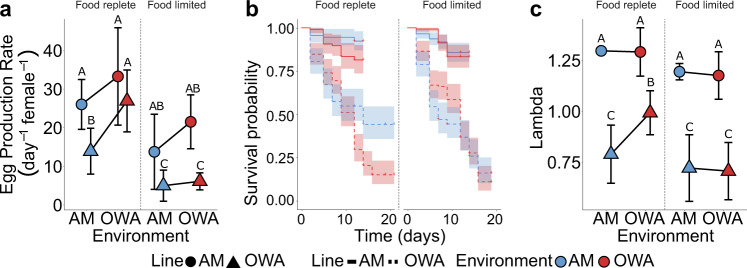
Adaptive evolution and phenotypic plasticity will fuel resilience in the geologically unprecedented warming and acidification of the earth's oceans, however, we have much to learn about the interactions and costs of these mechanisms of resilience. Here, using 20 generations of experimental evolution followed by three generations of reciprocal transplants, we investigated the relationship between adaptation and plasticity in the marine copepod, Acartia tonsa, in future global change conditions (high temperature and high CO2). We found parallel adaptation to global change conditions in genes related to stress response, gene expression regulation, actin regulation, developmental processes, and energy production. However, reciprocal transplantation showed that adaptation resulted in a loss of transcriptional plasticity, reduced fecundity, and reduced population growth when global change-adapted animals were returned to ambient conditions or reared in low food conditions. However, after three successive transplant generations, global change-adapted animals were able to match the ambient-adaptive transcriptional profile. Concurrent changes in allele frequencies and erosion of nucleotide diversity suggest that this recovery occurred via adaptation back to ancestral conditions. These results demonstrate that while plasticity facilitated initial survival in global change conditions, it eroded after 20 generations as populations adapted, limiting resilience to new stressors and previously benign environments.
© 2022. The Author(s).
Conflict of interest statement
The authors declare no competing interests.
Figures
Similar articles
-
Simultaneous warming and acidification limit population fitness and reveal phenotype costs for a marine copepod.Proc Biol Sci. 2023 Sep 13;290(2006):20231033. doi: 10.1098/rspb.2023.1033. Epub 2023 Sep 6. Proc Biol Sci. 2023. PMID: 37670582 Free PMC article.
-
Adaptation to simultaneous warming and acidification carries a thermal tolerance cost in a marine copepod.Biol Lett. 2021 Jul;17(7):20210071. doi: 10.1098/rsbl.2021.0071. Epub 2021 Jul 14. Biol Lett. 2021. PMID: 34256577 Free PMC article.
-
Experimental evolution reveals the synergistic genomic mechanisms of adaptation to ocean warming and acidification in a marine copepod.Proc Natl Acad Sci U S A. 2022 Sep 20;119(38):e2201521119. doi: 10.1073/pnas.2201521119. Epub 2022 Sep 12. Proc Natl Acad Sci U S A. 2022. PMID: 36095205 Free PMC article.
-
Biochemical adaptation to ocean acidification.J Exp Biol. 2015 Jun;218(Pt 12):1946-55. doi: 10.1242/jeb.115584. J Exp Biol. 2015. PMID: 26085671 Review.
-
Evolutionary adaptation of marine zooplankton to global change.Ann Rev Mar Sci. 2013;5:349-70. doi: 10.1146/annurev-marine-121211-172229. Epub 2012 Jul 31. Ann Rev Mar Sci. 2013. PMID: 22809192 Review.
Cited by
-
Synergistic response to climate stressors in coral is associated with genotypic variation in baseline expression.Proc Biol Sci. 2024 Mar 27;291(2019):20232447. doi: 10.1098/rspb.2023.2447. Epub 2024 Mar 27. Proc Biol Sci. 2024. PMID: 38531406 Free PMC article.
-
Sexual conflict, heterochrony and tissue specificity as evolutionary problems of adaptive plasticity in development.Proc Biol Sci. 2023 Oct 11;290(2008):20231854. doi: 10.1098/rspb.2023.1854. Epub 2023 Oct 11. Proc Biol Sci. 2023. PMID: 37817601 Free PMC article. Review.
-
Simultaneous warming and acidification limit population fitness and reveal phenotype costs for a marine copepod.Proc Biol Sci. 2023 Sep 13;290(2006):20231033. doi: 10.1098/rspb.2023.1033. Epub 2023 Sep 6. Proc Biol Sci. 2023. PMID: 37670582 Free PMC article.
-
Evolved and Plastic Gene Expression in Adaptation of a Specialist Fly to a Novel Niche.Mol Ecol. 2025 Feb;34(4):e17653. doi: 10.1111/mec.17653. Epub 2025 Jan 9. Mol Ecol. 2025. PMID: 39783891 Free PMC article.
-
Naupliar exposure to acute warming does not affect ontogenetic patterns in respiration, body size, or development time in the cosmopolitan copepod Acartia tonsa.PLoS One. 2023 Apr 20;18(4):e0282380. doi: 10.1371/journal.pone.0282380. eCollection 2023. PLoS One. 2023. PMID: 37079566 Free PMC article.
References
-
- Somero, G. N. The physiology of climate change: how potentials for acclimatization and genetic adaptation will determine ‘winners’ and ‘losers’. J. Exp. Biol. 213, 912–920 (2010). - PubMed
-
- Hoffmann AA, Sgrò CM. Climate change and evolutionary adaptation. Nature. 2011;470:479–485. - PubMed
-
- Kawecki TJ, Ebert D. Conceptual issues in local adaptation. Ecol. Lett. 2004;7:1225–1241.
Publication types
MeSH terms
LinkOut - more resources
Full Text Sources
