. 2022 Mar 3;13(1):1152.
doi: 10.1038/s41467-022-28766-y.

Antibody escape and global spread of SARS-CoV-2 lineage A.27

Affiliations

Antibody escape and global spread of SARS-CoV-2 lineage A.27

Tamara Kaleta et al. Nat Commun. .

Abstract

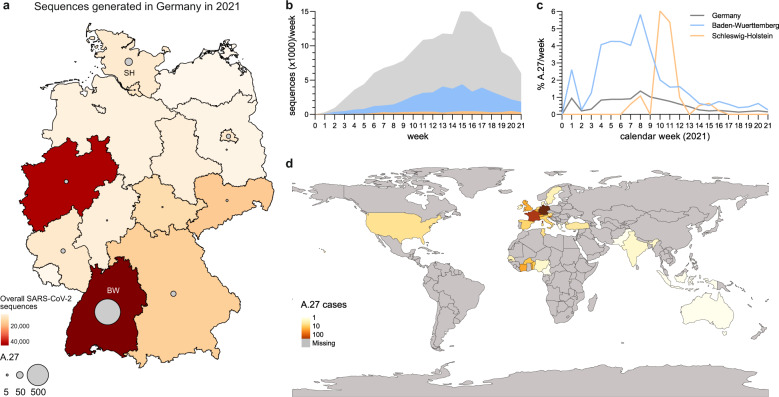
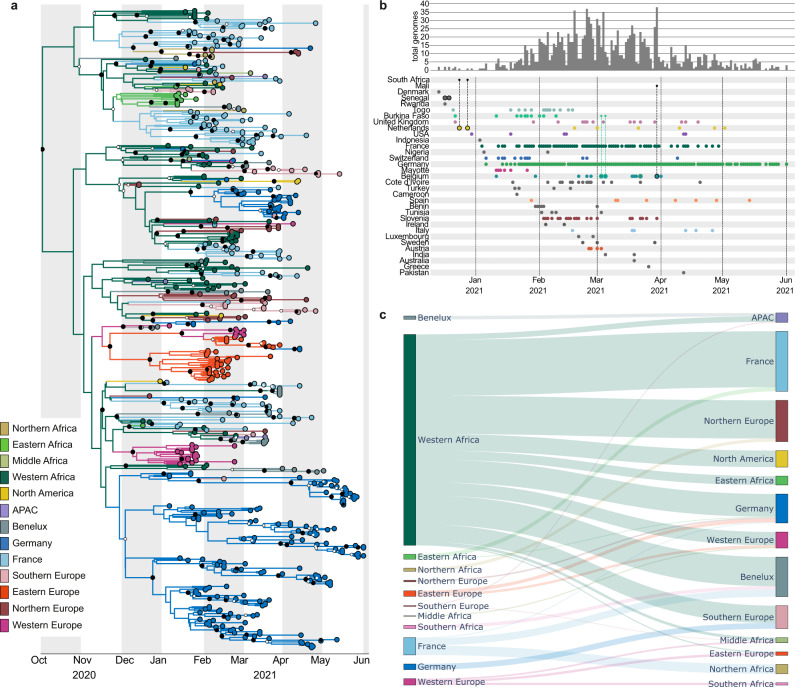
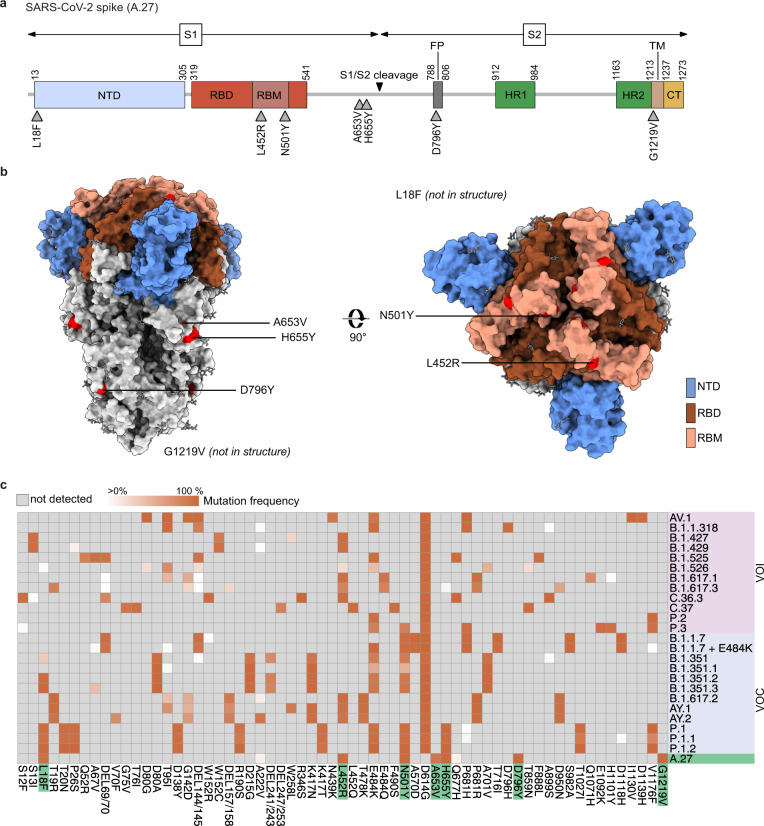
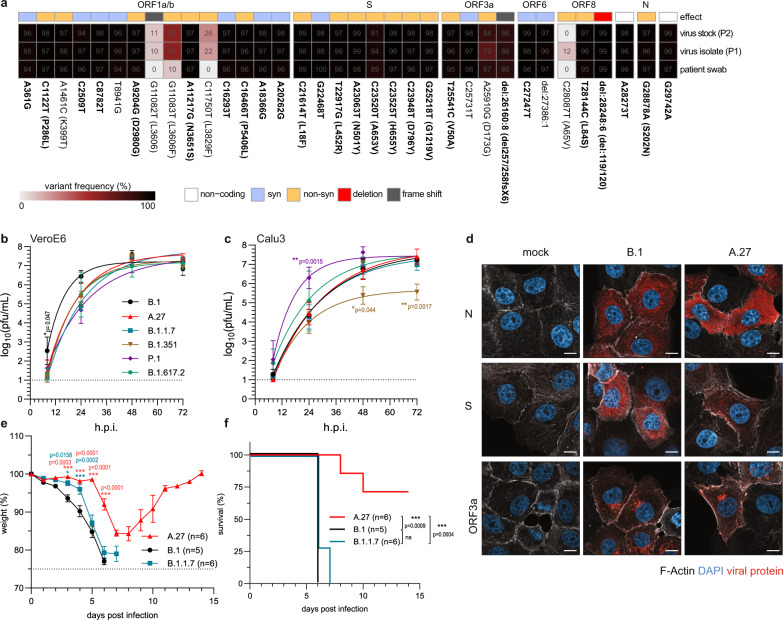
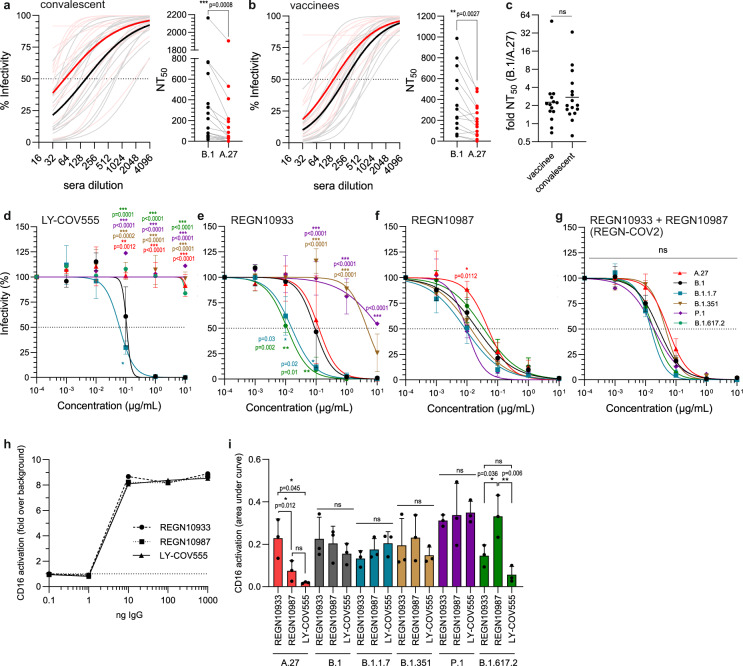
In spring 2021, an increasing number of infections was observed caused by the hitherto rarely described SARS-CoV-2 variant A.27 in south-west Germany. From December 2020 to June 2021 this lineage has been detected in 31 countries. Phylogeographic analyses of A.27 sequences obtained from national and international databases reveal a global spread of this lineage through multiple introductions from its inferred origin in Western Africa. Variant A.27 is characterized by a mutational pattern in the spike gene that includes the L18F, L452R and N501Y spike amino acid substitutions found in various variants of concern but lacks the globally dominant D614G. Neutralization assays demonstrate an escape of A.27 from convalescent and vaccine-elicited antibody-mediated immunity. Moreover, the therapeutic monoclonal antibody Bamlanivimab and partially the REGN-COV2 cocktail fail to block infection by A.27. Our data emphasize the need for continued global monitoring of novel lineages because of the independent evolution of new escape mutations.


Conflict of interest statement

The authors declare no competing interests.

Figures

Fig. 1
Fig. 1. Detection of lineage A.27 in Germany.
a Map of Germany displaying the cumulative number of all SARS-CoV-2 sequences (colors) and A.27 sequences (circles) generated in different federal states between January and June 2021. BW—Baden-Wuerttemberg, SH—Schleswig-Holstein. b, c Temporal distribution of sequences for each calendar week for (b) all or (c) A.27 sequences in Germany and the two federal states BW and SH. d World map displaying the cumulative A.27 sequences obtained from the GISAID and RKI databases. Source data are provided as a Source Data file.
Fig. 2
Fig. 2. Origins of SARS-CoV-2 lineage A.27.
a Region-annotated phylogeny, showing an inferred origin of the A.27 lineage in Western Africa with subsequent spread to most of the other regions where A.27 was detected. Smaller white circles represent posterior support >0.5, whereas bigger black circles represent posterior support >0.95. b Known locations, dates and individual travel histories of A.27 cases. Rows show the collection dates of genomes on the bottom, as well as the frequency of genomes as a bar plot at the top. The origin and destination is shown for travel cases: genomes with associated travel history are outlined with the color corresponding to the origin location, and are connected to this origin location with a smaller dot. c Sankey plot showing the number of transitions between locations through the estimated number of Markov jumps. The thickness of the lines are proportional to the number of Markov jumps from the location to the left into the location on the right, conditional on the corresponding Bayes factor being higher than 3, pointing to strong support for an inferred origin of the A.27 lineage in Western Africa. Input XML files of the phylogeographic analysis are supplied in the Supplementary Data 1.
Fig. 3
Fig. 3. Metadata analysis of patients infected with A.27.
Metadata of confirmed A.27 and B.1.1.7 infected patients was acquired from the RKI and GISAID. a Scatter plot of the age distribution of patients infected with B.1.1.7 or A.27 patients. Displayed is the mean age. Statistical analysis was performed with a two-sided t-test (**p < 0.01). b Gender distribution and (c) hospitalization rate of B.1.1.7 and A.27 patients. Statistics were performed with a two-sided Fisher’s exact test (ns— not significant). Source data are provided as a Source Data file.
Fig. 4
Fig. 4. A.27 shows a mutational pattern in its viral spike gene that resembles other VOCs and VOIs.
a Schematic overview of the SARS-CoV-2 spike gene and the non-synonymous mutations found in more than 75% of A.27 sequences (n = 1386) compared to the S of Wuhan-Hu-1 sequence (NC_045512.2). NTD–N-terminal domain, RBD–receptor-binding domain, RBM–receptor-binding motif, FP–fusion peptide, HR1/2–heptad repeat region, TM–transmembrane domain, CT–C-terminal domain. b The spike protein of SARS-CoV-2 (PDB accession number: 6vxx) with the mutations displayed in (a) is shown in surface presentation. c Comparison of spike mutations present in A.27 and the different VOCs and VOIs. The mutation frequencies of the different lineages were downloaded from outbreak.info (accessed on 2021-07-13) and the A.27 mutation frequencies replaced with the frequencies calculated based on the 1386 sequences used in this study. The heatmap was visualized with the R pheatmap package. Source data are provided as a Source Data file.
Fig. 5
Fig. 5. A.27 Black Forest isolate displays all lineage-defining mutations and is attenuated in vivo.
a Variant frequency plot (https://github.com/jonas-fuchs/SARS-CoV-2-analyses) of the variant frequencies detected by next-generation sequencing in the oropharyngeal swab of a patient from the Black Forest area in Germany infected with A.27, after virus isolation (passage 1/P1) and virus cultivation (passage 2/P2) on VeroE6 cells. The variant frequencies in comparison to Wuhan-Hu-1 (NC_045512.2) are plotted as a heatmap with the respective frequencies indicated as %. Mutations present in 75% of A.27 sequences are marked bold. b, c Viral growth kinetics of the A.27/Freiburg isolate (P2) in comparison to the virus isolates B.1, B.1.1.7, B.1.351, P.1 and B.1.617.2 in (b) VeroE6 or (c) Calu3 cells. Confluent cells were infected (moi of 0.001) and the cell supernatant was harvested after 8, 24, 48 and 72 h post infection. Viral titres were determined by plaque assay on VeroE6 cells. The log-transformed titres are shown as means ± SD from three independent experiments. Significance was determined in comparison to A.27 via a two-way ANOVA with a Tukey´s multiple comparison test, *p < 0.05, **p < 0.01. d Confocal fluorescence microscopy analysis of B.1 or A.27 infected VeroE6 cells (moi 0.1) 8 h post infection. Fixed cells were stained with SARS-CoV-2 N, S and ORF3a specific antibodies (red). In addition, F-actin (phalloidin, white) and nuclear DNA (DAPI, blue) were detected. Shown are representative pictures of two independent experiments. Scale bars indicate 10 µm. e, f Weight loss (e) and survival (f) of hACE2 transgenic mice infected intranasally with 132 pfu of the A.27 (n = 7), B.1 (n = 5) or B.1.1.7 (n = 7) isolates were monitored daily (mean ± SEM). Significance in weight loss was determined in comparison to B.1 via a two-way ANOVA with a Tukey´s multiple comparison test, *p < 0.05, ***p < 0.001. Significance for the survival was calculated with a Log-rank (Mantel–Cox) test (ns—not significant, ***p < 0.001). Source data are provided as a Source Data file.
Fig. 6
Fig. 6. Neutralizing capacity of sera and therapeutic monoclonal antibodies against A.27.
a Neutralizing activity of convalescent sera (n = 16) or (b) sera from BioNTech BNT162b2 vaccinees (n = 14) against B.1 (gray) or A.27 (red). 100 pfu of each virus was incubated with serial twofold sera dilutions and analyzed by plaque assay. The curve fits (light color) and the mean curve fit (dark color) were plotted (left panel) and neutralization titres calculated (right panel). Statistics were performed with a paired, two-tailed t-test (**p < 0.01, ***p < 0.001). c The fold difference of the NT50 between B.1 and A.27 was calculated for the analyzed convalescent sera (n = 16) and sera from vaccinees (n = 14). Shown are the individual values and the geometric mean. Statistics were performed on log2-transformed values with a two-tailed t-test (ns—not significant). dg Neutralizing capacity of the therapeutic antibodies (d) LY-COV555, (e) REGN10933, (f) REGN10987 or (g) the combination of REGN10933 and REGN10987 in a 1:1 ratio. Serial tenfold dilutions of the monoclonal antibodies were incubated with 100 pfu of the different viruses and analyzed by plaque assay. Plotted are the curve fits and mean ± SD of three independent experiments. Statistics were calculated with a two-way ANOVA (Tukey’s multiple comparison test, *p < 0.05, **p < 0.01, ***p < 0.001). h, i CD16 reporter cell IL-2 production was quantified via anti-mIL-2 ELISA. REGN10987, REGN10933 or LY-COV555 were (h) titrated and immobilized or (i) inactivated virions of different SARS-CoV-2 isolates were titrated, immobilized and opsonized with 20 ng/µl of IgG. In (e) the mean of two independent experiments is displayed. The dotted horizontal line in (h) represents the ELISA background set to 1. For (i) the area under the curve was calculated from virion titration (undiluted, 1:10,1:100). Shown are mean and standard deviation of three independent experiments. Statistics were performed with a one-way ANOVA (Tukey’s multiple comparison test, ns—not significant, *p < 0.05, **p  < 0.01). Source data are provided as a Source Data file.

References

    1. Wang Q, et al. Structural and functional basis of SARS-CoV-2 entry by using human ACE2. Cell. 2020;181:894–904. - PMC - PubMed
    1. Hoffmann M, et al. SARS-CoV-2 cell entry depends on ACE2 and TMPRSS2 and is blocked by a clinically proven protease inhibitor. Cell. 2020;181:271–280. - PMC - PubMed
    1. Ke Z, et al. Structures and distributions of SARS-CoV-2 spike proteins on intact virions. Nature. 2020;588:498–502. - PMC - PubMed
    1. Lan J, et al. Structure of the SARS-CoV-2 spike receptor-binding domain bound to the ACE2 receptor. Nature. 2020;581:215–220. - PubMed
    1. McCallum M, et al. N-terminal domain antigenic mapping reveals a site of vulnerability for SARS-CoV-2. Cell. 2021;184:2332–2347.e16. - PMC - PubMed

Publication types

MeSH terms

Supplementary concepts