. 2022 Mar 3;13(1):1153.
doi: 10.1038/s41467-022-28792-w.

Optical sensors for operando stress monitoring in lithium-based batteries containing solid-state or liquid electrolytes

Affiliations

Optical sensors for operando stress monitoring in lithium-based batteries containing solid-state or liquid electrolytes

Laura Albero Blanquer et al. Nat Commun. .

Abstract

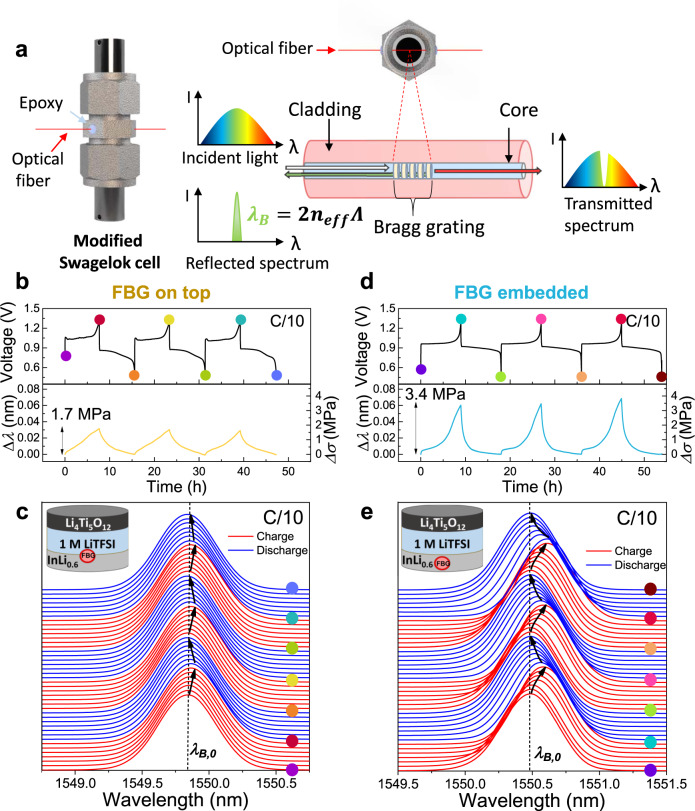
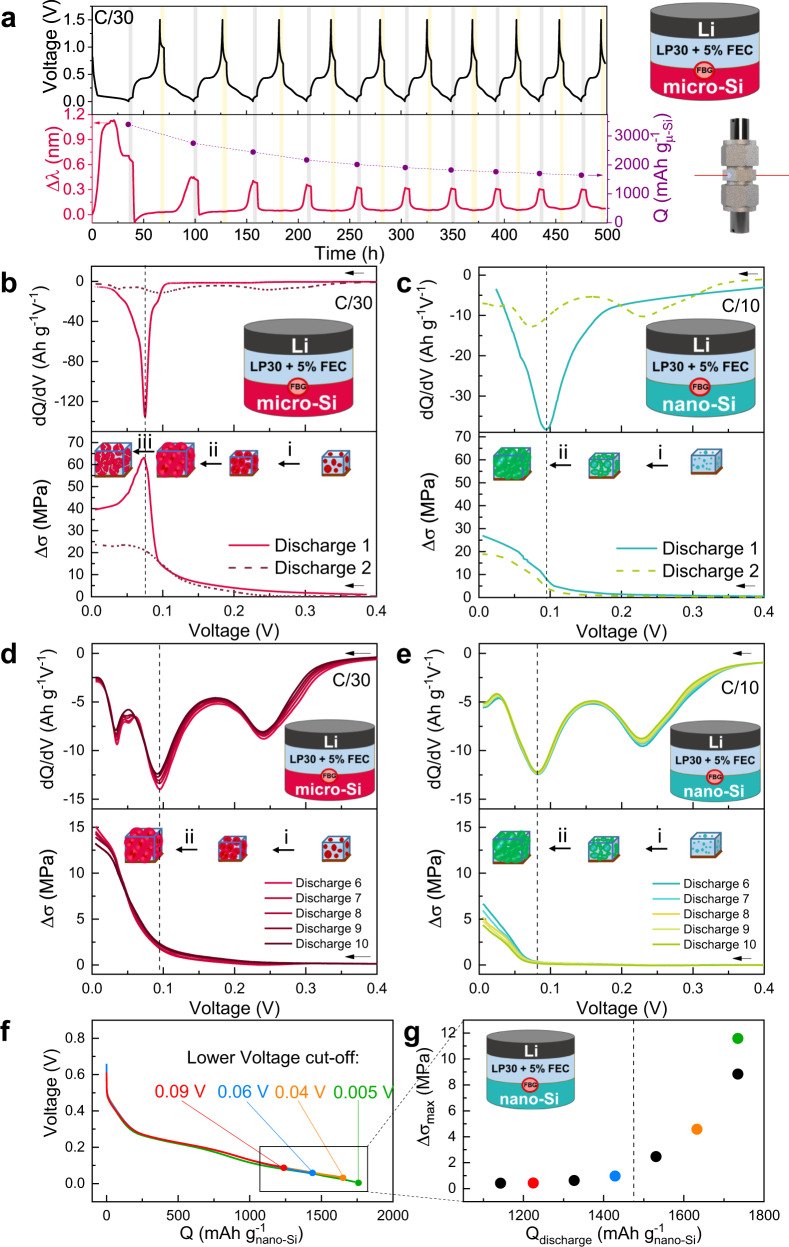
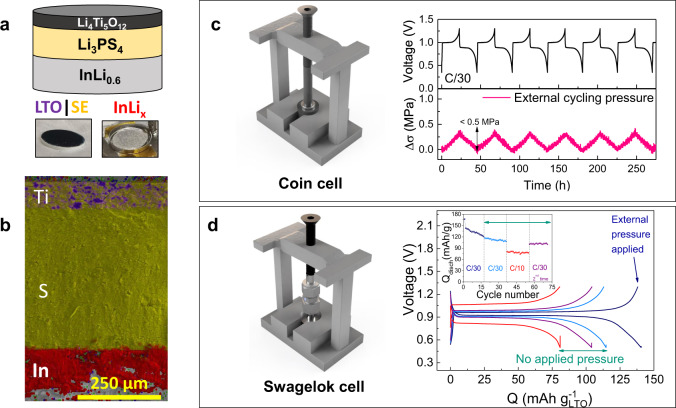
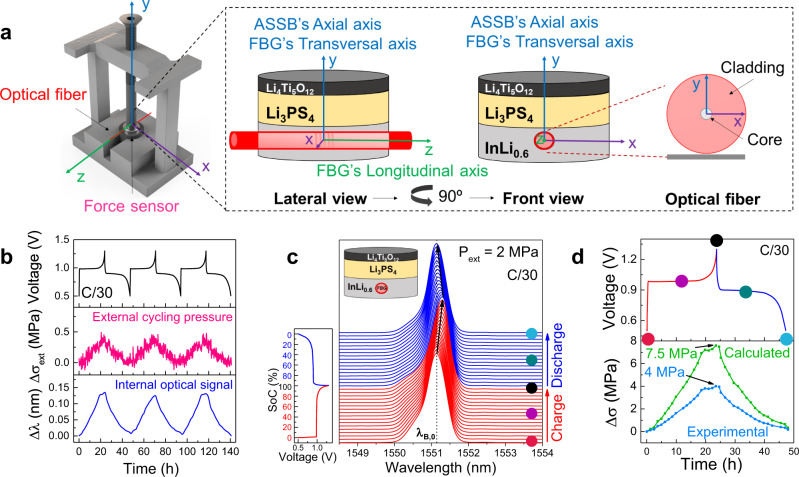
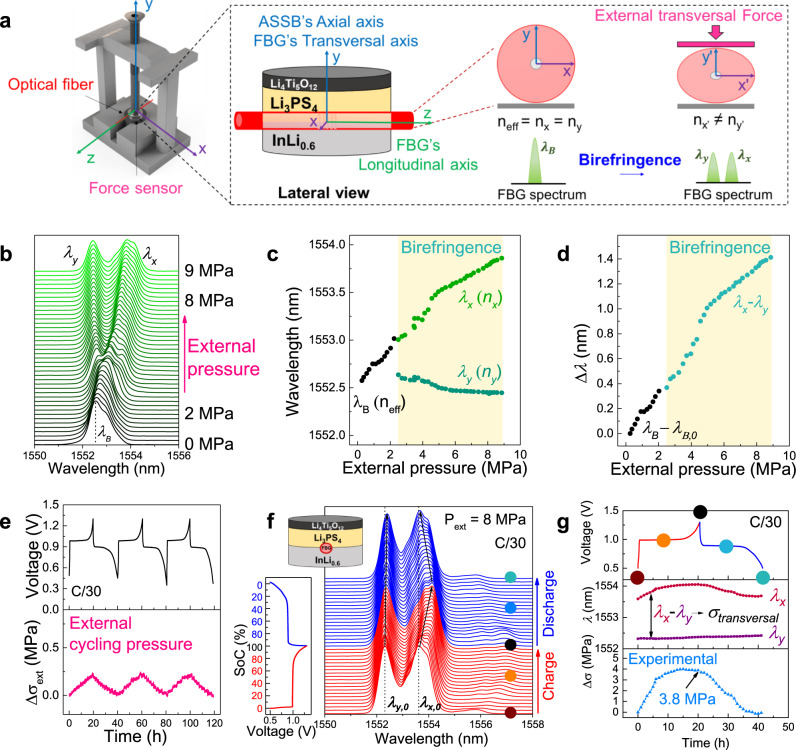
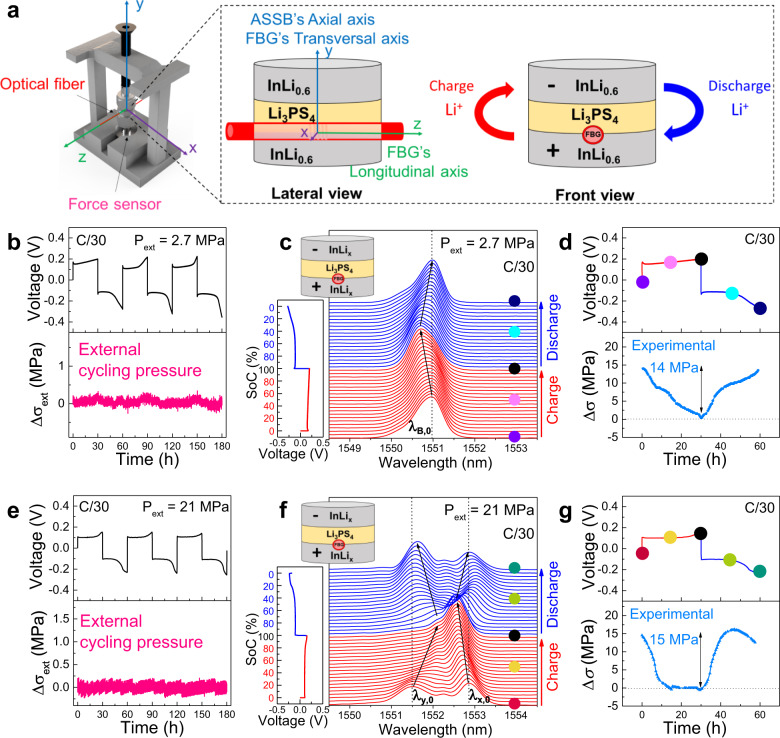
The study of chemo-mechanical stress taking place in the electrodes of a battery during cycling is of paramount importance to extend the lifetime of the device. This aspect is particularly relevant for all-solid-state batteries where the stress can be transmitted across the device due to the stiff nature of the solid electrolyte. However, stress monitoring generally relies on sensors located outside of the battery, therefore providing information only at device level and failing to detect local changes. Here, we report a method to investigate the chemo-mechanical stress occurring at both positive and negative electrodes and at the electrode/electrolyte interface during battery operation. To such effect, optical fiber Bragg grating sensors were embedded inside coin and Swagelok cells containing either liquid or solid-state electrolyte. The optical signal was monitored during battery cycling, further translated into stress and correlated with the voltage profile. This work proposes an operando technique for stress monitoring with potential use in cell diagnosis and battery design.


Conflict of interest statement

The authors declare no competing interests.

Figures

Fig. 1
Fig. 1. Experimental setup, FBG working principle, and Li-driven stress monitoring in InLix || LTO cells with liquid electrolyte.
a Scheme of the integration of an FBG into an in-house modified Swagelok cell together with the working principle of an FBG optical sensor. b Time-resolved voltage (top) and Δλ and Δσ (bottom) evolution from the FBG sensor of an InLi0.6 | 1 M LiTFSI in DOL:DME | LTO cell with liquid electrolyte with the FBG placed at the anode/electrolyte interface. c 2D stack-view of the reflected spectra given by the FBG sensor located at the anode/electrolyte interface for the cycles shown in (b). d, e Analogous plots to (b, c), for a cell with the FBG sensor embedded within the InLix electrode.
Fig. 2
Fig. 2. Li-driven stress monitoring in Li || Si cells with liquid electrolyte.
a Time-resolved voltage profile (top) and Δλ (bottom, left) evolution from the FBG sensor of a Li | (LP30+FEC)| Si cell with liquid electrolyte with the FBG placed at the interface between the Si-based electrode and the electrolyte contained in the porous separator. The discharge capacity (bottom, right) is also presented at the end of each lithiation. After each discharge and charge, 6 h of OCV were defined, shadowed in gray and yellow, respectively. b, c Comparison of the first and second cycle for micro-Si and nano-Si electrodes, respectively. The dQ/dV plots together with the Δσ evolution from a FBG sensor located on top of the corresponding silicon electrodes are presented. Schemes of the sequential steps (i) porosity filling, (ii) electrode thickening, and (iii) particles pulverization are shown in the figure. The porosity of the nano-Si electrode and micro-Si electrode was 51% and 75%, respectively. d, e Comparison of the sixth to the tenth cycle for micro-Si and nano-Si electrodes, respectively. The dQ/dV plots together with the Δσ evolution is shown. f Galvanostatic curves of the 12th to 18th cycles for the nano-Si cells with different cut-off voltages together with the corresponding g Δσmax for the different capacities achieved. The cells were cycled in a 25 °C oven at a C-rate of C/30 (120 mA g−1) for micro-Si and C/10 (360 mA g−1) for nano-Si to better compare the cycling conditions in terms of efficient particle surface current density.
Fig. 3
Fig. 3. Fiber-free ASSBs tested in the modified cell designs.
a Scheme of the InLi0.6 | Li3PS4 | Li4Ti5O12 cell and photo of the different battery components. b EDX mapping of the cross-section view of the aforementioned ASSB. The selected elements to track the different battery components are Ti (purple) for the cathode, S (yellow) for the solid electrolyte, and In (red) for the anode. The remaining bright area on the bottom corresponds to metallic Li not alloyed. The measured thickness for each layer is 84.98, 429.0, and 147.0 μm, respectively. An EDX mapping of the ASSB with the implemented optical fiber can be seen in Supplementary Fig. 8. c Scheme of the coin cell placed under a frame with an external force sensor. The galvanostatic cycling of the ASSB (top) is presented together with the external cycling pressure evolution, monitored with the external force sensor for the ASSB cycled at C/30 (5.83 mA g−1) and at 25 °C. d Scheme of the Swagelok cell placed under a frame with an external force sensor. Fifth galvanostatic charge/discharge cycle and discharge capacity vs. cycle number (inset) for the ASSB with the following C-rate protocol: the cell was cycled first at C/30 under external pressure applied by the force sensor and then, the Swagelok screws were totally tightened so the ASSB was cycled without additional external pressure at C/30, C/10 (17.5 mA g−1), and C/30 again up to ~70 cycles in total showing good capacity retention.
Fig. 4
Fig. 4. Operando Li-driven stress monitoring in InLix | LPS | LTO cell by an FBG embedded in the anode.
a Scheme of the modified coin cell with the implemented optical fiber and the external force sensor. The corresponding X-, Y-, and Z-axis are detailed in the different views. It is important to note that an axis transverse to the fiber is an axis perpendicular to the main symmetry axis (c∞) and therefore the axis “axial” to the cell is a “transverse” axis to the fiber. To simplify nomenclature, every time we herein mention “longitudinal” or “transversal” will be respected to the fiber and “axial” will only be respected to the cell. b Time-resolved voltage (top), external cycling pressure (middle), and an internal optical signal (bottom) for the aforementioned ASSB cycled at C/30 (5.83 mA g−1) and 25 °C in an operando mode. c 2D stack view of the reflected spectra, with the corresponding galvanostatic charge/discharge cycle. The charge and discharge processes are plotted in red and blue, respectively. d Comparison between operando stress evolution obtained: 1—internally by the FBG sensor and using the mathematical model (green curve) and 2—internally by the FBG sensor and the sensitivity coefficient obtained with the experimental calibration of the sensor (blue curve). The respective galvanostatic charge/discharge is presented (top). The points at the beginning/middle/end of the charge/discharge are indicated by colored dots, also marked in the corresponding FBG spectra in (d). The external cycling pressure was fixed at 2 MPa prior to performing the battery cycling.
Fig. 5
Fig. 5. Operando Li-driven stress monitoring in InLix | LPS | LTO cell by an FBG placed at the interface between the anode and the solid-state electrolyte.
a Scheme of the modified coin cell with the implemented optical fiber and the external force sensor. The corresponding X-, Y-, and Z-axis are detailed in the different views. For the sake of simplicity, the “longitudinal” and “transversal” axis is used with respect to the optical fiber, and the “axial” axis is only used with respect to the cell. The scheme of the birefringence phenomena is presented. bd Experimental calibration curve of the FBG sensor when the ASSB is in an OCV status. The externally applied pressure is increased externally from 0 to 9 MPa. Detailed values of λB, λx, and λy vs. the externally applied pressure with the force sensor. The birefringence regime is shadowed in light yellow. Two regions are observed: 1—when only one peak is observed in the spectra (λB, given by λB = 2neffΛ), the calibration is done by λBλB,0 and 2—the birefringence regime when λx and λy can be followed. The difference between λx and λy is used in order to calibrate internal transverse stresses. In our case, we focused on externally applied pressure of 8 MPa to profit from the birefringence phenomenon. Thus, the slope of the linear fitting in the upper birefringence regime (5–9 MPa) is 0.105 nm MPa−1. e Time-resolved voltage (top), and external cycling pressure (bottom) for the aforementioned ASSB cycled at C/30 (5.83 mA g−1) and 25 °C in an operando mode. f 2D stack view of the operando collected spectra by the FBG sensor, with the corresponding galvanostatic charge/discharge cycle. The charge and discharge processes are plotted in red and blue, respectively. g Galvanostatic cycle (top), λx and λy evolution (middle) and operando stress evolution obtained internally by the FBG sensor and with the experimental calibration of the sensor (bottom). The points at the beginning/middle/end of the charge/discharge are indicated by colored dots, also marked in the corresponding FBG spectra in (f).
Fig. 6
Fig. 6. Operando Li-driven stress monitoring in a symmetrical InLix | LPS | InLix cell by an FBG located at the interface between the cathode and the solid-state electrolyte.
a Scheme of the modified Swagelok cell with the implemented optical fiber and the external force sensor. The corresponding X-, Y-, and Z-axis are detailed in the different views. For the sake of simplicity, the “longitudinal” and “transversal” axis is used with respect to the optical fiber, and the “axial” axis is only used with respect to the cell. The direction of the Li+ ions during charge/discharge is detailed in the scheme. b Time-resolved voltage (top), and external cycling pressure (bottom) for the aforementioned ASSB cycled at C/30 (5.83 mA g−1) and 25 °C for three consecutive cycles, at an externally applied pressure of 2.7 MPa, and e 21 MPa. c, f 2D stack view of the collected spectra by the FBG sensor, with the corresponding galvanostatic charge/discharge cycle when the externally applied pressure is 2.7 and 21 MPa, respectively. The charge and discharge processes are plotted in red and blue, respectively. d Galvanostatic cycle (top), and operando stress evolution obtained internally by the FBG sensor and with the experimental calibration of the sensor (bottom) when the externally applied pressure is 2.7 MPa, and g 21 MPa. The points at the beginning/middle/end of the charge/discharge are indicated by colored dots, also marked in the corresponding FBG spectra in (c). Note that due to the location of the FBG sensor in the positive electrode, the relative stress is normalized (Δσ = 0 MPa) at the beginning of the discharge to compare positive stress variations.

References

    1. Armand M, Tarascon J-M. Building better batteries. Nature. 2008;451:652–657. - PubMed
    1. Larcher D, Tarascon J-M. Towards greener and more sustainable batteries for electrical energy storage. Nat. Chem. 2015;7:19–29. - PubMed
    1. Tarascon J-M, Armand M. Issues and challenges facing rechargeable lithium batteries. Nature. 2001;414:359–367. - PubMed
    1. Assat G, Tarascon J-M. Fundamental understanding and practical challenges of anionic redox activity in Li-ion batteries. Nat. Energy. 2018;3:373–386.
    1. Sun H, et al. Three-dimensional holey-graphene/niobia composite architectures for ultrahigh-rate energy storage. Science. 2017;356:599–604. - PubMed