. 2022 Mar 3;8(1):10.
doi: 10.1038/s41522-022-00271-6.

Socioeconomic disparities and household crowding in association with the fecal microbiome of school-age children

Affiliations

Socioeconomic disparities and household crowding in association with the fecal microbiome of school-age children

Yelena Lapidot et al. NPJ Biofilms Microbiomes. .

Abstract

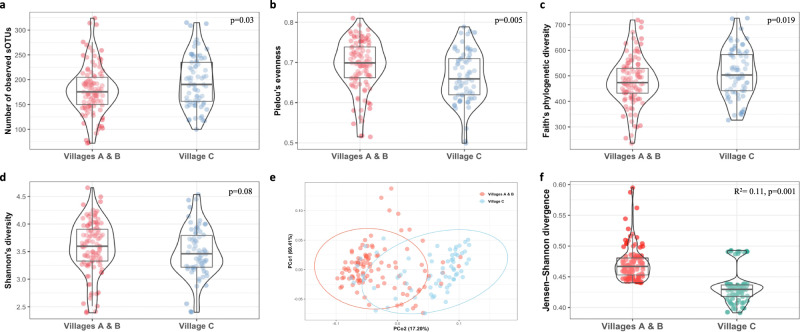
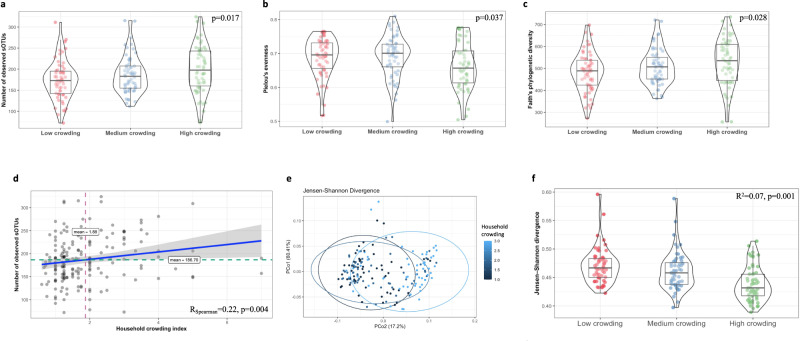
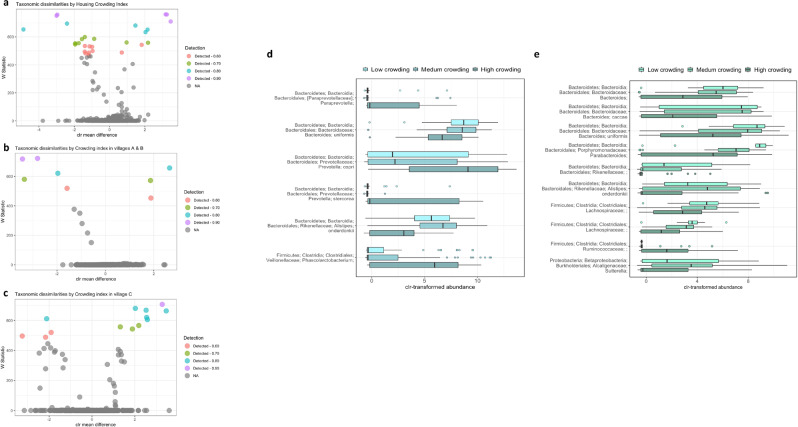
The development of the gut microbiome occurs mainly during the first years of life; however, little is known on the role of environmental and socioeconomic exposures, particularly within the household, in shaping the microbial ecology through childhood. We characterized differences in the gut microbiome of school-age healthy children, in association with socioeconomic disparities and household crowding. Stool samples were analyzed from 176 Israeli Arab children aged six to nine years from three villages of different socioeconomic status (SES). Sociodemographic data were collected through interviews with the mothers. We used 16 S rRNA gene sequencing to characterize the gut microbiome, including an inferred analysis of metabolic pathways. Differential analysis was performed using the analysis of the composition of microbiomes (ANCOM), with adjustment for covariates. An analysis of inferred metagenome functions was performed implementing PICRUSt2. Gut microbiome composition differed across the villages, with the largest difference attributed to socioeconomic disparities, with household crowding index being a significant explanatory variable. Living in a low SES village and high household crowding were associated with increased bacterial richness and compositional differences, including an over-representation of Prevotella copri and depleted Bifidobacterium. Secondary bile acid synthesis, d-glutamine and d-glutamate metabolism and Biotin metabolism were decreased in the lower SES village. In summary, residential SES is a strong determinant of the gut microbiome in healthy school-age children, mediated by household crowding and characterized by increased bacterial richness and substantial taxonomic and metabolic differences. Further research is necessary to explore possible implications of SES-related microbiome differences on children's health and development.


Conflict of interest statement

The authors declare no competing interests.

Figures

Fig. 1
Fig. 1. Divergent socioeconomic villages and the gut microbiome diversity and composition.
a Box-violin plots of microbial richness, measured by the number of observed s-OTUs. b Box-violin plots of microbial α-diversity, measured by Pielou’s evenness index. c Box-violin plots of microbial α-diversity, measured by the phylogenetic-based metric Faith’s PD. d Box-violin plots of microbial α-diversity, measured by the Shannon’s diversity index. P-value for the differences between villages A and B vs. village C: p = 0.005 for Pielou’s evenness index, p = 0.03 for the number of observed s-OTUs, p = 0.019 for Faith’s PD, and p = 0.08 for Shannon’s diversity. e Principal coordinate analysis of the JSD notably different among children villages A and B vs. village C (PERMANOVA R2 = 0.11, p = 0.001). f Box-violin plots of the mean JSD distances across villages. Within the study population, villages A and B represent the intermediate/high SES villages, while village C represents the lower SES village. The sample size in each village was 47, 59, and 70, respectively. In the box-violin plots (panels a, b, c, d, f), the centre line represents the median, the lower bound of the box represents the 25th percentile, the upper bound of the box represents the 75th percentile, the lowest point of the lower whisker represents the minimum value and the highest point of the upper whisker represents the maximum value. The violin plot implements a rotated kernel density plot on each side, adding information regarding the full distribution of the measured data; the width of the violin indicates the frequency.
Fig. 2
Fig. 2. Differentially abundant taxa by village of residence and socioeconomic status.
a, b Volcano plots showing differentially abundant s-OTUs as detected by ANCOM (partially adjusted model (a) and the fully adjusted model (b). The x-axis represents the difference in mean centered log ratio (clr)-transformed abundance between groups and the y-axis represents the ANCOM W Statistic. s-OTU points are colored by level of ANCOM significance, with 0.9 being the highest level; s-OTUs in gray were not significant. c–m Boxplots of clr-transformed abundance for s-OTUs detected by ANCOM at the highest level (0.9) in association to the village of residence and socioeconomic status. The relative abundance of Prevotella copri, Dialister, Eubacterium biforme, Oscillospira, and Sutterella was increased in village C compared to villages A and B, while Bifidobacterium, Faecalibacterium prausnitzii, Alistipes putredinis, Alistipes onderdonkii, Clostridium, and Ruminococcus were depleted. In the boxplots (panels c–m), the centre line represents the median, the lower bound of the box represents the 25th percentile, the upper bound of the box represents the 75th percentile, the lowest point of the lower whisker represents the minimum value and the highest point of the upper whisker represents the maximum value. Within the study population, villages A and B represent the intermediate/high SES villages, while village C represents the lower SES village. The sample size in each village was 47, 59, and 70, respectively.
Fig. 3
Fig. 3. Household crowding, gut microbiome diversity and composition.
a Box-violin plots of microbial richness measured by the number of observed s-OTUs. b Box-violin plots of microbial α-diversity measured by Pielou’s evenness index. c Box-violin plots of microbial α-diversity, measured by the phylogenetic-based metric Faith’s PD. P-value for the difference in fecal α-diversity according to household crowding, as measured by the number of observed s-OTUs (p = 0.017), Pielou’s evenness index (p = 0.037), and p = 0.028 for Faith’s PD. Pairwise comparisons: The number of observed s-OTUs: lowest vs. highest tertiles p = 0.024. Pielou’s evenness index: the lowest vs. middle tertiles and the middle vs. highest tertile (p = 0.039 for both comparisons), and Faith’s PD lowest vs. highest tertiles p = 0.02. d Non-parametric Spearman’s correlation coefficient r = 0.22, p = 0.004) of the correlation between household crowding index and bacterial richness. e Principal coordinate analysis of the JSD notably different across fluctuating household crowding tertiles (p = 0.001). f Box-violin plots of the mean JSD distances in association with household crowding, significantly different with dissimilarities in household crowding (lowest vs. middle tertile (p = 0.001) and lowest vs. highest tertiles (p < 0.001). Household crowding index was calculated as the number of people living in the household by the number of rooms in the household. The variable was categorized by tertiles. In the box-violin plots (panles a, b, c, f), the centre line represents the median value, the lower bound of the box represents the 25th percentile, the upper bound of the box represents the 75th percentile, the lowest point of the lower whisker represents the minimum value and the highest point of the upper whisker represents the maximum value. The violin plot implements a rotated kernel density plot on each side, adding information regarding the full distribution of the measured data; the width of the violin indicates the frequency.
Fig. 4
Fig. 4. Differentially abundant taxa by village of residence and socioeconomic status.
a–c Volcano plots showing differentially abundant s-OTUs as detected by ANCOM, in all three study villages (a) and stratified by village; villages A and B [higher SES] (b), and village C [low SES] (c). The x-axis represents the difference in mean centered log ratio (clr)-transformed abundance between groups and the y-axis represents the ANCOM W Statistic. s-OTU points are colored by level of ANCOM significance, with 0.9 being the highest level; s-OTUs in gray were not significant. d, e Boxplots of clr-transformed abundance of s-OTUs significantly associated with the household crowding index in villages A and B [higher SES] (d) and in village C [low SES] (e), adjusted for sex, age, and village of residence. Tertiles of crowding index were categorized as low, middle and high household crowding tertiles. In the boxplots (panles d, e), the centre line represents the median, the lower bound of the box represents the 25th percentile, the upper bound of the box represents the 75th percentile, the lowest point of the lower whisker represents the minimum value and the highest point of the upper whisker represents the maximum value. Within the study population, villages A and B represent the intermediate/high SES villages, while village C represents the lower SES village. The sample size in each village was 47, 59, and 70, respectively.
Fig. 5
Fig. 5. Differentially abundant inferred metabolic functions by village of residence and socioeconomic status.
a Principal coordinate analysis of the Bray-Curtis dissimilarity notably different among children from villages A and B vs. village C (p = 0.001). b–d Differentially abundant inferred metabolic pathways detected by ANCOM in association with village (SES) and with household crowding. Within the study population, villages A and B represent the intermediate/high SES villages, while village C represents the lower SES village. The sample size in each village was 47, 59, and 70, respectively. In the box-violin plots (panles b–d), the centre line represents the median value, the lower bound of the box represents the 25th percentile, the upper bound of the box represents the 75th percentile, the lowest point of the lower whisker represents the minimum value and the highest point of the upper whisker represents the maximum value. The violin plot implements a rotated kernel density plot on each side, adding information regarding the full distribution of the measured data; the width of the violin indicates the frequency.

References

    1. Spor A, Koren O, Ley R. Unravelling the effects of the environment and host genotype on the gut microbiome. Nat. Rev. Microbiol. 2011;9:279–290. - PubMed
    1. Koenig JE, et al. Succession of microbial consortia in the developing infant gut microbiome. Proc. Natl Acad. Sci. USA. 2011;108:4578–4585. - PMC - PubMed
    1. Derrien M, Alvarez AS, de Vos WM. The gut microbiota in the first decade of life. Trends Microbiol. 2019;27:997–1010. - PubMed
    1. Zhong H, et al. Impact of early events and lifestyle on the gut microbiota and metabolic phenotypes in young school-age children. Microbiome. 2019;7:2. - PMC - PubMed
    1. Hollister EB, et al. Structure and function of the healthy pre-adolescent pediatric gut microbiome. Microbiome. 2015;3:36. - PMC - PubMed

Publication types

Substances