

Modeling energy depletion in rat livers using Nash equilibrium metabolic pathway analysis
- PMID: 35241684
- PMCID: PMC8894355
- DOI: 10.1038/s41598-022-06966-2
Modeling energy depletion in rat livers using Nash equilibrium metabolic pathway analysis
Abstract
The current gold standard of Static Cold Storage (SCS), which is static cold storage on ice (about + 4 °C) in a specialized media such as the University of Wisconsin solution (UW), limits storage to few hours for vascular and metabolically active tissues such as the liver and the heart. The liver is arguably the pinnacle of metabolism in human body and therefore metabolic pathway analysis immediately becomes very relevant. In this article, a Nash Equilibrium (NE) approach, which is a first principles approach, is used to model and simulate the static cold storage and warm ischemia of a proposed model of liver cells. Simulations of energy depletion in the liver in static cold storage measured by ATP content and energy charge are presented along with comparisons to experimental data. In addition, conversion of Nash Equilibrium iterations to time are described along with an uncertainty analysis for the parameters in the model. Results in this work show that the Nash Equilibrium approach provides a good match to experimental data for energy depletion and that the uncertainty in model parameters is very small with percent variances less than 0.1%.
© 2022. The Author(s).
Conflict of interest statement
The authors declare no competing interests.
Figures


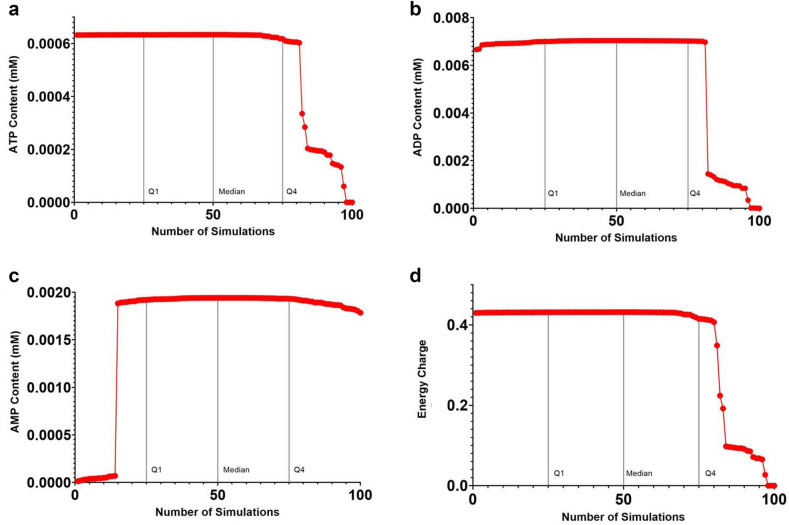
 NE simulation iterations,
  least-squares fit of NE iterations,
  Berendsen et al.,
  Bruinsma et al., (b) ADP content (mM), (c) AMP content (mM), (d) Energy charge.
 NE simulation iterations,
  least-squares fit of NE simulation iterations.
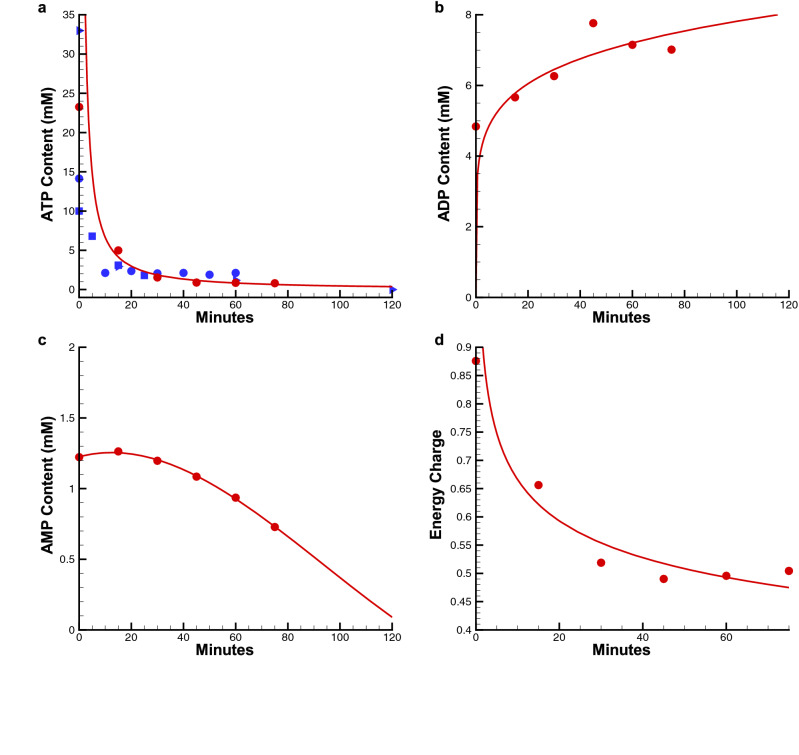
 NE simulation iterations,
  least-squares fit of NE iterations,
  Kamiike et al. (rat liver),
  Bore et al. (rat kidney),
  Harrison et al. (rat heart), (b) ADP content (mM), (c) AMP content (mM), (d) Energy charge.
References
-
- http://www.unos.org/. 2020
-
- Giwa S, Lewis JK, Alvarez L, Langer R, Roth AE, Church GM, Markmann JF, Sachs DH, Chandraker A, Wertheim JA, Rothblatt M, Boyden ES, Eidbo E, Lee WPA, Pomahac B, Brandacher G, Weinstock DM, Elliott G, Nelson D, Acker JP, Uygun K, Schmalz B, Weegman BP, Tocchio A, Fahy GM, Storey KB, Rubinsky B, Bischof J, Elliott JAW, Woodruff TK, Morris GJ, Demirci U, Brockbank KGM, Woods EJ, Ben RN, Baust JG, Gao D, Fuller B, Rabin Y, Kravitz DC, Taylor MJ, Toner M. The promise of organ and tissue preservation to transform medicine. Nat. Biotechnol. 2017;35:530–542. doi: 10.1038/nbt.3889. - DOI - PMC - PubMed
-
- Bruinsma BG, Avruch JH, Sridharan GV, Weeder PD, Jacobs ML, Crisalli K, Amundsen B, Porte RJ, Markmann JF, Uygun K, Yeh H. Peritransplant energy changes and their correlation to outcome after human liver transplantation. Transplantation. 2017;101:1637–1644. doi: 10.1097/TP.0000000000001699. - DOI - PMC - PubMed
Publication types
MeSH terms
Substances
Grants and funding
LinkOut - more resources
Full Text Sources
Medical
