. 2022 Mar 3;12(1):3554.
doi: 10.1038/s41598-022-07371-5.

Dynamical regulations on mobility and vaccinations for controlling COVID-19 spread

Affiliations

Dynamical regulations on mobility and vaccinations for controlling COVID-19 spread

Mevan Rajakaruna et al. Sci Rep. .

Abstract

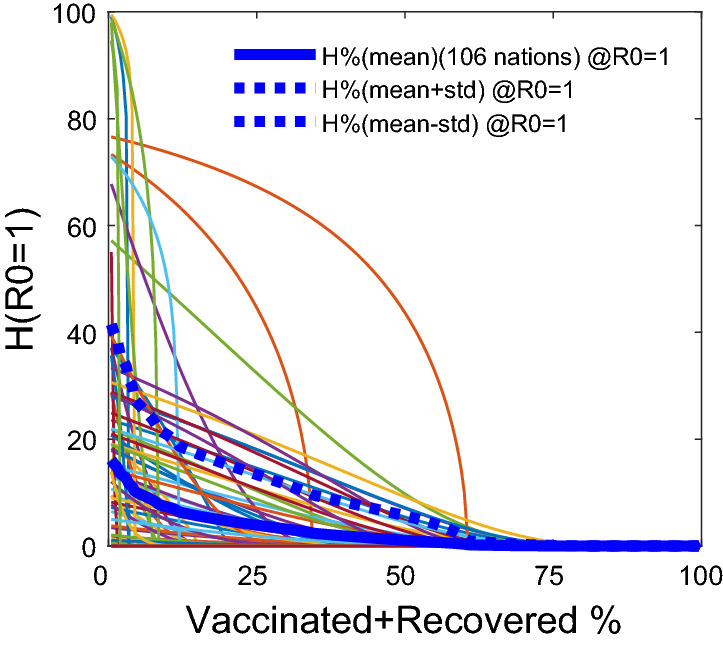
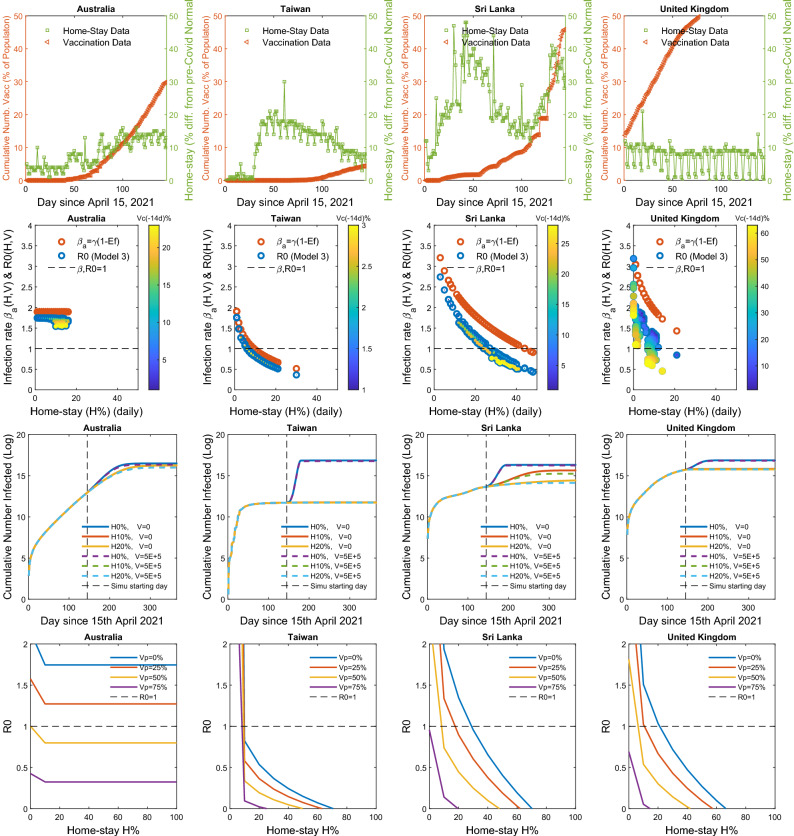
Using a system of time-dynamical equations, we investigate how daily mobility indices, such as the homestay percentage above the pre-COVID normal ([Formula: see text]; or H-forcing), and the vaccinated percentage ([Formula: see text]; or V-forcing) impact the net reproductive rate (R0) of COVID-19 in ten island nations as a prototype, and then, extending it to 124 countries worldwide. Our H- and V-forcing model of R0 can explain the new trends in 106 countries. The disease transmission can be controlled by forcing down [Formula: see text] with an enforcement of continuous [Formula: see text] in [Formula: see text] of countries with [Formula: see text] vaccinated plus recovered, [Formula: see text]. The required critical [Formula: see text] decreases with increasing [Formula: see text], dropping it down to [Formula: see text] with [Formula: see text], and further down to [Formula: see text] with [Formula: see text]. However, the regulations on [Formula: see text] are context-dependent and country-specific. Our model gives insights into forecasting and controlling the disease's transmission behaviour when the effectiveness of the vaccines is a concern due to new variants, and/or there are delays in vaccination rollout programs.


Conflict of interest statement

The authors declare no competing interests.

Figures

Figure 1
Figure 1
The World data -The net reproductive rate R0 vs. the percentages of Home-stay H% at different percentages of the population vaccinated plus recovered, Vp%: The R0 decreases with the increasing H% at Vp=0%, that is 0% is vaccinated plus recovered from the susceptible (Left panel), Vp=25%, (Middle panel) and Vp=50% (Right panel). Here, we plotted the 106 out of the 124 nations based on the estimated MHV model that explained the variation in the data of the respective nations. The 95 nations out of the 106 allowed enough variation in the degree of H% above the pre-COVID normal to make it possible to calibrate the R0 vs. H% functional relationship based on the model (Note that Vp>=Vc, where Vc is the vaccinated population percentage). The functional relationship: R0=γΨ(1-θ(H/100)k)-ε, where Ψ is the susceptible population proportion, that is, the proportion of the total population N minus the effective number out of the vaccinated, νVc, minus the number recovered, assuming ν as the likelihood that a vaccinated individuals not re-infected, or as a proxy for the average efficacy or the effectiveness of the vaccines. The R0<1 indicates the threshold below which there is a tendency for the disease going extinct. (see Supplement S1 for country-specific graphs).
Figure 2
Figure 2
The World data- Homestay H% percentages vs. the vaccinated plus recovered population percentages: The homestay H%, required at R0=1, given by the estimated MHV model, declines with the increase in the percentage Vp%, that is, the percentage vaccinated plus the recovered in the populations. The functional relationship: H(R0=1)=[(1/θ)(1-(1/(γΨ))(1+ε))](1/k), where Ψ=(1-Vp%/100). The graph is drawn based on the MHV model that explained the variations in the data in 106 out of the 124 nations.
Figure 3
Figure 3
The MHV model hypothesis, incorporating forcing by homestay H% and percentage vaccinations Vc% on disease spread dynamics, fitted to the data in four regulatory-wise contrasting island nations: Top row panel: Daily homestay H(t)% and the percentage vaccinations Vc(t)% over time: Australia: No major V-forcing nor H-forcing: Taiwan: No major V-forcing but high H-forcing, Sri Lanka: Major increase in both V-forcing and H-forcing, United Kingdom: Major increase in V-forcing and no H-forcing. Second and third row panels: The model MHV fitted to new case, C(t), and death, D(t), data, and the resulting net reproductive rate, R0(H(t),Vc(t)), over time, given in the Bottom row panel. The R0<1 indicates a tendency towards decease-extinction. The values of the model selection criterion AIC are given in Table 1. The model fitted to all 124 countries are given in the Supplement S1, with parameter values and their CI’s given in the Supplement S2.
Figure 4
Figure 4
Functional responses of R0 vs. H% and Vc% for management forecasting: Top row panel The homestay percentage H(t)% and the percentage vaccinations Vc(t)% in four contrasting island nations: Australia: showing No major V-forcing nor H-forcing: Taiwan: No major V-forcing but high H-forcing, Sri Lanka: Major increase in both V-forcing and H-forcing, United Kingdom Major increase in V-forcing and no H-forcing. Second row panel Functional relationships between the infection rate β vs. H%, and the net reproductive rate R0 vs. H%. The concave-up or-down relation is determined by the parameter k, depending on if k<>1 in the H-forcing function, which is β=γ(1-θ(H/100)k). The k=1 yields the linear relationship. The curve may turn up or down depending on the quality and the strictness of the mobility controls. The Vc% pulls the R0(H)%) curve down forcing it towards R0=1 or lower. Here, the effect Ef=θ(H/100)k, s.t. β=γ(1-Ef). Third row panel: Simulation forecasts based on the calibrated MHV model indicate how many more get infected from the status quo (i.e., as of today) for a choice of management scenarios of daily H(t)% and V(t) administered or done none. Bottom row panel The simulations further show how an increase in the percentage vaccinated plus recovered, Vp%, forces the R0 to shift lower with respect to H%. The graphs of all 124 countries are given in Supplement S1 with parameter estimates and their CI’s in Supplement S2.

References

    1. CDC . Implementation of Mitigation Strategies for Communities with Local COVID-19 Transmission. US Department of Health and Human Services; 2020. p. 2020.
    1. Unwin HJ, et al. State-level tracking of COVID-19 in the United States. Nat. Commun. 2020;11:1–9. doi: 10.1038/s41467-020-19652-6. - DOI - PMC - PubMed
    1. Vollmer MAC, et al. A sub-national analysis of the rate of transmission of COVID-19 in Italy. MedRxiv. 2020 doi: 10.1101/2020.05.05.20089359. - DOI
    1. Liu Y, Gayle AA, Wilder-Smith A, Rocklov J. The reproductive number of COVID-19 is higher compared to SARS coronavirus. J. Travel Med. 2020;27:1–4. - PMC - PubMed
    1. Liu Y, Rocklov J. The reproductive number of the Delta variant of SARS-CoV-2 is far higher compared to the ancestral SARS-CoV-2 virus. J. Travel Med. 2021;28:1–3. doi: 10.1093/jtm/taab124. - DOI - PMC - PubMed

Publication types

MeSH terms

Substances