. 2022 Jun;6(6):782-795.
doi: 10.1038/s41562-022-01301-1. Epub 2022 Mar 3.

A brain-based general measure of attention

Affiliations

A brain-based general measure of attention

Kwangsun Yoo et al. Nat Hum Behav. 2022 Jun.

Abstract

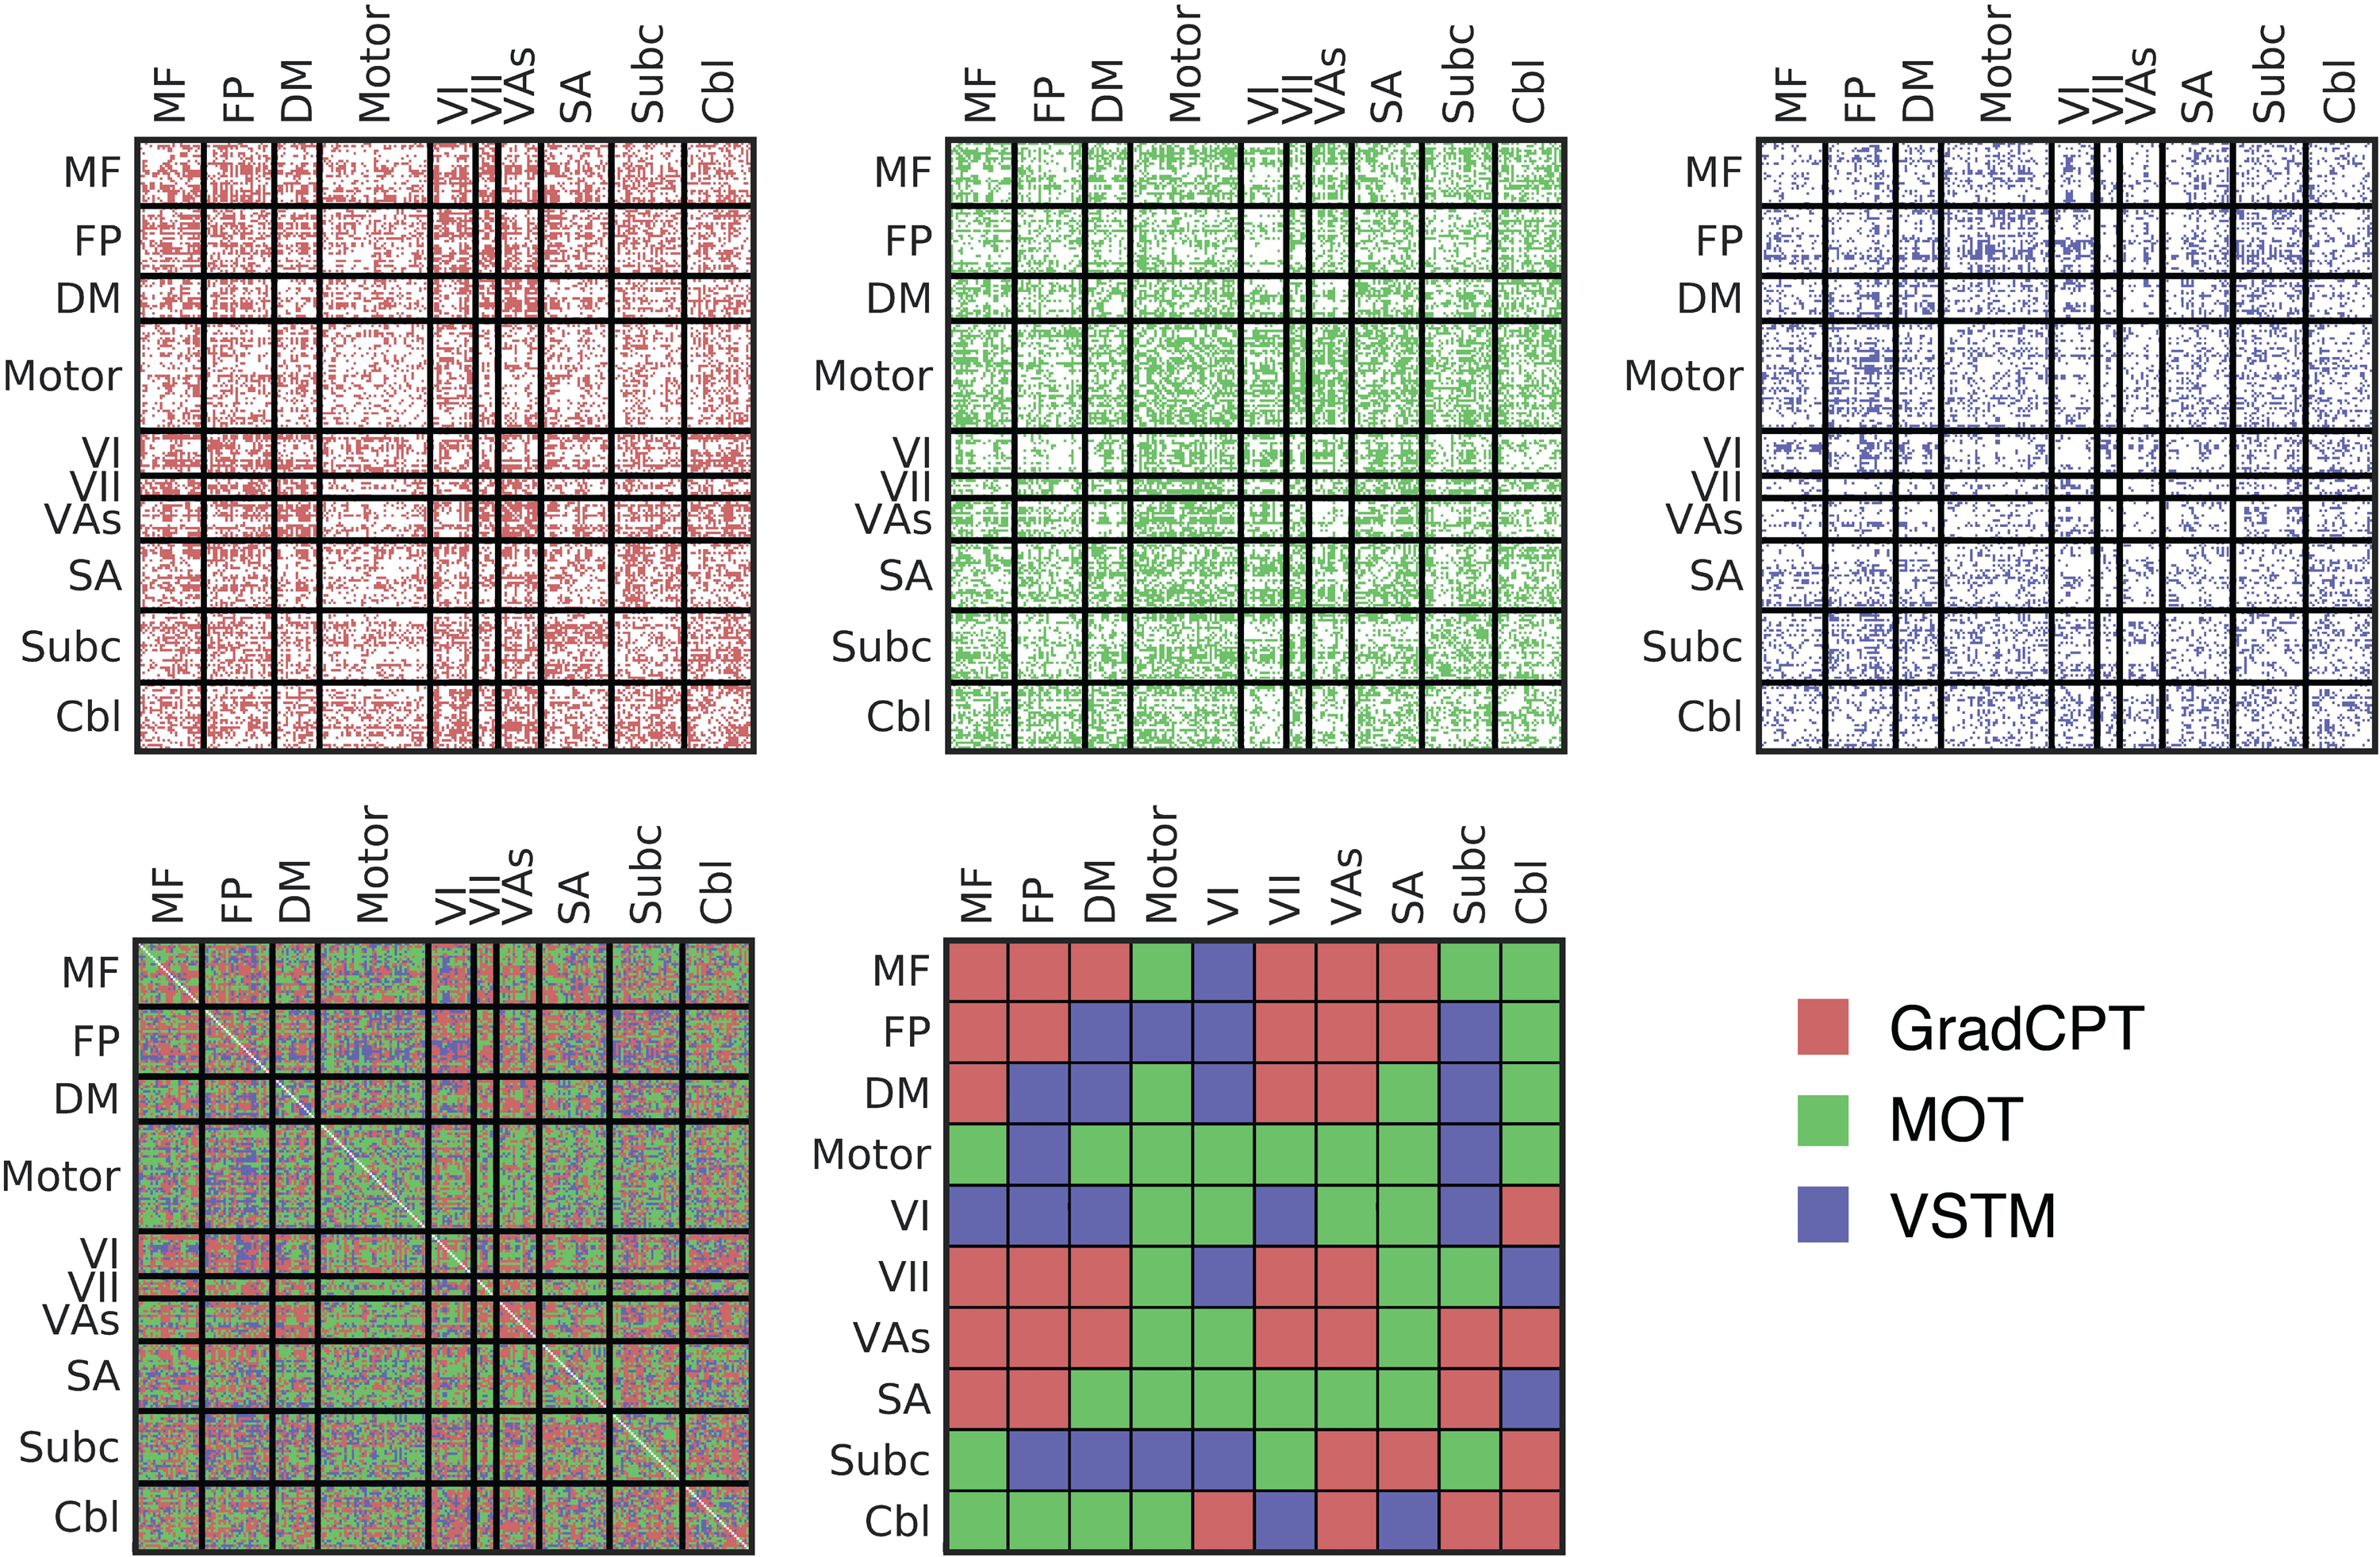
Attention is central to many aspects of cognition, but there is no singular neural measure of a person's overall attentional functioning across tasks. Here, using original data from 92 participants performing three different attention-demanding tasks during functional magnetic resonance imaging, we constructed a suite of whole-brain models that can predict a profile of multiple attentional components (sustained attention, divided attention and tracking, and working memory capacity) for novel individuals. Multiple brain regions across the salience, subcortical and frontoparietal networks drove accurate predictions, supporting a common (general) attention factor across tasks, distinguished from task-specific ones. Furthermore, connectome-to-connectome transformation modelling generated an individual's task-related connectomes from rest functional magnetic resonance imaging, substantially improving predictive power. Finally, combining the connectome transformation and general attention factor, we built a standardized measure that shows superior generalization across four independent datasets (total N = 495) of various attentional measures, suggesting broad utility for research and clinical applications.


Conflict of interest statement

Competing interests

Authors declare no competing interests.

Figures

Extended Data Fig. 1
Extended Data Fig. 1. Predictive anatomy of three task-based CPMs
A. The scale bar in gradCPT, MOT and VSTM represents the relative ratio of predictive functional connections to all possible number of functional connections between networks with a sign representing whether the connection is in a positive or negative network. The scale bar in overlap represents the actual number of predictive functional connections with a sign representing whether the connection is in a positive or negative network. GradCPT: gradual-onset continuous performance task, MOT: multiple object tracking, and VSTM: visual short-term memory. MF: medial-frontal network, FP: frontoparietal network, DM: default mode network, VI: visual I, VII: visual II, VAs: visual association, SA: salience network, Subc: subcortex, Cbl: cerebellum. B. The number of predictive connections of three task-based CPMs in positive and negative networks.
Extended Data Fig. 2
Extended Data Fig. 2. Cross-prediction results of five common attention factor CPMs
A. Cross-prediction results when models were applied to predict the common attention factor from different fMRI data. Models’ prediction accuracies were assessed by prediction q2 and correlation r between observed and predicted common factor measures. P values of significance were obtained using 1,000 permutations and corrected for all 5×5 tests (***: p<0.001, **: p<0.01, *: p<0.05, and ~: p<0.1). Rows represent different fMRI data used to predict a common attention factor used in model construction, and columns represent the same but in model validation. B. Cross-prediction results, taking into account shared variance (the common factor) between task behaviors. Models’ prediction accuracies were assessed by partial correlation between observed and predicted behavior scores while controlling for the shared variance. P values of significance were obtained using 1,000 permutations and corrected for all 5×9 tests (***p<0.001, **: p<0.01, *: p<0.05, and ~: p<0.1). Rows represent different fMRI data used to predict a common attention factor used in model construction, and columns represent combinations of fMRI data and behavior scores used in model validation. GradCPT: gradual-onset continuous performance task, MOT: multiple object tracking, and VSTM: visual short-term memory.
Extended Data Fig. 3
Extended Data Fig. 3. A similarity of individual behaviours between different tasks
The similarity was assessed by Pearson’s correlation of individual performances between attention tasks. Individual behaviors were significantly correlated between every pair of tasks. GradCPT: gradual-onset continuous performance task, MOT: multiple object tracking, and VSTM: visual short-term memory.
Extended Data Fig. 4
Extended Data Fig. 4. Cross-prediction results of task-specific CPMs
A. Cross-prediction results, taking into account shared variance between task behaviors. Models’ prediction accuracies were assessed by partial correlation between observed and predicted behavior scores while controlling for the shared variance. P value was obtained using 1,000 permutations and corrected for multiple tests ***: p<0.001, **: p<0.01, *: p<0.05, and ~: p<0.1). Rows represent combinations of fMRI data and behavior scores used in model construction, and columns represent combinations of fMRI data and behavior scores used in model validation. GradCPT: gradual-onset continuous performance task, MOT: multiple object tracking, and VSTM: visual short-term memory. B. Cross-prediction results when models were applied to predict the common attention factor from different fMRI data. Models’ prediction accuracies were assessed by correlation between observed and predicted common factor. P value was obtained using 1,000 permutations and corrected for all 9×5 tests (***: p<0.001, **: p<0.01, *: p<0.05, and ~: p<0.1). Rows represent combinations of fMRI data and behavior scores used in model construction, and columns represent different fMRI data used to predict a common attention factor used in model validation.
Extended Data Fig. 5
Extended Data Fig. 5. Cross-prediction using connectivity between the frontoparietal (FP, 2), visual II (VII, 6), salience (SA, 8), subcortical (Subc, 9), cerebellar (Cbl, 10) networks
Prediction of a model using connectivity between the medial-frontal (1), default mode (3), motor (4), visual I (5), visual association (7) networks was also obtained as a control. A. Rows represent combinations of networks (indicated by numbers) used in each model. Models’ prediction accuracies were assessed by correlating model-predicted and observed behavioral scores. B. Prediction performance of each network obtained by averaging all models that used the network in A. C. The same result as A, but model accuracies were assessed by q2. D. Prediction performance of each network obtained by averaging all models that used the network in C. GradCPT: gradual-onset continuous performance task, MOT: multiple object tracking, and VSTM: visual short-term memory.
Extended Data Fig. 6
Extended Data Fig. 6. Similarity between C2C model-generated task connectomes and empirical task connectomes
Error bar represents standard deviation from 1,000 iterations. A and C represent a spatial similarity between two connectomes assessed by Pearson’s correlation. Darker bars represent the similarity between empirical task and generated task connectomes, and lighter bars represent the similarity between empirical task and empirical rest connectomes. The higher similarity of the generated connectome indicates that the C2C model accurately generates the target task connectome from the rest connectome. B and D represent root mean square (RMS) difference between two connectomes. The smaller difference of the generated connectome indicates that the C2C model accurately generates the target task connectome from the rest connectome. In a box-whisker plot, a box covers the first to third quartile (q1 and q3, respectively) of the data, and a center line represents the median. A red dot represents the mean. Whisker covers approximately 99.3% of data (±2.7standraddeviation), extended to the most extreme point that is not an outlier. A data point is considered an outlier if it is greater than q3+1.5(q3q1) or less than q11.5(q3q1). GradCPT: gradual-onset continuous performance task, MOT: multiple object tracking, and VSTM: visual short-term memory. *: p<0.001 from 1,000 permutations
Extended Data Fig. 7
Extended Data Fig. 7. The general attention connectome lookup table
Out of a total 30,135 edges, 10,885 (36.1%) edges were pulled from gradCPT, 12,542 (41.6%) edges were from MOT, and 6,708 (22.3%) were from VSTM. The Ratio map was obtained based on All map. In each within- or between-network element in Ratio, the number of edges in the element for each task was counted and normalized by the total number of edges of each task. A task with the highest normalized value was assigned.
Extended Data Fig. 8
Extended Data Fig. 8. Scatter plots of predicted and observed attention scores in four external datasets
Three models, the general attention model and two single task models (model 1 and 4 in Table 1) were trained within the internal dataset and then applied to rest connectomes in the four datasets. If a fitted line closely passes the origin (0,0) with a positive slope (staying within white quadrants), the model could be considered successfully predicting actual attentional abilities. There was no constraint on intercepts in fitting a line. The general model best generalized to predict various attentional measures in four independent external datasets.
Extended Data Fig. 9
Extended Data Fig. 9. Prediction error, assessed by mean square error (MSE), of the general attention model in four independent datasets
The general model significantly reduced prediction error (assessed by MSE) compared to null models in four datasets. In all datasets, the general attention model produced the lowest prediction error among all models tested. ***: p<0.001, **: p<0.01, *: p<0.05, and ~: p<0.1 from 1,000 permutations
Figure 1.
Figure 1.. Prediction accuracy of nine CPMs.
Rows represent the fMRI data used in model construction and prediction, and columns represent the target attention task. Models’ prediction accuracies were assessed by correlating model-predicted behavioral scores and observed scores. P values were obtained using 1,000 permutations (corrected for nine tests). GradCPT: gradual-onset continuous performance task, MOT: multiple object tracking, and VSTM: visual short-term memory.
Figure 2.
Figure 2.. Cross-prediction results of nine original CPMs across all cognitive states and attention tasks.
A. Models’ prediction accuracies were assessed by prediction q2. Negative q2 was set to zero in this figure. Rows represent combinations of fMRI data and behavior scores used in model construction, and columns represent combinations of fMRI data and behavior scores used in model validation. On-diagonal elements represent the nine within-task prediction results (corresponding to Figure 1) and off-diagonal elements represent the cross-task predictions. For example, when a CPM trained using VSTM fMRI to predict VSTM performance was applied to gradCPT fMRI to predict gradCPT performance, prediction performance was q2=0.22 (and r=0.52 in B). Similarly, when a CPM trained using rest fMRI to predict VSTM performance was applied to movie fMRI to predict MOT performance, performance was q2<0 (and r=0.22 in B). The models with task fMRI successfully generalized to different attention tasks, except CPMs between MOT and VSTM (the top left 3 by 3 submatrix), and the models with movie fMRI also generalized to different tasks to lesser degrees (the bottom right 3 by 3 submatrix). P values for significance were obtained using 1,000 permutations and corrected for multiple tests (***: p<0.001; **: p<0.01; *: p<0.05; ~: p<0.1). GradCPT: gradual-onset continuous performance task, MOT: multiple object tracking, and VSTM: visual short-term memory. B. The same result as A, but the models’ prediction accuracies were assessed by correlation r between model-predicted and observed behavioral scores across individuals.
Figure 3.
Figure 3.. Cross-prediction results of five CPMs trained to predict a common attention factor using different fMRI data.
A. All models were trained to predict a shared variance (a common attention factor) in three task behaviors but tested to predict individual behaviors in each task from different fMRI data. Models’ prediction accuracies were assessed by prediction q2 and correlation r between observed and predicted common factor measures. P values of significance were obtained using 1,000 permutations and corrected for all 5×5 tests (***: p<0.001, **: p<0.01, *: p<0.05, and ~: p<0.1). The models with task fMRI successfully generalized to predict different task behaviors when the models were applied to task fMRI (the top left 3 by 3 submatrix). B. Predictive functional connections of the common attention factor. The scale bar represents the relative ratio of predictive functional connections to all possible number of connections between networks with a sign representing whether the connection is in a positive or negative network. GradCPT: gradual-onset continuous performance task, MOT: multiple object tracking, and VSTM: visual short-term memory. MF: medial-frontal network, FP: frontoparietal network, DM: default mode network, VI: visual I, VII: visual II, VAs: visual association, SA: salience network, Subc: subcortex, Cbl: cerebellum.
Figure 4.
Figure 4.. Cross-prediction results of CPMs trained to predict task-specific variance.
A&B. Models’ prediction accuracies were assessed by prediction q2 (panel A) and correlation r (panel B). P value was obtained using 1,000 permutations and corrected for multiple tests (***: p<0.001, **: p<0.01, *: p<0.05, and ~: p<0.1). Rows represent combinations of fMRI data and behavior scores used in model construction, and columns represent combinations of fMRI data and behavior scores used in model validation. GradCPT: gradual-onset continuous performance task, MOT: multiple object tracking, and VSTM: visual short-term memory. C. Predictive anatomy of task-specific CPMs. MF: medial-frontal network, FP: frontoparietal network, DM: default mode network, VI: visual I, VII: visual II, VAs: visual association, SA: salience network, Subc: subcortex, Cbl: cerebellum.
Figure 5.
Figure 5.. Network contribution on CPMs’ prediction performance.
Three CPMs were trained and tested using task fMRI (connectivity edges survived after lesioning each network [A], connectivity edges within each network [B], and connectivity edges connecting each network to the other nine networks [C]) to predict behaviors in three tasks, gradCPT, MOT, and VSTM, respectively. The prediction performances were averaged to summarize contribution of each network. A. Cross-prediction after lesioning a network. B. Cross prediction using connectivity within each network. C. Cross-prediction using connectivity of each network to the other nine networks. Significance was obtained from 1,000 permutations (***: p<0.001, **: p<0.01, and * : p<0.05). In a box-whisker plot, a box covers the first to third quartile (q1 and q3, respectively) of the data, and a center line represents the median. A red dot represents the mean. Whisker covers approximately 99.3% of data (±2.7standrad deviation), extended to the most extreme point that is not an outlier. A data point is considered an outlier if it is greater than q3+1.5(q3q1) or less than q11.5(q3q1). GradCPT: gradual-onset continuous performance task, MOT: multiple object tracking, and VSTM: visual short-term memory. MF: medial-frontal network, FP: frontoparietal network, DM: default mode network, VI: visual I, VII: visual II, VAs: visual association, SA: salience network, Subc: subcortex, Cbl: cerebellum.
Figure 6.
Figure 6.. Prediction of individual behaviors by applying the original CPMs trained using task fMRI to rest fMRI with a rest-to-task connectome transformation using C2C modeling.
A. Prediction performance was assessed by prediction q2, and negative values were set to zero (i.e., q2=0 for task-to-rest prediction without C2C modeling in all three tasks). Darker bars represent the behavior prediction accuracy with C2C-generated task connectomes. Lighter bars represent the behavior prediction accuracy with empirical rest connectomes. A darker bar in ‘Task-to-Rest’ represents the behavior prediction accuracy of a model trained using empirical task connectome when the model is applied to the C2C-generated task connectome. A lighter bar in ‘Task-to-Rest’ represents the behavior prediction of a model trained using empirical task connectome when the model is applied to the empirical rest connectome. The task connectomes generated by C2C models from rest data significantly better predicted individual behaviors than empirical rest connectome in all three attention tasks. A darker bar in ‘Rest-to-Rest’ represents the prediction of a model trained using empirical rest connectome when the model is applied to the C2C-generated task connectome. *: p<0.01 from 1,000 iterations. B. The same result, but prediction performance was assessed by correlation r. In a box-whisker plot, a box covers the first to third quartile (q1 and q3, respectively) of the data, and a center line represents the median. Whisker covers approximately 99.3% of data (±2.7standraddeviation), extended to the most extreme point that is not an outlier. A data point is considered an outlier if it is greater than q3+1.5(q3q1) or less than q11.5(q3q1). GradCPT: gradual-onset continuous performance task, MOT: multiple object tracking, and VSTM: visual short-term memory. *: p<0.05 from 1,000 iterations.
Figure 7.
Figure 7.. The general attention model in internal validation.
A. Behavior prediction by the general attention model applied to a rest connectome. Each task name in x-axis represents a single task-based CPM. The general attention model and three CPMs predict individual behaviors from the rest connectome. Behavior prediction performances were averaged for three tasks prediction (predicting gradCPT, MOT, and VSTM scores). The general attention model significantly better predicted task behaviors than all task CPMs. *:p<0.001 from 1,000 permutations. In a box-whisker plot, a box covers the first to third quartile (q1 and q3, respectively) of the data, and a center line represents the median. Whisker covers approximately 99.3% of data (±2.7standraddeviation), extended to the most extreme point that is not an outlier. A data point is considered an outlier if it is greater than q3+1.5(q3q1) or less than q11.5(q3q1). GradCPT: gradual-onset continuous performance task, MOT: multiple object tracking, and VSTM: visual short-term memory. B. Predictive anatomy of the general attention model. The scale bar represents the relative ratio of predictive functional connections to all possible number of functional connections between networks with a sign representing whether the connection is in a positive or negative network. MF: medial-frontal network, FP: frontoparietal network, DM: default mode network, VI: visual I, VII: visual II, VAs: visual association, SA: salience network, Subc: subcortex, Cbl: cerebellum.
Figure 8.
Figure 8.. The general attention model generalizes to predict different attentional measures in four independent datasets.
Prediction performance was assessed by prediction q2 and r. Negative q2 values were set to zero. In q2 assessment, the general model (yellow) successfully generalized in four different datasets, while task or rest-based CPMs and saCPM predicting gradCPT did not in any dataset. The general model accurately predicted individuals’ actual attentional abilities observed in gradCPT, ANT, and SCPT and assessed by ADHD-RS in q2. In contrast, the CPMs trained using gradCPT or rest fMRI, or saCPM did not generalize to predict individual abilities that were assessed by different measures in the external datasets in q2 evaluation. Model prediction was considered successful if performance assessed by r and q2 is statistically significant using 1,000 permutations (***: p=<0.001, **: p<0.01, and *: p<0.05).

References

    1. Chun MM, Golomb JD & Turk-Browne NB A Taxonomy of External and Internal Attention. Annu. Rev. Psychol 62, 73–101 (2011). - PubMed
    1. Weissman DH, Roberts KC, Visscher KM & Woldorff MG The neural bases of momentary lapses in attention. Nat. Neurosci 9, 971–8 (2006). - PubMed
    1. Heinrichs RW & Zakzanis KK Neurocognitive deficit in schizophrenia: A quantitative review of the evidence. Neuropsychology 12, 426–445 (1998). - PubMed
    1. Biederman J, Newcorn J & Sprich S Comorbidity of attention deficit hyperactivity disorder with conduct, depressive, anxiety, and other disorders. Am. J. Psychiatry 148, 564–577 (1991). - PubMed
    1. Levin HS et al. Neurobehavioral outcome following minor head injury: A three-center study. J. Neurosurg 66, 234–243 (1987). - PubMed

Publication types