. 2022 Mar;7(3):434-450.
doi: 10.1038/s41564-022-01070-7. Epub 2022 Mar 3.

Cysteine dependence of Lactobacillus iners is a potential therapeutic target for vaginal microbiota modulation

Affiliations

Cysteine dependence of Lactobacillus iners is a potential therapeutic target for vaginal microbiota modulation

Seth M Bloom et al. Nat Microbiol. 2022 Mar.

Abstract

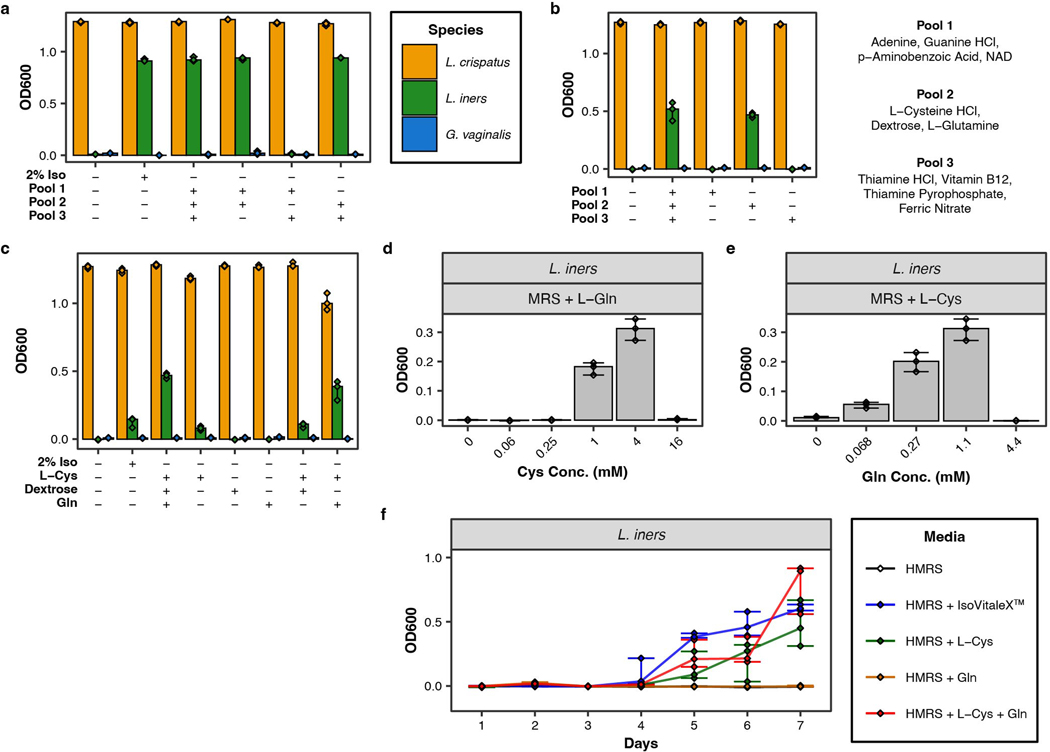
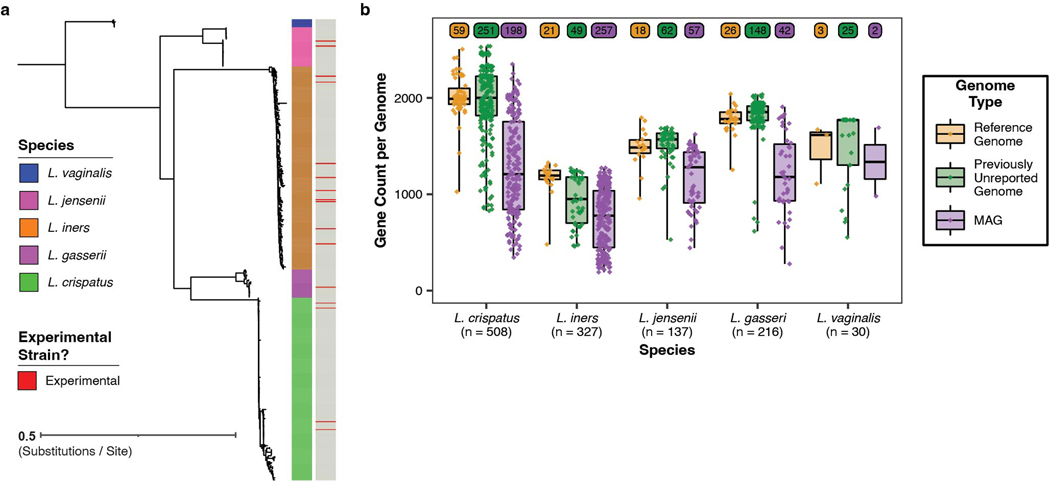
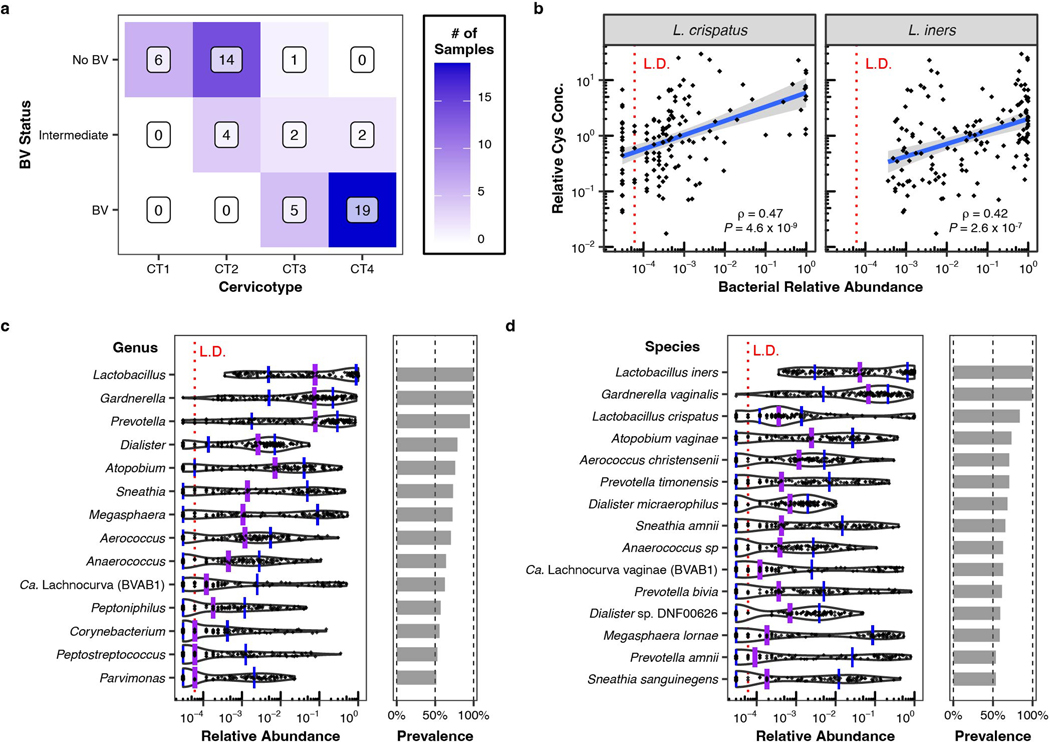
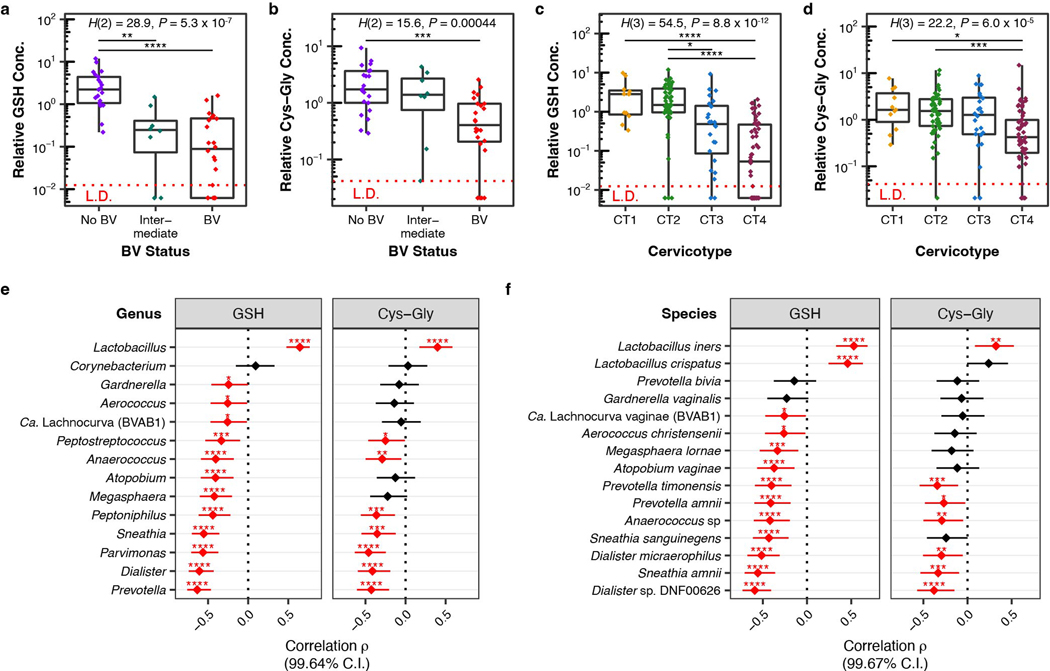
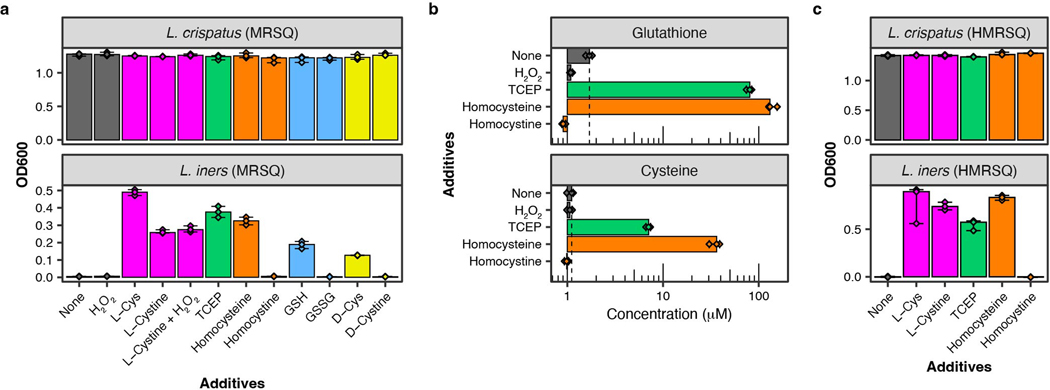
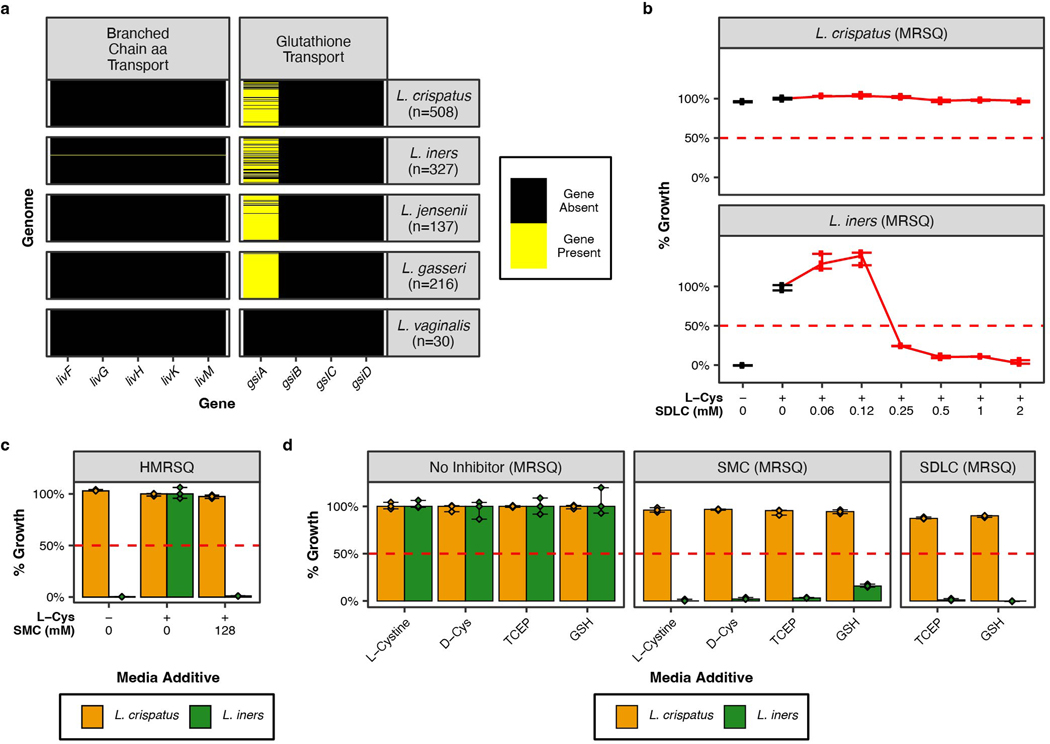
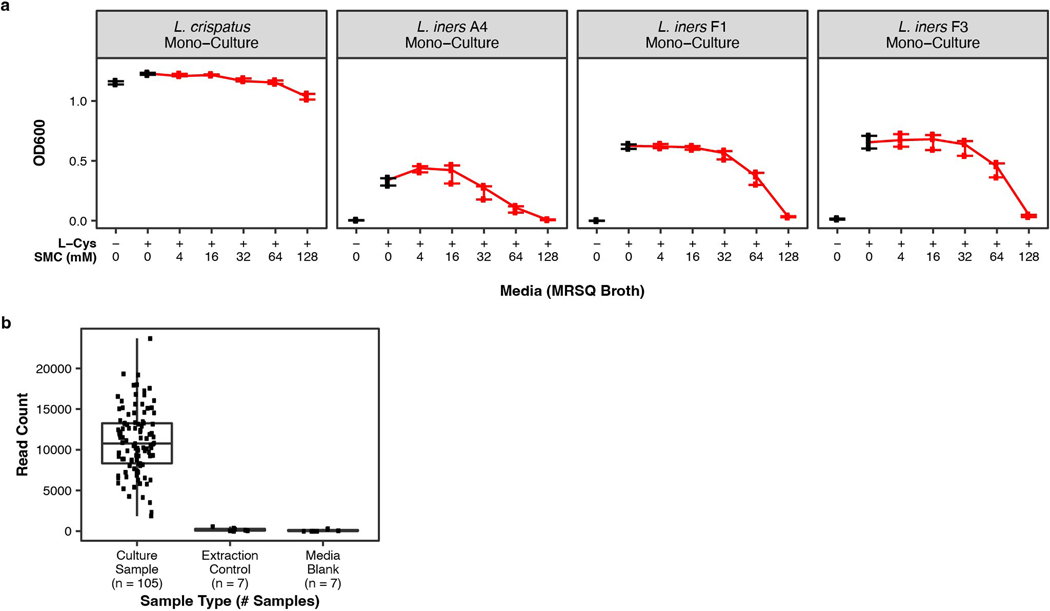
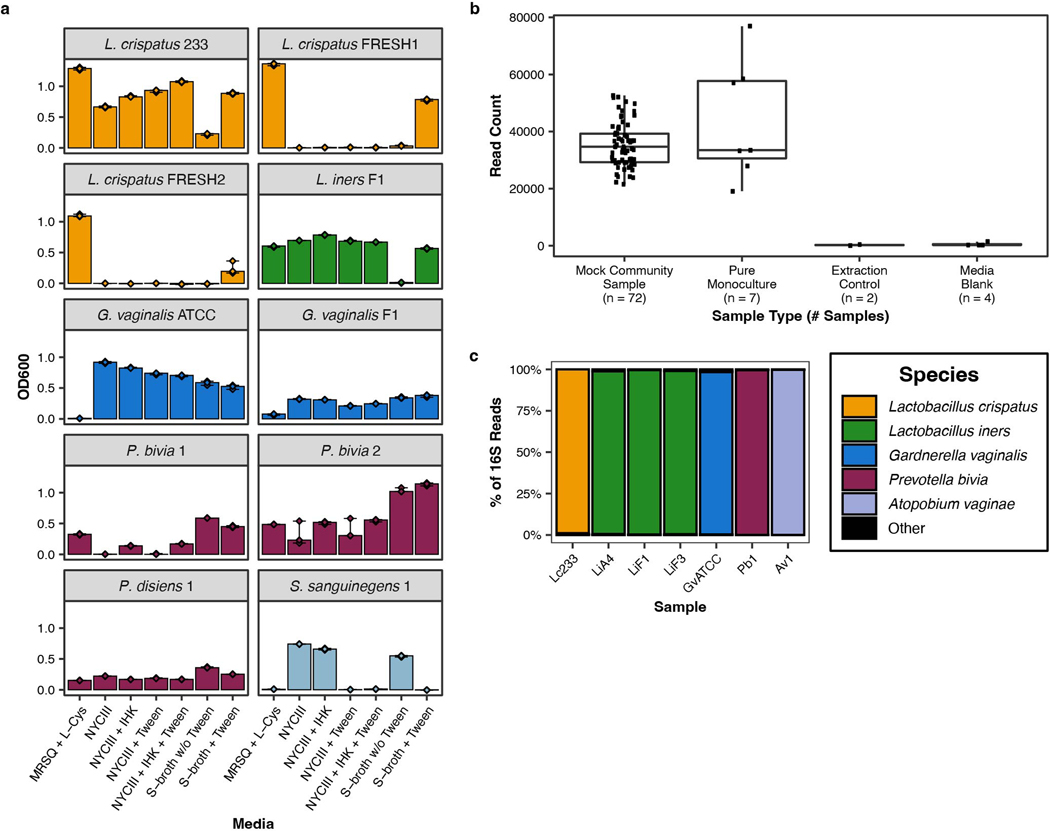
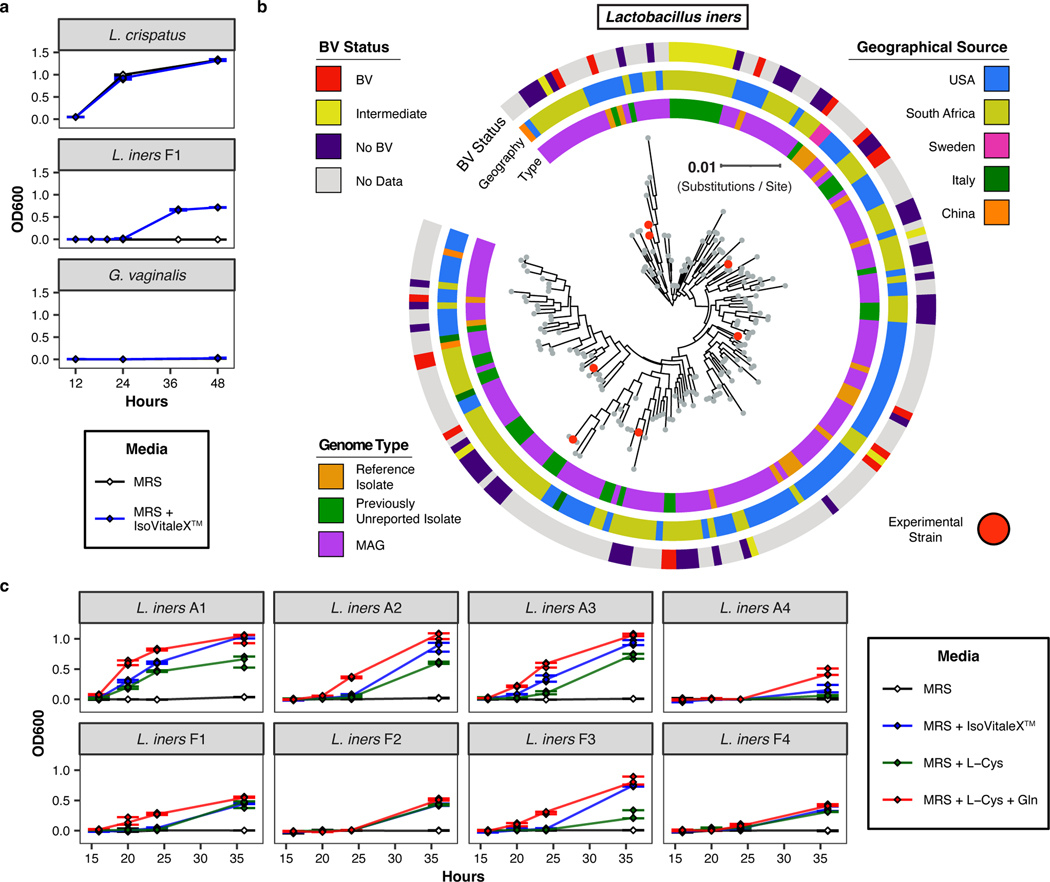
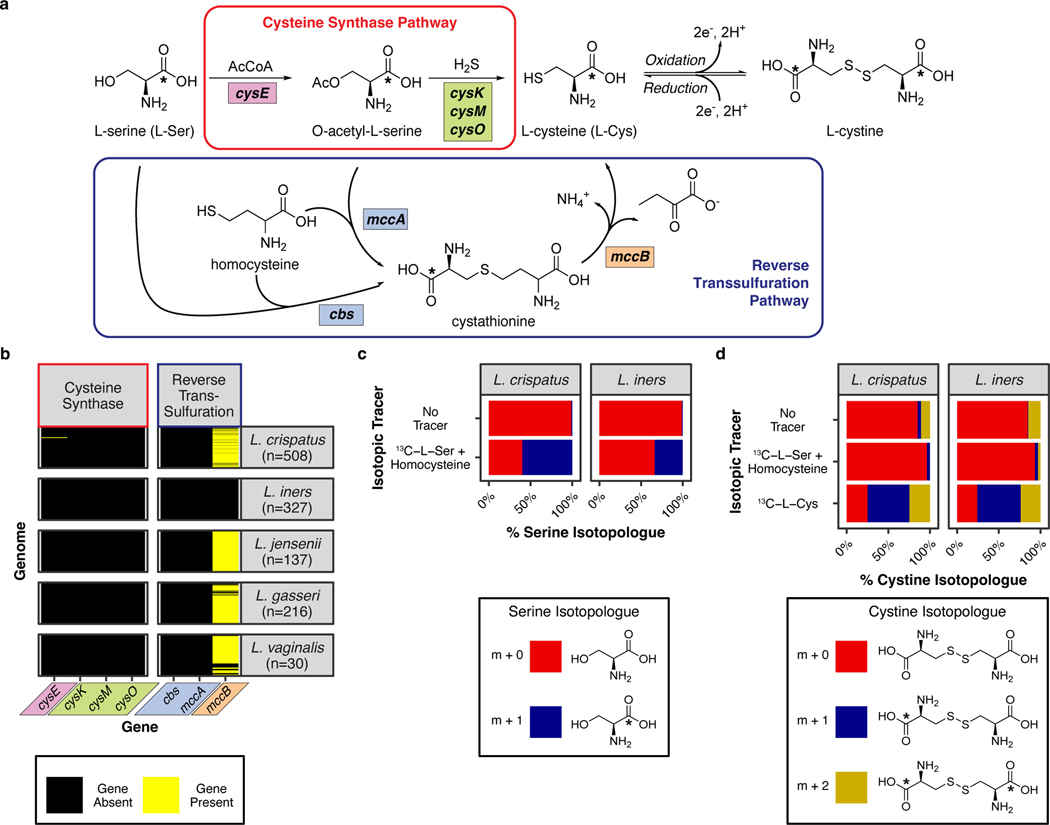
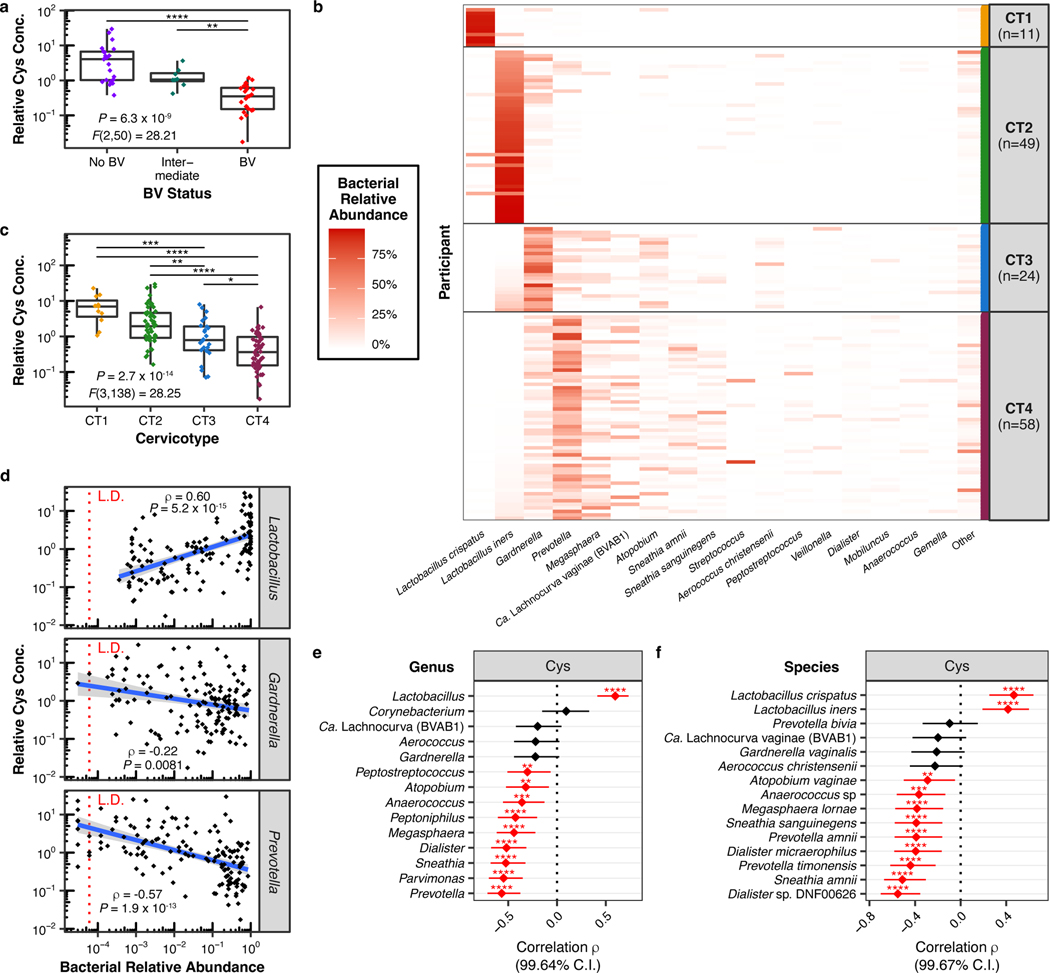
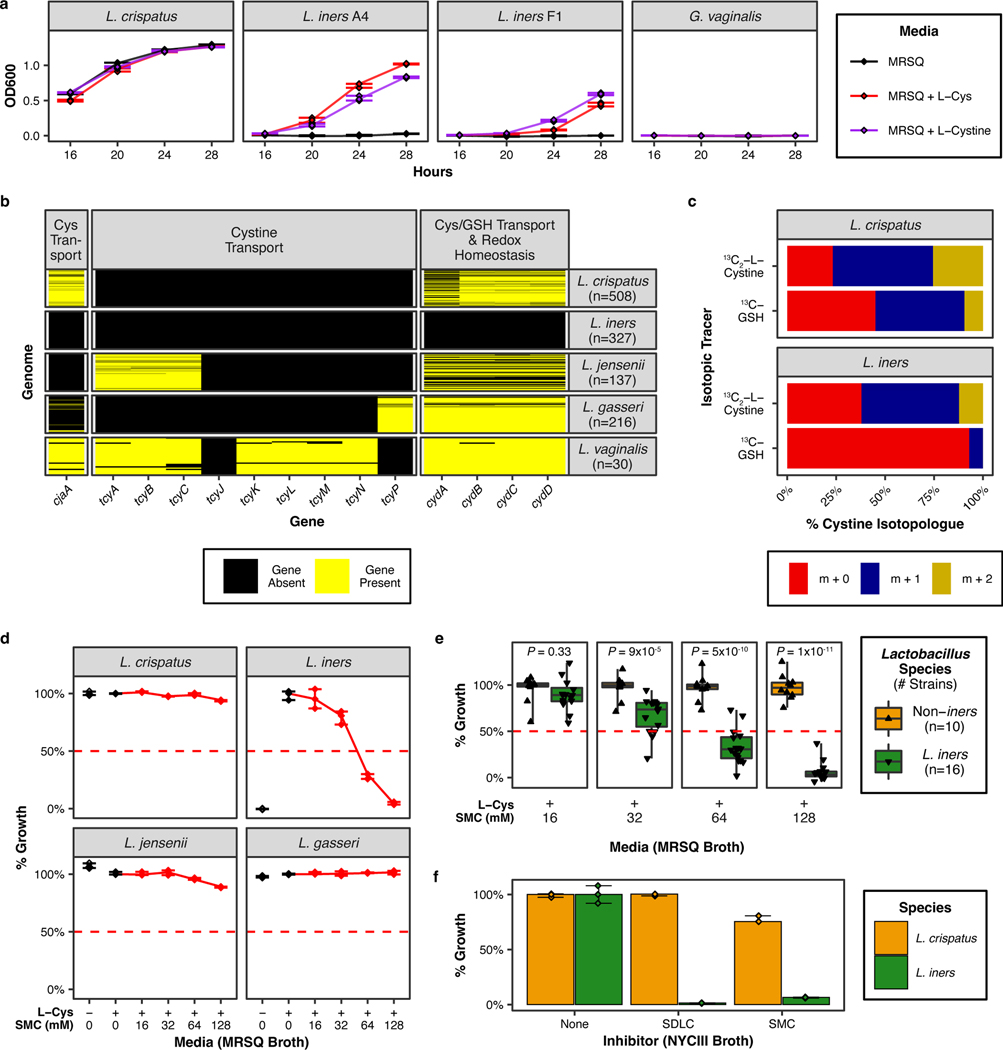
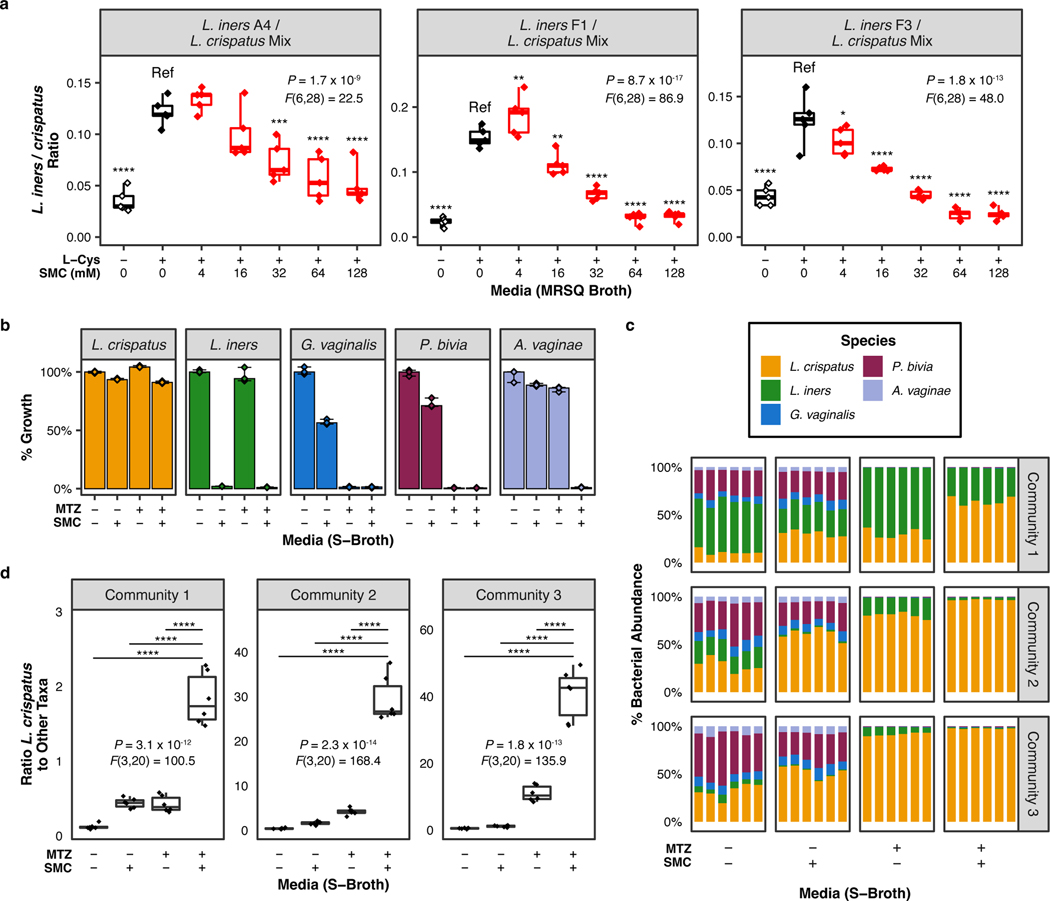
Vaginal microbiota composition affects many facets of reproductive health. Lactobacillus iners-dominated microbial communities are associated with poorer outcomes, including higher risk of bacterial vaginosis (BV), compared with vaginal microbiota rich in L. crispatus. Unfortunately, standard-of-care metronidazole therapy for BV typically results in dominance of L. iners, probably contributing to post-treatment relapse. Here we generate an L. iners isolate collection comprising 34 previously unreported isolates from 14 South African women with and without BV and 4 previously unreported isolates from 3 US women. We also report an associated genome catalogue comprising 1,218 vaginal Lactobacillus isolate genomes and metagenome-assembled genomes from >300 women across 4 continents. We show that, unlike L. crispatus, L. iners growth is dependent on L-cysteine in vitro and we trace this phenotype to the absence of canonical cysteine biosynthesis pathways and a restricted repertoire of cysteine-related transport mechanisms. We further show that cysteine concentrations in cervicovaginal lavage samples correlate with Lactobacillus abundance in vivo and that cystine uptake inhibitors selectively inhibit L. iners growth in vitro. Combining an inhibitor with metronidazole promotes L. crispatus dominance of defined BV-like communities in vitro by suppressing L. iners growth. Our findings enable a better understanding of L. iners biology and suggest candidate treatments to modulate the vaginal microbiota to improve reproductive health for women globally.


Conflict of interest statement

Author Contributions

S.M.B. and D.S.K. conceived the overall study and guided it throughout with input from B.M.W., E.P.B., and C.M.M.; S.M.B., N.A.M., and J.K.R. performed primary bacterial isolations; S.M.B., N.A.M., J.F.F., B.M.W., A.J.M., X.W., N.C., and C.M.M. contributed to media design and production and/or bacterial growth and inhibition experiments; B.M.W. and E.P.B. synthesized labeled glutathione; B.M.W., S.M.B., N.A.M., and E.P.B. designed, performed, and/or analyzed measurements of media composition and isotopic tracing experiments; S.M.B., N.A.M., and J.X. performed nucleic acid extractions and sequencing; S.M.B. performed bacterial 16S rRNA gene sequencing analysis; M.R.H. and D.A.R. performed bacterial isolate genomic and metagenomic sequence analysis and assembly, genome catalog development, and phylogenetic reconstructions; S.M.B., M.R.H., F.A.H., and B.M.W. conceived and/or performed genomic pathway analysis; S.M.B. and A.B.A. performed analysis of in vivo metabolite data; K.L.D., M.D., T.G., F.X.C., T.N., N.I., S.M.B., N.X., M.S.G., and D.S.K. contributed to clinical cohort design, cohort performance, and/or sample acquisition and processing efforts; S.M.B., B.M.W., M.R.H., N.A.M., and D.S.K. wrote the paper, and all authors reviewed, offered input to the writing, and approved the manuscript.

Competing interests

All authors declare no competing interests.

Figures

Extended Data Fig. 1
Extended Data Fig. 1. L-cysteine supplementation supports L. iners growth in Lactobacillus MRS broth, augmented by L-glutamine.
a,b Growth of L. crispatus, L. iners, and G. vaginalis at 24 hours incubation in MRS broth (BD DIFCO) ± supplementation with 2% IsoVitaleX (“Iso”) or with the indicated sub-pools of IsoVitaleX components. c, Growth in MRS broth supplemented with 2% IsoVitaleX or various combinations of the nutrients in “Pool 2”. d, Growth of L. iners at 24 hours in MRS broth + L-Gln (1.1 mM) supplemented with varying concentrations of L-Cys or e, in MRS broth + L-Cys (4 mM) supplemented with varying concentrations of L-Gln. Experiments in (a-e) all used BD DIFCO-formulated MRS broth base. (f) Growth of L. iners in Hardy Criterion-formulated MRS (“HMRS”) broth supplemented with IsoVitaleX 2% v/v, L-Cys (4 mM), and/or L-Gln (1.1 mM) produced similar results, although with a substantially longer lag phase. Each plot depicts median (± range) for 3 replicates per condition and each plot is representative 1 of ≥2 independent experiments per strain and media condition except (a), which was un-replicated.
Extended Data Fig. 2
Extended Data Fig. 2. Phylogeny and per-genome gene content of genomes and MAGs within FGT Lactobacillus genome catalogs
a, Phylogenetic tree of L. iners isolate genomes and MAGs as in Fig 1b, plus isolate genomes of L. crispatus (n = 182), L. jensenii (n = 39), L. gasseri (n = 28), and L. vaginalis (n = 8). Isolates further experimentally studied in this work are indicated. The tree depicts only genome assemblies exceeding certain quality thresholds to ensure robustness of the phylogenetic reconstruction (see Methods); additional strains and genomes were included in other analyses. b, Number of genes per genome for each genome retrieved from RefSeq (“Reference Genome”), previously unreported isolate genome (“Novel Genome”), or MAG within the Lactobacillus genome catalogs analyzed in Fig. 2b and 4b and Extended Data Fig. 6a. All MAGs present in the analysis represent previously unreported assemblies (Hayward et al, manuscript in preparation, see additional information in Methods and Supplementary Tables 4-11). To maximize comprehensiveness of the pan-genomes, the catalogs included high- and medium-quality genomes and MAGs, defined as assemblies with minimum estimated completeness >50% (some of which are classified as partial assemblies by NCBI size criteria) and maximum estimated contamination <10%. Gene count analysis excludes gene sequences observed in only 1 genome or MAG per species to eliminate singleton contaminating sequences within individual genome assemblies. Box center lines, edges, and whiskers signify the median, interquartile range (IQR), minima and maxima respectively.
Extended Data Fig. 3
Extended Data Fig. 3. In vivo association of BV status and vaginal Cys concentrations with microbiota composition.
a, Relationship between Nugent score-based BV status and cervicotype among the 53 women depicted in Fig. 3a. BV status and cervicotype were significantly associated (P = 1.902 × 10⁻¹¹; two-sided Fisher’s Exact Test). b, Two-tailed Spearman correlation between relative Cys concentrations in cervicovaginal lavage (CVL) fluid and relative abundances of the species L. iners, and L. crispatus among the 142 women depicted in Fig. 3b-f, showing correlation coefficients (ρ) with unadjusted p-values. Linear regression lines (solid blue) with 95% confidence intervals calculated based on log-transformed abundances and concentrations are shown to assist visualization (L. crispatus: y = 0.77 + 0.25x; L. iners: y = 0.30 + 0.22x). The red dotted line represents the bacterial limit of detection (L.D.). c,d Per-sample relative abundances and cohort-level prevalence (fraction of samples from the cohort in which each taxon was detected) for each genus (c) or species (d) with ≥50% prevalence (panels correspond to main Fig. 3e and 3f, respectively). Purple and blue lines respectively represent median and interquartile range of relative abundances for each taxon.
Extended Data Fig. 4
Extended Data Fig. 4. Vaginal concentrations of the Cys-containing peptides reduced glutathione (GSH) and cysteinylglycine (Cys-Gly) in cervicovaginal fluid are higher in women without BV and correlate with Lactobacillus dominance of the microbiota.
a,b Relative concentrations of (a) GSH and (b) Cys-Gly by BV status in CVL fluid from the 53 women in (Fig. 3a). c,d Relative concentrations of (c) GSH and (d) Cys-Gly by cervicotype in CVL fluid from the 142 women depicted in (Fig. 3b,c). In (a-d) the red dotted line represents the metabolite limit of detection (L.D.). For samples in which an analyte was below the L.D., concentrations were imputed at 0.5 x L.D. Log-transformed concentrations were not normally distributed due to the imputed values, so between-group differences were determined via Kruskal-Wallis test with post-hoc Dunn’s test, adjusting for multiple comparisons using the Bonferroni method. All significant pairwise differences are displayed. a No BV-BV: P = 5.7 × 10⁻⁷; No BV-Intermediate: P = 0.0037. b No BV-BV: P = 0,0032. c CT1-CT4: P = 7.7 × 10⁻⁵; CT2-CT3: P = 0.0292; CT2-CT4: P = 2.9 × 10⁻¹¹. d CT1-CT4: P = 0.0191; CT2-CT4: P = 0.00014. Box center lines, edges, and whiskers signify the median, IQR, minima and maxima respectively. e,f Forest plots depicting Spearman correlation coefficients (ρ) between concentrations of GSH and Cys-Gly and relative abundances of each bacterial genus (e) or species (f) detected at >50% prevalence in the cohort (n = 142). P-values and confidence intervals in e,f were adjusted for multiple comparisons using the Bonferroni method at significance level 0.05/n (full statistical results in Supplementary Tables 14 & 15). Significance is depicted for adjusted p-values as * P ≤ 0.05, ** P ≤ 0.01, *** P ≤ 0.001, **** P ≤ 0.0001.
Extended Data Fig. 5
Extended Data Fig. 5. Cys and Cys-containing molecules in MRS exist primarily as mixed disulfides and addition of chemical reducing agents permits L. iners growth.
a, Growth of L. iners and L. crispatus at 28 hours in MRSQ broth supplemented as indicated with the reduced thiols L-Cys, D-Cys (the non-physiological enantiomer of L-Cys), GSH, or homocysteine (each 4 mM), with their oxidized counterparts L-cystine, D-cystine, oxidized glutathione (GSSG), or homocystine (each 2 mM), or with TCEP (4 mM), H2O2 (0.4 mM), or L-cystine + H2O2. b, Concentrations of reduced Cys (baseline median concentration 1.11 μM) and glutathione (GSH; baseline median concentration 1.70 μM) in MRSQ broth supplemented with the oxidizing agent H2O2 (0.4 mM), the non-sulfur-containing reducing agents Tris(2-carboxyethyl)phosphine (TCEP) or homocysteine (each 4 mM), or homocysteine’s oxidized counterpart homocystine (2 mM). c, Growth at 7 days of L. crispatus and L. iners in HMRS broth with 1.1 mM L-Gln (“HMRSQ”) supplemented as indicated with L-Cys, L-cystine, TCEP, homocysteine, or homocystine at the above concentrations. All plots depict median ± range for 3 replicates per condition and each plot is representative of 1 of ≥2 independent experiments per strain and media condition. Bar coloring highlights the pairing of media conditions with each thiol-containing reducing agent and its oxidized counterpart.
Extended Data Fig. 6
Extended Data Fig. 6. FGT Lactobacillus genomes lack predicted alternate Cys and GSH transporters and L. iners is selectively inhibited by cystine uptake inhibitors.
a, Predicted presence of the branched-chain amino acid transport locus livFGHKM (which has low-affinity Cys transport activity in E. coli) and the glutathione transport locus gsiABCD in isolate genomes and MAGs of common FGT Lactobacillus species (n = number of genomes. Detailed statistics are in Supplementary Table 4). b, Selective growth inhibition of L. iners in MRSQ broth with or without L-Cys (4 mM) and varying concentrations of the cystine uptake inhibitor seleno-DL-cystine (SDLC). c, Growth of L. crispatus and L. iners in HMRSQ broth with or without L-Cys (4 mM) ± SMC. d, Growth inhibition of L. crispatus and L. iners by SMC (128 mM) or SDLC (2 mM) in MRSQ supplemented with L-cystine (2 mM) or D-Cys, TCEP, or GSH (4 mM each). For each growth additive, percentage growth in in presence of inhibitor was calculated relative to median growth in broth containing that additive without inhibitor. Plots in b-d depict median ± range for 3 replicates per condition and each plot is representative 1 of ≥2 independent experiments per strain and media condition.
Extended Data Fig. 7
Extended Data Fig. 7. Sample preparation and controls for L. iners / L. crispatus growth competition assays.
a, Mono-culture growth of L. crispatus (strain FRESH1) and 3 representative L. iners strains at 28 hrs incubation in MRSQ broth with or without L-Cys (4 mM) and varying concentrations of the cystine uptake inhibitor S-methyl-L-cysteine (SMC), exhibiting expected growth patterns for the respective species. Plots depict median ± range for 3 replicates per condition and each plot is representative 1 of ≥2 independent experiments per strain and media condition. The competition assays between L. iners and L. crispatus depicted in Fig. 5a were prepared by mixing the input inocula from each of these L. iners monocultures pairwise with the input inoculum for the L. crispatus monoculture at the colony-forming unit (C.F.U.) ratios listed in the legend of Fig. 5a. b, Bacterial 16S rRNA gene read counts in cultured samples (n = 105 individual cultures), with negligible background read counts in blank growth media controls (n = 7 controls, one each per media type) and extraction controls (n = 7 controls) associated with the competition experiments in main Fig. 5a. (Control sample reactions were included in the sequencing library despite absence of visible PCR bands.) Box center lines, edges, and whiskers signify the median, IQR, minima and maxima respectively.
Extended Data Fig. 8
Extended Data Fig. 8. Development of “S-broth” and controls for mock BV-like community growth experiments.
a, Monoculture growth at 48 hours of experimental US (strain “233”) and South African (strains FRESH1 and FRESH2) L. crispatus strains, as well as L. iners, G. vaginalis, Prevotella bivia, Prevotella disiens, and Sneathia sanguinegens strains in various broth media including MRSQ broth + L-Cys (4 mM), NYCIII broth with or without 2% IsoVitaleX plus 5% Vitamin K1-Hemin solution (“IHK”) and/or Tween-80 (1 g/L), and in “S-broth” (see Methods) with or without Tween-80 (1 g/L). S-broth + Tween was used in subsequent experiments. (Detailed strain information is in Supplementary Table 3). Plots depict median ± range for 3 replicates per condition and each plot is representative 1 of ≥2 independent experiments per strain and media condition. b, Bacterial 16S rRNA gene read counts in mock mixed communities (n = 72 individual cultures) and pure strain monocultures (n = 7), with negligible background read counts in blank growth media controls (n = 4 controls, one each per media type) and extraction controls (n = 2 controls) associated with the experiments in Fig. 5c,d. (Control sample reactions were included in the sequencing library despite absence of visible PCR bands.) Box center lines, edges, and whiskers signify the median, IQR, minima and maxima respectively. c, Confirmation of identity of input strains in mock BV-like communities by 16S rRNA gene sequencing of bacterial monoculture controls, prepared from the same input inocula used for the bacterial mock communities shown in Fig. 5c,d.
Fig. 1.
Fig. 1.. Lactobacillus iners requires L-cysteine supplementation to grow in conditions that support other vaginal lactobacilli.
a, Growth of Lactobacillus crispatus, L. iners (strain F1), and Gardnerella vaginalis in Lactobacillus MRS broth ± supplementation with 2% IsoVitaleX. b, Unrooted phylogenetic tree of 198 L. iners genomes from previously unreported and reference bacterial isolates and previously undescribed culture-independent metagenome-assembled genomes (MAGs) derived from geographically diverse populations. Red dots indicate isolates experimentally studied in this work. Genome type, geographic origin, and BV status of the source samples are shown. The tree depicts only genome assemblies exceeding certain quality thresholds to ensure robustness of the phylogenetic reconstruction (see Methods); additional strains and genomes were included in other analyses (Supplementary Tables 3-11 and Extended Data Fig. 2). c, Growth of 8 representative US (prefix “A”) or South African (prefix “F”) L. iners strains cultured in MRS broth supplemented as indicated with IsoVitaleX (2%), L-cysteine (L-Cys, 4 mM), and/or L-glutamine (L-Gln, 1.1 mM). In 1a,c growth was assessed by optical density at 600 nm (OD600) and plotted as median (± range) for 3 replicates from 1 of ≥2 independent experiments per strain and media condition.
Fig. 2
Fig. 2. Vaginal lactobacilli lack canonical Cys biosynthesis pathways.
a, Canonical bacterial Cys biosynthesis pathways. Cysteine synthase pathway: serine O-acetyltransferase (encoded by cysE), then cysteine synthase (cysK, cysM, or cysO). Reverse transsulfuration pathway: cystathionine β-synthase (cbs) or O-acetylserine-dependent cystathionine β-synthase (mccA), then cystathionine γ-lyase (mccB). Asterisks indicate position of 13C label in isotopic tracing experiments. b, Predicted presence of genes encoding cysteine biosynthesis enzymes within the cysteine synthase or reverse transsulfuration pathways in isolate genomes and MAGs of the indicated FGT Lactobacillus species (n = number of genomes; detailed results in Supplementary Table 12). Assessment of gene presence was based on annotations from eggNOG 5.0 performed using eggNOG-mapper v2,. Results were supported by BLAST searches of the genomes for sequences of interest. c, Serine isotopic enrichment in L. crispatus and L. iners grown for 24 hours in L-Gln-supplemented MRS broth (“MRSQ”) containing no isotopic tracer (supplemented with unlabeled L-Cys 4 mM) or supplemented with 1-13C-L-serine (13C-L-Ser) + homocysteine (both 4 mM). Plot depicts fractional abundance of unlabeled (m+0, Ser) and labeled (m+1, 13C-Ser) isotopologues in cellular hydrolysates. d, Cystine isotopic enrichment in lysates of L. crispatus or L. iners cultured as shown in (c) or in broth supplemented with 1-13C-L-cysteine (13C-L-Cys; 4 mM). An oxidation step during sample processing converts Cys to cystine for quantification. Plot depicts fractional abundance of cystine isotopologues: unlabeled (m+0; cystine), partially labeled (m+1; 13C1-L-cystine), and fully labeled (m+2; 13C2-L-cystine) isotopologues. Data in 2c,d depict median values of 3 replicates per group and were un-replicated (full data in Supplementary Tables 13 and 14).
Fig. 3.
Fig. 3.. Vaginal Cys concentrations are higher in women without BV and correlate with Lactobacillus-dominant microbiota.
a, Relative Cys concentration by BV status in cervicovaginal lavage (CVL) fluid from 53 South African women (21 without BV, 24 with BV, and 8 intermediate by Nugent method). Differences in log-transformed concentrations determined by one-way analysis of variance (ANOVA) with post-hoc Tukey’s test; all significant pairwise differences at confidence level 0.95 are shown (No BV-BV: P < 1 × 10⁻⁷; Intermediate-BV: P = 0.0060). b, FGT bacterial microbiota composition among 142 HIV-uninfected South African women (including the 53 from a), determined by bacterial 16S rRNA gene sequencing (taxonomy assignments in Supplementary Table 15). Bacterial communities were classified into “cervicotypes” (CTs) using previously defined criteria. c, Relative Cys concentrations per CT in CVL fluid from women in (b). Significance determined by one-way ANOVA with post-hoc Tukey’s test; all significant pairwise differences are shown. CT-CT3: P = 0.000120; CT1-CT4: P < 1 × 10⁻⁷; CT2-CT3: P = 0,00898; CT2-CT4: P < 1 × 10⁻⁷; CT-CT4: P = 0.0279. In a,c, box center lines, edges, and whiskers signify median, interquartile range (IQR), minima and maxima, respectively. d, Two-tailed Spearman rank correlation between Cys concentrations and bacterial relative abundances of the genera Lactobacillus, Gardnerella, and Prevotella, showing correlation coefficients (ρ) with unadjusted p-values. Linear regression lines (solid blue) with 95% confidence intervals calculated from log-transformed abundances and concentrations are shown to assist visualization (Lactobacillus: y = 0.37 + 0.32x; Gardnerella: y = −0.25 – 0.15x; Prevotella: y = −0.47 – 0.27x). Red dotted line represents limit of detection (L.D.). e,f Two-tailed Spearman correlation coefficients (ρ) with adjusted confidence intervals between Cys concentrations and relative abundances of each genus (e) or species (f) detected at >50% prevalence in cohort (n = 142). P-values and confidence intervals in e,f were adjusted for multiple comparisons using the Bonferroni method at significance level 0.05/n (full statistical results in Supplementary Tables 16 & 17). Significance of adjusted P-values depicted as * P ≤ 0.05, ** P ≤ 0.01, *** P ≤ 0.001, **** P ≤ 0.0001.
Fig. 4.
Fig. 4.. L. iners lacks Cys-related transport mechanisms present in other lactobacilli and is selectively inhibited by cystine uptake inhibitors.
a, Growth of L. crispatus, G. vaginalis, and representative L. iners strains in MRSQ broth ± L-Cys (4 mM) or L-cystine (2 mM). b, Predicted presence of putative Cys transport-related gene cjaA, cystine transport loci tcyABC, tcyJKLMN, and tcyP, and the Cys/GSH transport/redox homeostasis locus cydABCD locus in FGT Lactobacillus species genomes and MAGs (n = number of genomes; detailed results in Supplementary Table 12). TcyBC takes up glutathione in some species. c, Cystine isotopic enrichment in L. crispatus or L. iners grown in MRSQ broth containing labeled L-cystine (13C2-L-cystine; 2 mM) or GSH (13C-GSH; 4 mM; synthesis described in Supplementary Fig. 1). Plot depicts isotopologue median fractional abundance and was un-replicated. (Full data in Supplementary Tables 13 & 14). d, Growth of representative Lactobacillus strains in L-Cys-supplemented MRSQ broth containing the cystine uptake inhibitor S-methyl-L-cysteine (SMC). Percentages calculated relative to median OD600 measurement in L-Cys-containing no-inhibitor control. e, Median growth inhibition of non-iners Lactobacillus strains (L. crispatus, n = 7; L. jensenii, n = 2; L. gasseri, n = 1) or L. iners (n = 16) by SMC in L-Cys-supplemented MRSQ broth. Significance of differences between L. iners and non-iners strains was determined by two-sided t-test. Box center lines, edges, and whiskers signify the median, IQR, minima and maxima respectively. f, Growth inhibition of L. crispatus and L. iners by SMC (128 mM) or SDLC (2 mM) in NYCIII broth. Plots in a,d,f depict median (± range) for 3 replicates per condition and are representative of ≥2 independent experiments per condition.
Fig. 5.
Fig. 5.. SMC inhibits L. iners in competition with L. crispatus and combining SMC with metronidazole enhances L. crispatus dominance of mock BV-like communities.
a, Ratios of L. iners to L. crispatus in representative mixed culture competition assays after 28 hours incubation in L-Cys-supplemented MRSQ broth with varying concentrations of SMC. Ratios were determined via sequencing the bacterial 16S rRNA gene in DNA isolated from the mixed cultures; plots depict results for 5 replicates per condition. Between-group differences were determined by one-way ANOVA. Pairwise comparisons to the reference condition (“Ref”: no-inhibitor, L-Cys-supplemented control) were calculated using Dunnett’s test. All significant comparisons are shown (full statistical results in Supplementary Table 18). Input ratios of colony-forming units (C.F.U.) of L. iners to L. crispatus were 8.01:1, 1.08:1, and 5.96:1 for the mixes containing L. iners strains A4, F1, and F3 respectively. b, Growth inhibition of L. crispatus, L. iners, and three BV-associated species at 48 hours incubation in S-broth with or without SMC and/or metronidazole (MTZ). Plots depict median (± range) for 3 replicates per condition and are representative of 2 independent experiments per condition. c, Relative abundance of bacterial species in three representative mock BV-like communities (each with a different L. iners strain) grown in S-broth with or without SMC and/or MTZ at 28 hours incubation. Composition was determined by bacterial 16S rRNA gene sequencing. Input ratios of strains for each community are shown in Supplementary Table 19. d, Ratios of L. crispatus to the sum of all other taxa in the mock communities shown in (c). (c,d) depict 6 replicates per condition. Between-group differences in (d) were determined via one-way ANOVA with post-hoc Tukey test; selected pairwise differences are shown (full statistical results in Supplementary Table 20). In 5a,e significance is depicted as * P ≤ 0.05, ** P ≤ 0.01, *** P ≤ 0.001, **** P ≤ 0.0001. (b,d) Box center lines, edges, and whiskers signify the median, IQR, minima and maxima respectively.

Comment in

Similar articles

Cited by

References

    1. Gosmann C et al. Lactobacillus-Deficient Cervicovaginal Bacterial Communities Are Associated with Increased HIV Acquisition in Young South African Women. Immunity 46, 29–37 (2017). - PMC - PubMed
    1. McClelland RS et al. Evaluation of the association between the concentrations of key vaginal bacteria and the increased risk of HIV acquisition in African women from five cohorts: a nested case-control study. Lancet Infect. Dis. 18, 554–564 (2018). - PMC - PubMed
    1. Fettweis JM et al. The vaginal microbiome and preterm birth. Nat. Med. 25, 1012–1021 (2019). - PMC - PubMed
    1. Anahtar MN et al. Cervicovaginal Bacteria Are a Major Modulator of Host Inflammatory Responses in the Female Genital Tract. Immunity 42, 965–976 (2015). - PMC - PubMed
    1. Jespers V et al. A longitudinal analysis of the vaginal microbiota and vaginal immune mediators in women from sub-Saharan Africa. Sci. Rep. 7, 1–13 (2017). - PMC - PubMed

Publication types

Supplementary concepts

LinkOut - more resources