. 2022 Apr;54(4):382-392.
doi: 10.1038/s41588-021-01006-7. Epub 2022 Mar 3.

Genome-wide analysis provides genetic evidence that ACE2 influences COVID-19 risk and yields risk scores associated with severe disease

Collaborators, Affiliations

Genome-wide analysis provides genetic evidence that ACE2 influences COVID-19 risk and yields risk scores associated with severe disease

Julie E Horowitz et al. Nat Genet. 2022 Apr.

Abstract

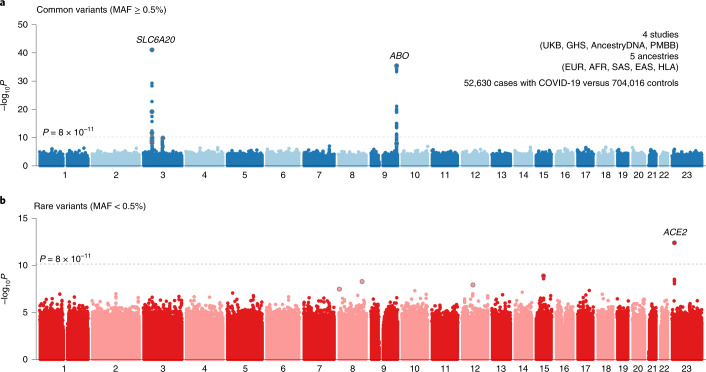
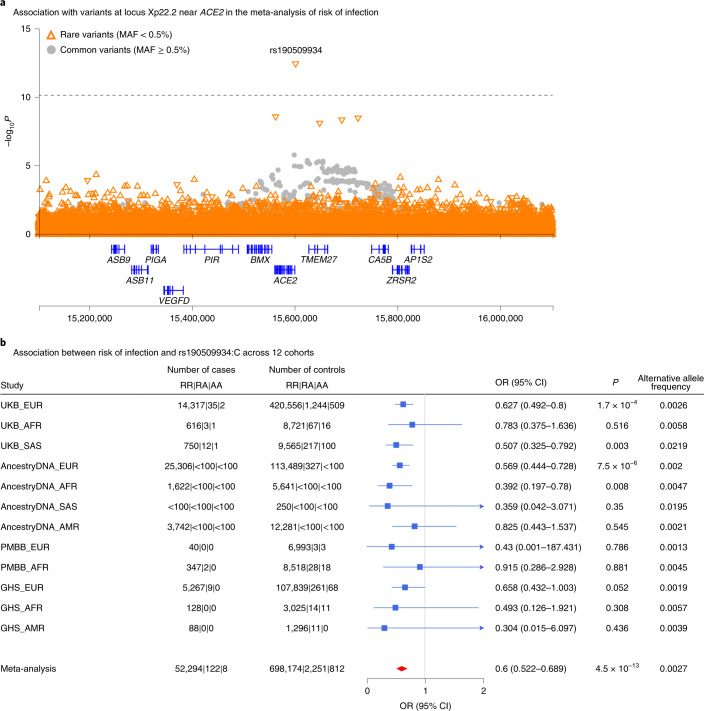
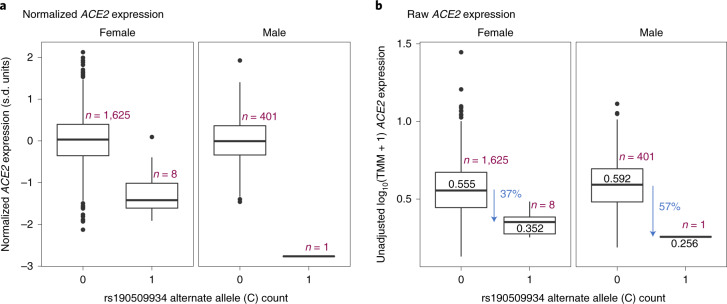
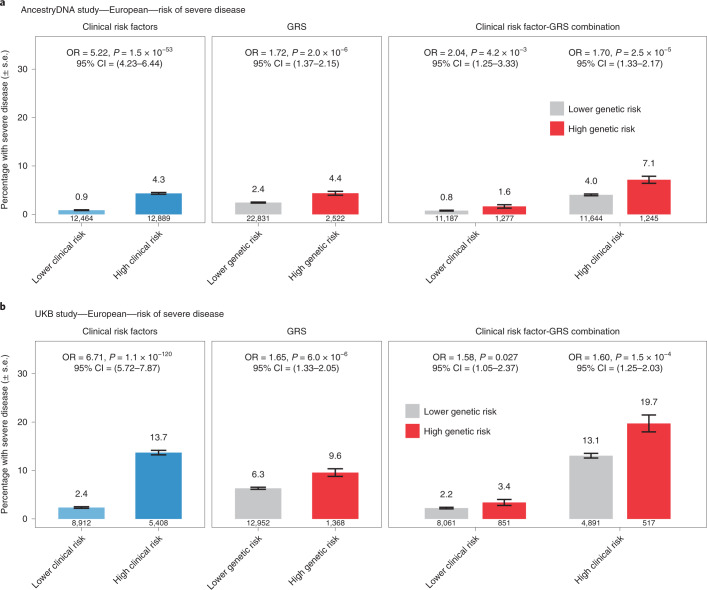
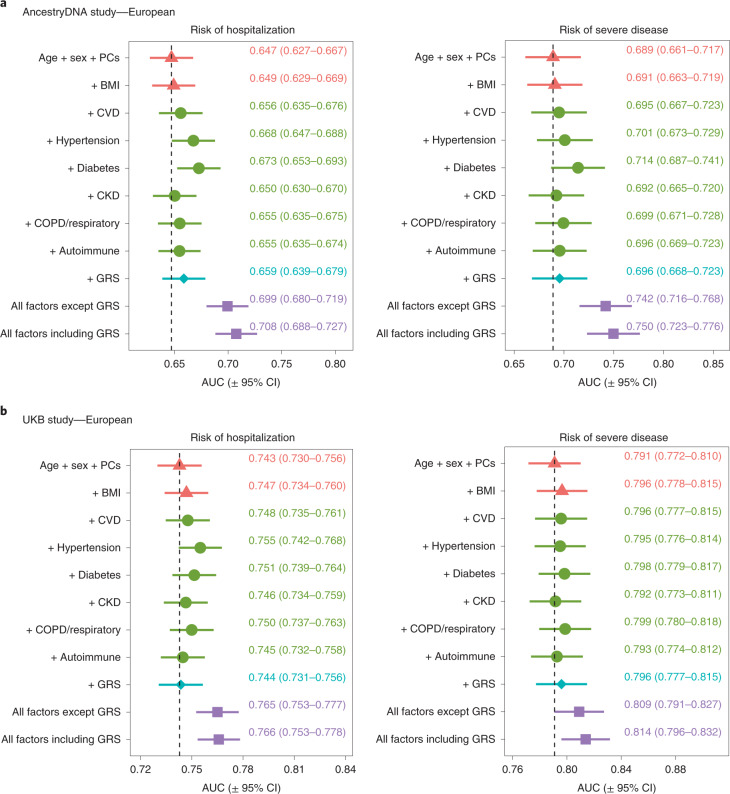
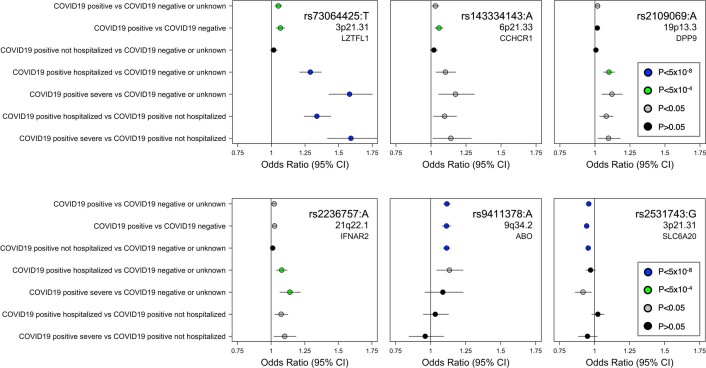
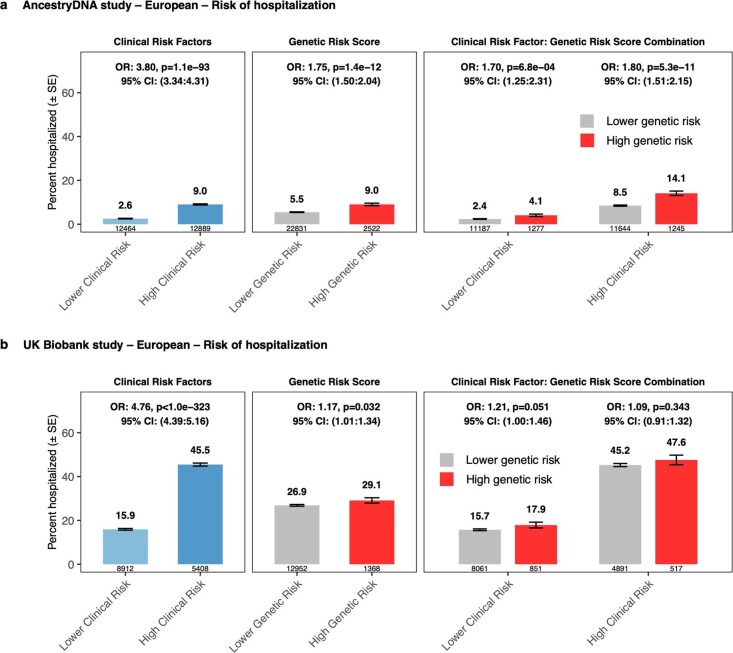
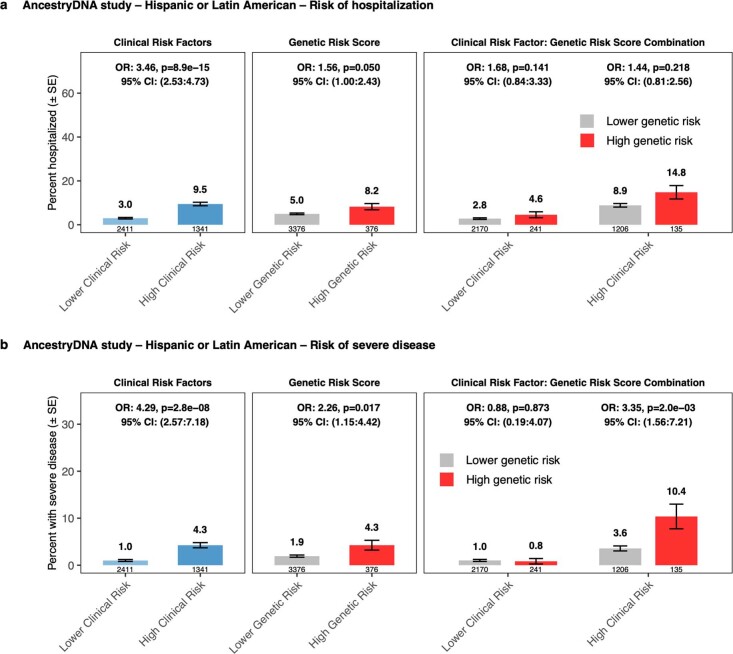
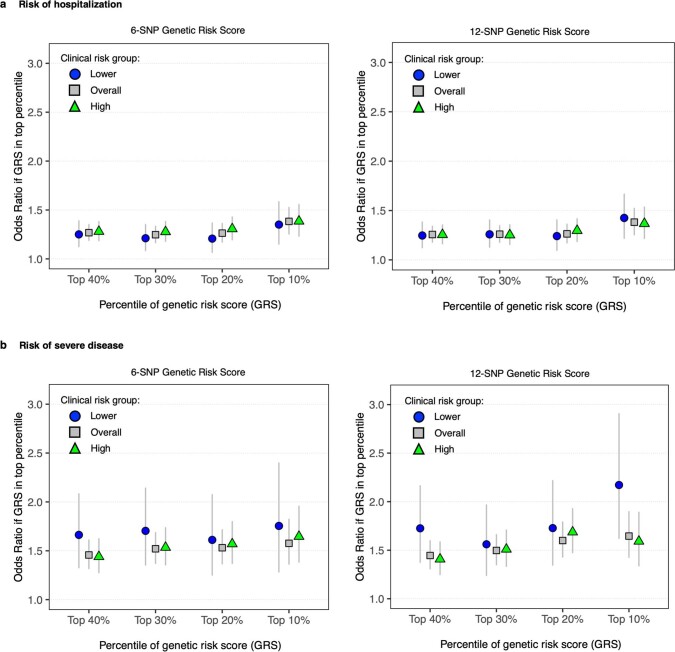
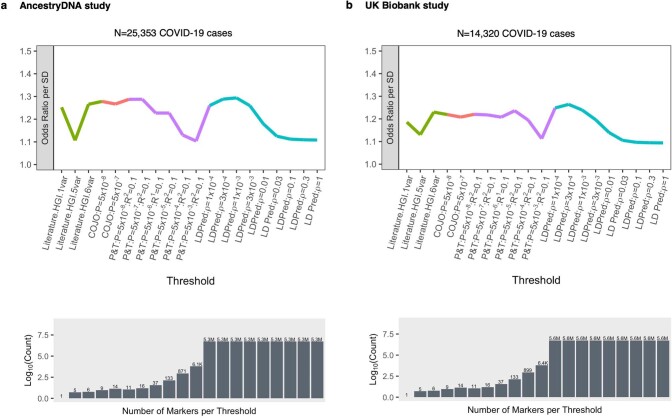
Severe acute respiratory syndrome coronavirus 2 (SARS-CoV-2) enters human host cells via angiotensin-converting enzyme 2 (ACE2) and causes coronavirus disease 2019 (COVID-19). Here, through a genome-wide association study, we identify a variant (rs190509934, minor allele frequency 0.2-2%) that downregulates ACE2 expression by 37% (P = 2.7 × 10⁻⁸) and reduces the risk of SARS-CoV-2 infection by 40% (odds ratio = 0.60, P = 4.5 × 10⁻¹³), providing human genetic evidence that ACE2 expression levels influence COVID-19 risk. We also replicate the associations of six previously reported risk variants, of which four were further associated with worse outcomes in individuals infected with the virus (in/near LZTFL1, MHC, DPP9 and IFNAR2). Lastly, we show that common variants define a risk score that is strongly associated with severe disease among cases and modestly improves the prediction of disease severity relative to demographic and clinical factors alone.


Conflict of interest statement

J.E.H., J.A.K., A.D., D. Sharma, N.B, A.Y., A.M., R.L., E.M., X.B., D. Sun, F.S.P.K., J.D.B., C.O.D., A.J.M., D.A.T., A.H.L., J. Mbatchou, K.W., L.G., S.E.M, H.M.K., L.D., E.S., M.J., S.B., K.S, W.J.S., A.R.S., A.E.L., J. Marchini, J.D.O., L.H., M.N.C., J.G.R., A. Baras, G.R.A. and M.A.R.F. are current and/or former employees and/or stockholders of RGC or Regeneron Pharmaceuticals. G.H.L.R., M.V.C., D.S.P., S.C.K. A. Baltzell, A.R.G., S.R.M., R.P., M.Z., K.A.R., E.L.H. and C.A.B. are current and/or former employees of AncestryDNA and may hold equity in AncestryDNA. The other authors declare no competing interests.

Figures

Fig. 1
Fig. 1. Summary of association results from a GWAS meta-analysis of risk of infection (n = 52,630 COVID-19 positive cases, n = 704,016 COVID-19 negative or unknown controls).
a, Results for common variants (MAF ≥ 0.5%). b, Results for rare variants (MAF < 0.5%).
Fig. 2
Fig. 2. Association between variants near ACE2 and risk of infection.
a, Regional association plot for locus Xp22.2 near ACE2 in the meta-analysis of risk of infection across 14 cohorts (n = 52,630 COVID-19-positive cases, n = 704,016 COVID-19-negative or unknown controls; Supplementary Table 4). b, Association between risk of infection and the most significant variant at the Xp22.2 locus (rs190509934:C, MAF = 0.3%) across 12 cohorts (n = 52,424 COVID-19-positive cases, n = 701,237 COVID-19-negative or unknown controls). The variant was not tested in two cohorts due to low sample size (AncestryDNA, EAS ancestry; UKB, EAS ancestry). Associations were estimated in each cohort using Firth regression (two-sided test) as implemented in REGENIE, with results combined across cohorts using an inverse variance meta-analysis.
Fig. 3
Fig. 3. Association between rs190509934:C and ACE2 expression in liver measured in the GHS study (n = 2,035 individuals).
a, Association with normalized gene expression levels. b, Association with raw gene expression levels. The box plots show the median (center line), lower and upper quartiles (box boundaries), minimum and maximum (whiskers) and samples >1.5 s.d. units from the mean (individual data points).
Fig. 4
Fig. 4. Association between a 6-SNP GRS and risk of hospitalization and severe disease among cases with COVID-19 of European ancestry.
a, Association between a high GRS and risk of hospitalization. The risk of hospitalization among cases is shown for individuals in the top GRS percentile, agnostic to the number of clinical risk factors present. The association was tested in three studies separately (AncestryDNA, UKB and GHS) using logistic regression (two-sided test), with established risk factors for COVID-19 included as covariates (Methods). Results were then meta-analyzed across studies (combined n = 44,958 cases with COVID-19, including 6,138 hospitalized). b, Association between a high GRS and risk of severe disease. The association was tested as described above in three studies separately (AncestryDNA, UKB and GHS). Results were then meta-analyzed across studies (combined n = 44,958 cases with COVID-19, including 1,940 with severe disease). n in red: number of cases with COVID-19 in the top GRS percentile. n in blue: number of cases with COVID-19 in the rest of the population. Data are presented as OR ± 95% CIs. Association statistics, including exact P values, are shown in Supplementary Table 20.
Fig. 5
Fig. 5. Association between a 6-SNP GRS and risk of severe disease among cases with COVID-19 of European ancestry after stratifying by the presence of clinical risk factors.
a, Rate of severe disease in the AncestryDNA study (n = 25,353 cases with COVID-19, including 667 with severe disease). b, Rate of severe disease in the UKB study (n = 14,320 cases with COVID-19, including 951 with severe disease). High genetic risk (red bars): top 10% of the GRS. Low genetic risk (gray bars): bottom 90% of the GRS (that is, all other cases with COVID-19). The association between risk of severe disease and risk factors (for example, clinical risk factors) was estimated using logistic regression (two-sided test). Data are presented as the percentage of individuals with severe disease ± s.e.
Fig. 6
Fig. 6. Prediction of risk of hospitalization and severe disease among cases with COVID-19 of European ancestry based on demographic, clinical and genetic risk factors.
We tested the extent to which information on genetic risk (specifically the 6-SNP GRS) could help predict risk of hospitalization and severe disease in addition to demographic and clinical risk factors. a, Results for the AncestryDNA study (n = 25,353 cases with COVID-19). b, Results for the UKB study (n = 14,320 cases with COVID-19). Each study was split 50:50 intro training and validation sets, with prediction accuracy in the validation set summarized in each plot by the AUC. Data are presented as the AUC ± 95% CI. The vertical dashed line shows the AUC for the baseline model (age + sex + PCs).
Extended Data Fig. 1
Extended Data Fig. 1. Comparison of effect sizes across COVID-19 risk and severity outcomes for six previously reported risk variants that validated in this study.
Six variants were reported to associate with risk of COVID-19 in previous studies and replicated in our analysis. Of these, four variants also associated with disease severity among COVID-19 cases (in/near LZTFL1, CCHCR1, DPP9 and IFNAR2), whereas two variants did not (in ABO and SLC6A20). Sample size for each of the seven phenotypes is shown in Supplementary Table 3. Data are presented as odds ratio + /− 95% confidence interval.
Extended Data Fig. 2
Extended Data Fig. 2. Association between a 6-SNP genetic risk score (GRS) and risk of hospitalization among COVID-19 cases of European ancestries after stratifying by the presence of clinical risk factors.
a, Rate of hospitalization in the AncestryDNA study (n = 25,353 COVID-19 cases, including 1,484 hospitalized). b, Rate of hospitalization in the UK Biobank study (n = 14,320 COVID-19 cases, including 3,878 hospitalized). High genetic risk (red bars): top 10% of the GRS. Low genetic risk (grey bars): bottom 90% of the GRS (that is all other COVID-19 cases). Data are presented as percent of individuals hospitalized + /- standard error (SE).
Extended Data Fig. 3
Extended Data Fig. 3. Association between a 6-SNP genetic risk score (GRS) and risk of hospitalization and severe disease among COVID-19 cases of Hispanic or Latin American ancestries (n = 3,752).
a, Rate of hospitalization. b, Rate of severe disease. High genetic risk (red bars): top 10% of the GRS. Low genetic risk (grey bars): bottom 90% of the GRS (that is all other COVID-19 cases). Data are presented as percent of individuals hospitalized (a) or with severe disease (b) ± standard error (SE).
Extended Data Fig. 4
Extended Data Fig. 4. Association between a 6- and 12-SNP genetic risk score (GRS) and risk of hospitalization and severe disease among COVID-19 cases of European ancestries.
a, Associations with risk of hospitalization (n = 44,958 COVID-19 cases). b, Associations with risk of severe disease (n = 39,673). To evaluate if the association between the GRS and worse disease outcomes was dependent on the list of variants selected for analysis, we compared results between GRS calculated using different sets of variants. We considered a GRS calculated using: the six variants that were reported in previous GWAS of COVID-19 and that we further showed were associated with risk of hospitalization or severe disease among COVID-19 cases (four variants in/near LZTFL1, MHC, DPP9 and IFNAR2, see Extended Data Fig. 1; and two variants discovered by the HGI in/near RPL24 and FOXP4, see Supplementary Table 16). Analyses were performed separately in the UK Biobank, AncestryDNA and GHS studies (risk of hospitalization only) after stratifying COVID-19 cases by the presence of clinical risk factors, considering individuals with lower clinical risk (blue circles), high clinical risk (green triangles) or all individuals (grey squares). Association results were then meta-analyzed across studies. Data are presented as odds ratio + /− 95% confidence interval.
Extended Data Fig. 5
Extended Data Fig. 5. Association between risk of severe disease among COVID-19 cases of European ancestries and genetic risk scores (GRS) determined based on different criteria.
a, Association results in the AncestryDNA study (n = 25,353 COVID-19 cases). b, Association results in the UK Biobank study (n = 14,320 COVID-19 cases). In each study, we compared GRS based on (i) variants that were reported in the literature and validated in this study (Literature.HGI.1var: rs73064425 in LZTFL1; Literature.HGI.5var: variants from our 6-SNP model, with the exception of rs73064425 in LZTFL1; Literature.HGI.6var: all six variants from our 6-SNP model; in green); and variants associated with the risk of infection phenotype reported by the HGI and obtained through (ii) approximate conditional analysis using GCTA-COJO, considering two association P-value thresholds (5 x 10⁻⁸ and 5 x 10⁻⁷; in orange); (iii) pruning and thresholding (P&T), using different association P-value and LD r2 thresholds (in purple); and (iv) the LDpred approach, considering different 𝝔 parameters (in teal).

Update of

Comment in

References

    1. Yan R, et al. Structural basis for the recognition of SARS-CoV-2 by full-length human ACE2. Science. 2020;367:1444–1448. doi: 10.1126/science.abb2762. - DOI - PMC - PubMed
    1. Bai Y, et al. Presumed asymptomatic carrier transmission of COVID-19. JAMA. 2020;323:1406–1407. doi: 10.1001/jama.2020.2565. - DOI - PMC - PubMed
    1. Guan W-J, et al. Clinical characteristics of coronavirus disease 2019 in China. N. Engl. J. Med. 2020;382:1708–1720. doi: 10.1056/NEJMoa2002032. - DOI - PMC - PubMed
    1. Kimball A, et al. Asymptomatic and presymptomatic SARS-CoV-2 infections in residents of a long-term care skilled nursing facility—King County, Washington, March 2020. MMWR Morb. Mortal. Wkly Rep. 2020;69:377–381. doi: 10.15585/mmwr.mm6913e1. - DOI - PMC - PubMed
    1. Zhu N, et al. A novel coronavirus from patients with pneumonia in China, 2019. N. Engl. J. Med. 2020;382:727–733. doi: 10.1056/NEJMoa2001017. - DOI - PMC - PubMed

Publication types

Substances