. 2022 Jul;40(7):1042-1055.
doi: 10.1038/s41587-022-01219-z. Epub 2022 Mar 3.

Functional, metabolic and transcriptional maturation of human pancreatic islets derived from stem cells

Affiliations

Functional, metabolic and transcriptional maturation of human pancreatic islets derived from stem cells

Diego Balboa et al. Nat Biotechnol. 2022 Jul.

Abstract

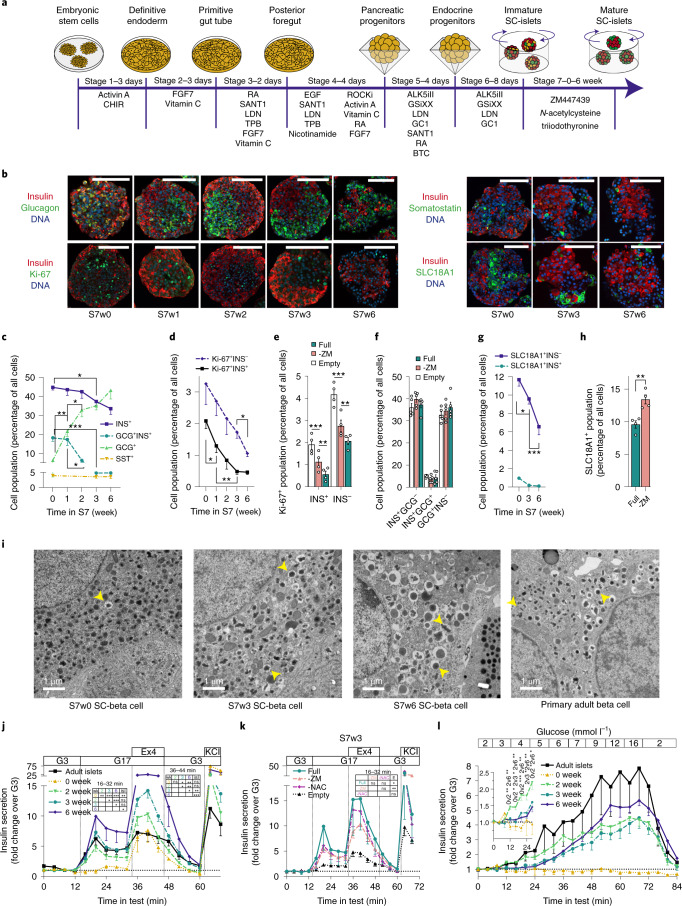
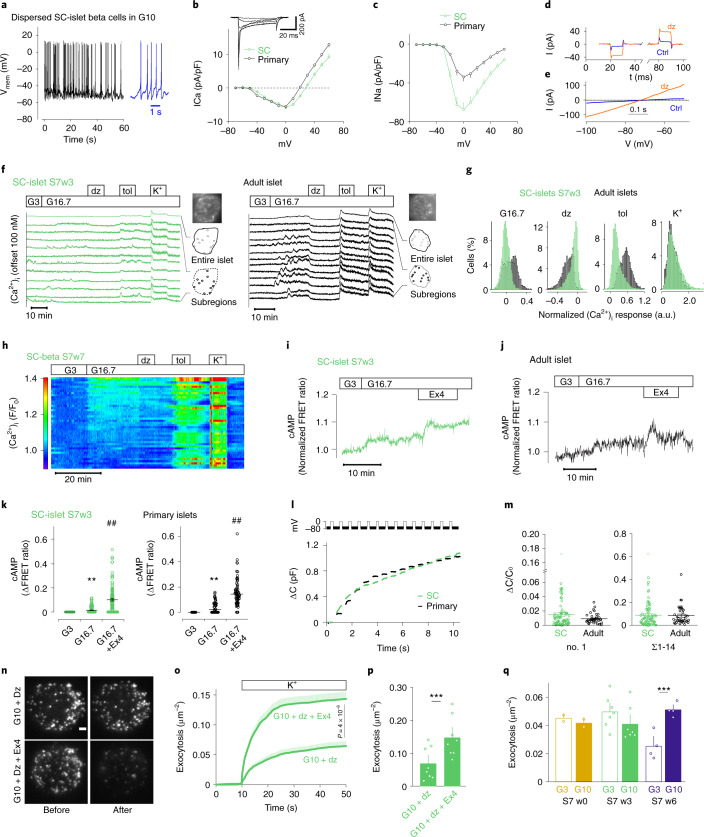
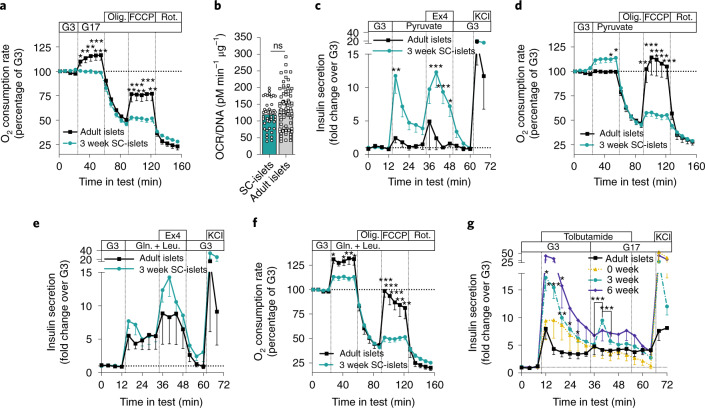
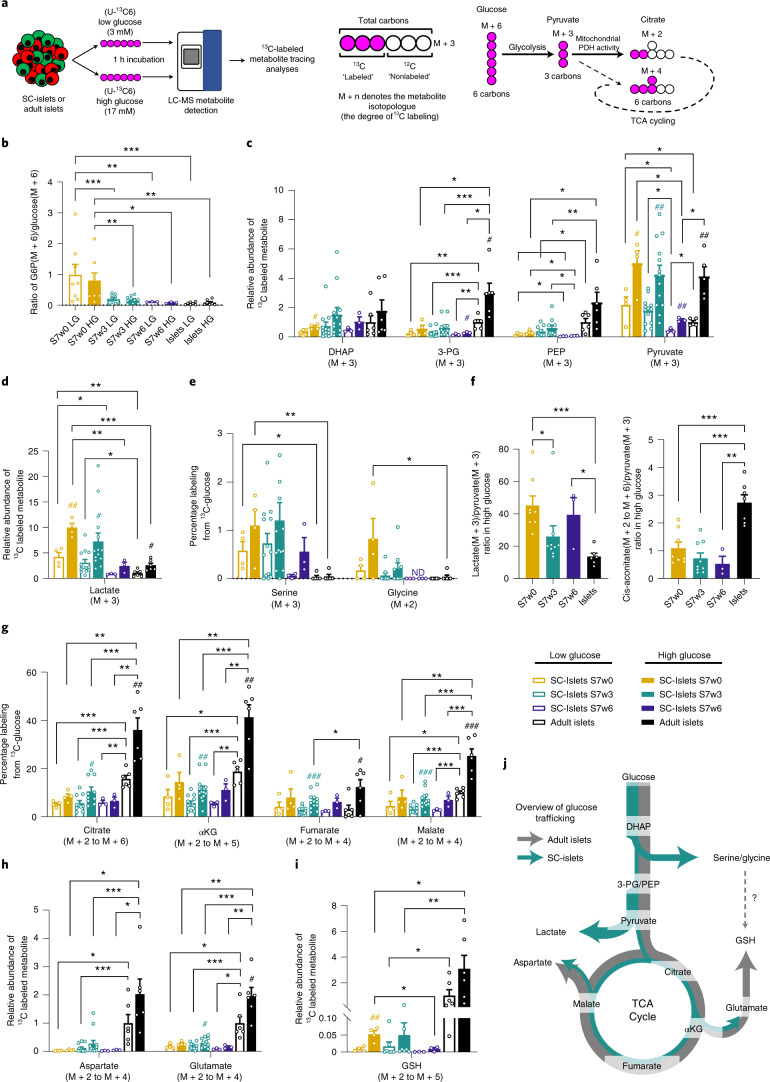
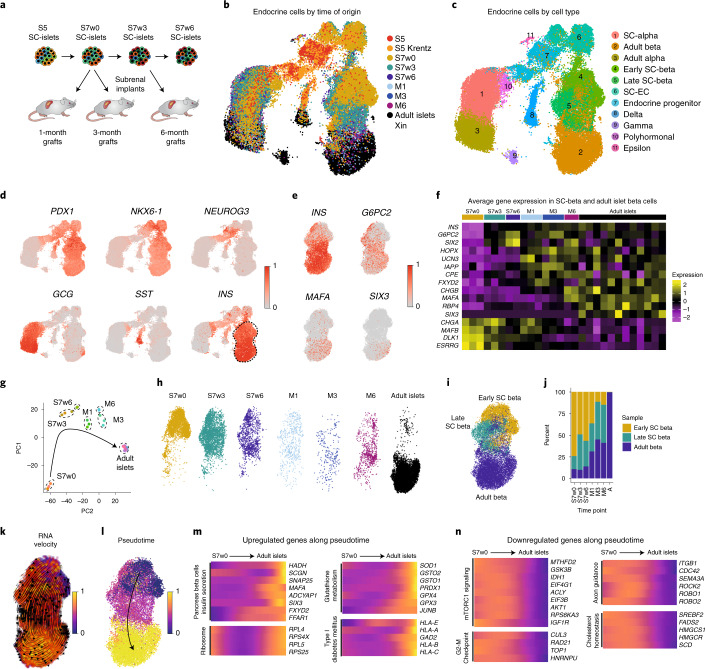
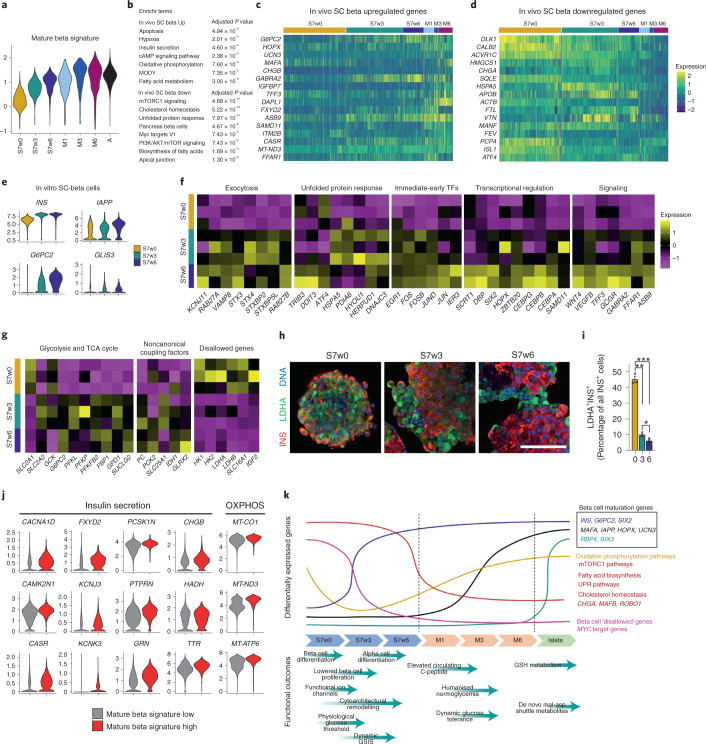
Transplantation of pancreatic islet cells derived from human pluripotent stem cells is a promising treatment for diabetes. Despite progress in the generation of stem-cell-derived islets (SC-islets), no detailed characterization of their functional properties has been conducted. Here, we generated functionally mature SC-islets using an optimized protocol and benchmarked them comprehensively against primary adult islets. Biphasic glucose-stimulated insulin secretion developed during in vitro maturation, associated with cytoarchitectural reorganization and the increasing presence of alpha cells. Electrophysiology, signaling and exocytosis of SC-islets were similar to those of adult islets. Glucose-responsive insulin secretion was achieved despite differences in glycolytic and mitochondrial glucose metabolism. Single-cell transcriptomics of SC-islets in vitro and throughout 6 months of engraftment in mice revealed a continuous maturation trajectory culminating in a transcriptional landscape closely resembling that of primary islets. Our thorough evaluation of SC-islet maturation highlights their advanced degree of functionality and supports their use in further efforts to understand and combat diabetes.


Conflict of interest statement

The authors declare no competing interests.

Figures

Fig. 1
Fig. 1. Characterization of SC-islet cytoarchitecture and insulin secretory function.
a, Overview of SC-islet differentiation protocol. Stages 1–4 in monolayer, Stage 5 in microwells and Stages 6–7 in suspension culture. b, Immunohistochemistry of SC-islets during S7 culture. Scale bars, 100 µm, representative images of two to eight independent experiments with similar results. cd, Proportion of hormone positive (c) and Ki-67 positive (d) cells during S7 culture, quantified from immunohistochemistry, n = 2–8. Multiple (c) and one-way analysis of variance (ANOVA), INS+ and INS populations (d) were analyzed separately. ef, Percentage of S7w3 SC-islet cells positive for Ki-67 (e) or INS and GCG (f). Comparison of S7 media: ‘Full’ = ZM+NAC+T3, ‘-ZM’ = NAC+T3 and ‘Empty’ without ZM, NAC and T3; Two-way ANOVA. gh, Proportion SLC18A1 positive cells during S7 culture (g) n = 4–5 and at S7w3 comparing full S7 medium and S7 medium lacking ZM (h) n = 4, quantified from immunohistochemistry; two-way ANOVA (g), two-tailed Welch’s t-test (h). i, Electron micrographs of SC-beta cells at S7 weeks 0, 3 and 6, and of adult human beta cells; scale bars, 1 µm. Yellow arrows denote mature insulin granules. Representative images of several cells from one to three independent experiments with similar results. j, Insulin secretion responses to perifusion with 2.8 mM (G3) to 16.8 mM glucose (G17), 50 ng ml–1 exendin-4 (Ex4) and 30 mM KCl. Normalized to secretion during the first 16 min of the test; n = 3–18. One-way ANOVA of the mean response during specific steps of the test. k, Same test as in j, conducted on matched S7w3 SC-islet experiments comparing Full, -ZM, -NAC (with ZM and T3) and empty S7 medium, n = 3–5; one-way ANOVA of the mean response during the G17 step of the test. l, Insulin secretion response to gradual increase in glucose concentration from 2 to 16 mM. Normalized to secretion during the first 8 min of the test. Inset: data from 0–28 min with a different y axis scale, n = 4–7, Two-way ANOVA on significance of individual timepoints of the test. All data are presented as mean ± s.e.m. *P < 0.05, **P < 0.01, ***P < 0.001.
Fig. 2
Fig. 2. Voltage-dependent ion currents, [Ca2+]i oscillations, [cAMP]m signaling and exocytosis in SC-derived and primary islet cells.
a, Example membrane potential recording in beta cells of dispersed SC-islets; 10 mM glucose. bc, Current (I)–voltage (V) relationship in beta cells of dispersed SC-islets (n = 80 cells, eight preparations) or primary islets (n = 39 cells, four donors). Inset shows family of voltage-clamp currents in SC-beta cells (−40 to +10 mV). Average Ca2+ currents (b) and peak Na+ currents (c) (P = 0.002, two-tailed t-test) normalized to cell capacitance (pF). For SC-beta cells, half-maximal current activation was reached at −29 ± 0.9 mV (n = 64) for Ca2+ and at −22.5 ± 0.4 mV (n = 75) for Na+. de, Current responses to step-depolarizations (d, ±10 mV around −70 mV, black) or voltage ramps (e, −100 to −50 mV at 100 mV s–1) in controls (Ctrl) or in presence of diazoxide (200 µM) in S7w3 SC-beta cells. f, [Ca2+]i recordings from SC-islets and primary islets exposed to 3 mM (G3) and 16.7 mM glucose (G16.7), 250 µM diazoxide (dz), 1 mM tolbutamide (tol) and 30 mM K+. The uppermost trace shows a quantification from an entire islet and the traces below are representative examples from cell-sized regions of interest. g, Histograms showing the changes of [Ca2+]i in response to various treatments normalized to the levels at G3 in cells from SC-islets (n = 5,254) and primary islets (n = 3,550). h, [Ca2+]i recording specifically from insulin-expressing SC-beta cells using RIP2-R-GECO1. Relative fluorescence changes as a function of time with each line representing one cell. ij, Representative [cAMP]m recordings from cells in intact SC- (i) and primary (j) islets stimulated with G16.7 and 10 nM exendin-4 (Ex4). k, The effects of G16.7 and Ex4 from experiments as in i and j in SC-islets (n = 119 cells from six independent experiments) and primary islets (81 cells from three preparations) ** P < 0.01 versus G3; ## P < 0.01 versus G16.7, two-tailed Student’s paired t-test. l, Cell capacitance increase (ΔCm) during a train of 14 × 200 ms depolarizations from −70 mV to 0 mV in SC-beta cells and primary beta cells. m, Average change in membrane capacitance, normalized to initial cell capacitance (ΔC/C0), during the first depolarization (no. 1), and total increases during the train (Σ1–14) for SC-beta (n = 80 cells, eight preparations) and primary beta cells (n = 39 cells, four preparations). Dots represent individual cells and lines the mean values. n, Representative TIRF images of SC-beta cells expressing the granule marker NPY-tdmOrange2 in absence (top) or presence of Ex4 (bottom), and before (left) and after (right) stimulation with elevated K+ (in G10 + diazoxide). Scale bar, 2 µm. o, Cumulative timecourse of high K+-evoked exocytosis events normalized to cell area, from experiments as in n, for control (68 cells) and Ex4 (71 cells); two-tailed t-test. Shaded areas indicate s.e.m. p, Total K+ depolarization-induced exocytosis in o. q, Spontaneous exocytosis (normal K+, no diazoxide, normalized to cell area) during a 3-min observation period after >20 min preincubation at G3 or G10. Fusion events were quantified in SC-beta cells at S7w0 (13 cells at G3 and 12 at G10) and at S7w6 (40 cells at G3 and 41 at G10) and normalized to the cell area. In p and q, dots represent averages for individual SC-islet batches. All data presented as means ± s.e.m. unless otherwise indicated.
Fig. 3
Fig. 3. Testing of SC-islet respiration, alternative fuel responses and metabolic amplifying pathway.
a, Change in OCR in response to 16.8 mM glucose (G17), oligomycin (Olig.) (2 µM), FCCP (2 µM) and rotenone (Rot.) (1 µM) in S7w3 SC-islets (n = 15) and adult islets (n = 5); two-tailed Student’s unpaired t-test. b, OCR normalized to DNA content of the SC-islets in a; two-tailed Student’s unpaired t-test. ns, nonsignificant. c, Insulin secretion responses to perifusion with 2.8 mM glucose (G3), 10 mM pyruvate, 50 ng ml–1 exendin-4 (Ex4) and 30 mM KCl. Normalized to average secretion during, the first 16 min of the test. n = 3–4; one-way ANOVA of the mean response during specific steps of the test. d, the same test as in a, with pyruvate 10 mM replacing G17; two-tailed Student’s unpaired t-test, n = 4–12. e, Same test as c, with 10 mM glutamine (Gln.) and 5 mM leucine (Leu.) replacing pyruvate (n = 3–4). f, Same test as d, with 10 mM glutamine (Gln.) and 5 mM leucine (Leu.) replacing pyruvate; two-tailed Student’s unpaired t-test (n = 4–11). g, Insulin secretion responses to change from G3 to G17 under the influence of 500 µmol l–1 tolbutamide (Tolb) in perifusion. Normalized to secretion during the first 12 min of the test, n = 4–7; two-way ANOVA. Significance versus human islets, and when indicated, between timepoints in test. All data are presented as mean ± s.e.m. * P < 0.05, ** P < 0.01, *** P < 0.001.
Fig. 4
Fig. 4. Metabolic tracing analysis of maturing SC-islets.
a, Left, Overview of experimental setup. SC-islets or adult islets were exposed to low (3 mM) or high (17 mM) concentrations of uniformly labeled [U-13C6] glucose for 1 h before metabolite extraction and liquid-chromatography mass spectrometry (LC-MS) detection. Right, An example of isotopologue nomenclature and glucose-derived labeling of downstream metabolites. b, The ratio of M+6 G6P to M+6 labeled glucose under low and high glucose concentrations in adult islets and SC-islets over 6 weeks of maturation. c, The relative abundances of fully labeled glycolytic intermediates in SC-islets and adult islets following low and high labeled glucose treatment. d, The M+3 lactate content of adult islets and SC-islets detected over the timecourse of maturation, following low and high labeled glucose treatment. e, The percentage of total serine and glycine labeled from 13C-glucose following low and high glucose treatment of SC- and adult islets. f, Ratiometric analysis of labeled lactate to labeled pyruvate, and labeled citrate to labeled pyruvate under high glucose treatment in SC-islets and adult islets. g, The combined percentage of labeled TCA metabolites (M+2 to fully labeled M+n) from SC- and adult islets after low and high labeled glucose treatment. h, The combined abundance of aspartate (M+2 to M+4) and glutamate (M+2 to M+5) isotopologues in SC-islets (w0–w6) under low and high glucose concentrations, relative to adult islets. i, The combined relative abundance of M+2 to M+5 GSH isotopologues under low and high labeled glucose concentrations in adult islets and SC-islets. j, Schematic overview of active glucose metabolic pathways in SC-islets and adult islets. Arrow thickness denotes the extent of glucose-derived carbons entering the pathway. Error bars ± s.e.m. with statistical significance determined by two-tailed t-tests. Hash symbols indicate internal significance from low to high glucose labeling, asterisks denote significance between SC-islet timepoints or adult islet samples at each glucose concentration. #,*P < 0.05, ##,**P < 0.01, ###,***P < 0.001. SC-islets S7w0 (n = 4), S7w3 (n = 12–13), S7w6 (n = 3), adult islets (n = 6).
Fig. 5
Fig. 5. Single-cell transcriptomic profiling of stem cell derived islet cells.
a, Experimental outline for scRNAseq transcriptomic profiling of SC-islets at the end of in vitro culture stages 5 (S5) and 6 (S7w0) and at week 3 (S7w3) and week 6 of S7 culture (S7w6), together with grafts retrieved after 1 (M1), 3 (M3) and 6 months (M6) postimplantation. b, UMAP-base embedding projection of an integrated dataset of 46,261 SC-derived endocrine cells and adult human islet cells,, colored by time and sample of origin. c, Clustering of the dataset in b cells into different cell types. d, Relative expression of marker genes for pancreatic progenitor cells (PDX1, NKX6-1, NEUROG3) and alpha- (GCG), delta- (SST) and beta- (INS) cells. Dashed line indicates the beta cell cluster selected for further study. e, UMAP projection of the beta cell cluster indicating the relative expression of insulin (INS) and mature beta cell markers G6PC2, MAFA and SIX3. f, Average gene expression of beta cell maturation markers in SC-beta cells and adult primary beta cells. The average expression of the beta cell populations (Fig. 1e) coming from each independent sample with different time of origin (S5 to Adult islets) is represented. g, PCA of the beta cell populations from each independent sample. (S7w0, n = 3; S7w3, n = 3; S7w6, n = 2; M1, n = 3; M3, n = 3; M6, n = 2; Adult, n = 12). h, Heterogeneous distribution of the beta cells from different time of origin in the beta cell cluster (Fig. 1e). i, Clustering of beta cells according to their transcriptional similarity into early, late and adult beta cluster. j, Fractional contribution to each early, late and adult beta clusters of beta cells from different times of origin. k, UMAP projection of the beta cell cluster with RNA velocity vectors overlaid. Cells are annotated by latent-time dynamics. Earlier latent timepoints, the origin of the trajectory, are indicated in blue, and later timepoints in yellow on the latent-time color scale. l, Pseudotemporal ordering of cells in the beta cell cluster. Earlier pseudotemporal points, the origin of the trajectory, are indicated in blue, and later pseudotemporal points in yellow on the pseudotime color scale. m,n, Relative expression levels of example genes that are upregulated (m) or downregulated (n) along the pseudotime trajectory inferred in l.
Fig. 6
Fig. 6. Transcriptional maturation of stem-cell-derived beta cells.
a, Mature beta cell signature of SC-beta and adult beta cells from different times of origin. b, Gene sets enriched in the in vivo implanted SC-beta cells upregulated and downregulated genes compared with in vitro SC-beta cells. c, Expression of selected marker genes upregulated in the in vivo SC-beta cells. d, Expression of selected marker genes downregulated in the in vivo SC-beta cells. e, Violin plots representing the expression of mature beta cell markers in the SC-beta cells from S7w0, S7w3 and S7w6 times of origin. f, Average expression of genes associated with mature beta cell hallmark processes in individual SC-beta cell in vitro samples from different times of origin. g, Average expression of glucose metabolism, noncanonical coupling factors and disallowed genes in individual SC-beta cell in vitro samples from different times of origin. h, Immunostaining for disallowed gene LDHA protein and insulin (INS) of in vitro SC-islets from S7w0, S7w3 and S7w6 timepoints. Scale bar, 100 µm. i, Quantification of LDHA positive cells out of all INS positive cells in SC-islets from S7w0, S7w3 and S7w6. Data are presented as mean ± s.e.m. * P < 0.05, ** P < 0.01, *** p < 0.001 One-way ANOVA with Welch’s correction; n = 3. j, Expression of genes associated with insulin secretion and oxidative phosphorylation in SC-beta cells with a high or low mature beta signature. k, Summary of functional and transcriptomic features of SC-islet maturation in vitro and in vivo.

Comment in

  • Sizing up beta cells made from stem cells.
    Nguyen-Ngoc KV, Wortham M, Sander M. Nguyen-Ngoc KV, et al. Nat Biotechnol. 2022 Jul;40(7):1006-1008. doi: 10.1038/s41587-022-01271-9. Nat Biotechnol. 2022. PMID: 35288669 No abstract available.

References

    1. Balboa D, Saarimäki-Vire J, Otonkoski T. Concise review: human pluripotent stem cells for the modeling of pancreatic β-cell pathology. Stem Cells. 2019;37:33–41. doi: 10.1002/stem.2913. - DOI - PMC - PubMed
    1. Nair GG, et al. Recapitulating endocrine cell clustering in culture promotes maturation of human stem-cell-derived β cells. Nat. Cell Biol. 2019;21:263–274. doi: 10.1038/s41556-018-0271-4. - DOI - PMC - PubMed
    1. Velazco-Cruz L, et al. Acquisition of dynamic function in human stem cell-derived β cells. Stem Cell Reports. 2019;12:351–365. doi: 10.1016/j.stemcr.2018.12.012. - DOI - PMC - PubMed
    1. Yoshihara E, et al. Immune-evasive human islet-like organoids ameliorate diabetes. Nature. 2020;586:606–611. doi: 10.1038/s41586-020-2631-z. - DOI - PMC - PubMed
    1. Alvarez-Dominguez JR, et al. Circadian entrainment triggers maturation of human in vitro islets. Cell Stem Cell. 2020;26:108–122.e10. doi: 10.1016/j.stem.2019.11.011. - DOI - PubMed

Publication types