. 2022 Mar;28(3):557-567.
doi: 10.1038/s41591-022-01696-4. Epub 2022 Mar 3.

Stem cell architecture drives myelodysplastic syndrome progression and predicts response to venetoclax-based therapy

Affiliations

Stem cell architecture drives myelodysplastic syndrome progression and predicts response to venetoclax-based therapy

Irene Ganan-Gomez et al. Nat Med. 2022 Mar.

Erratum in

  • Author Correction: Stem cell architecture drives myelodysplastic syndrome progression and predicts response to venetoclax-based therapy.
    Ganan-Gomez I, Yang H, Ma F, Montalban-Bravo G, Thongon N, Marchica V, Richard-Carpentier G, Chien K, Manyam G, Wang F, Alfonso A, Chen S, Class C, Kanagal-Shamanna R, Ingram JP, Ogoti Y, Rose A, Loghavi S, Lockyer P, Cambo B, Muftuoglu M, Schneider S, Adema V, McLellan M, Garza J, Marchesini M, Giuliani N, Pellegrini M, Wang J, Walker J, Li Z, Takahashi K, Leverson JD, Bueso-Ramos C, Andreeff M, Clise-Dwyer K, Garcia-Manero G, Colla S. Ganan-Gomez I, et al. Nat Med. 2022 May;28(5):1097. doi: 10.1038/s41591-022-01827-x. Nat Med. 2022. PMID: 35484266 Free PMC article. No abstract available.

Abstract

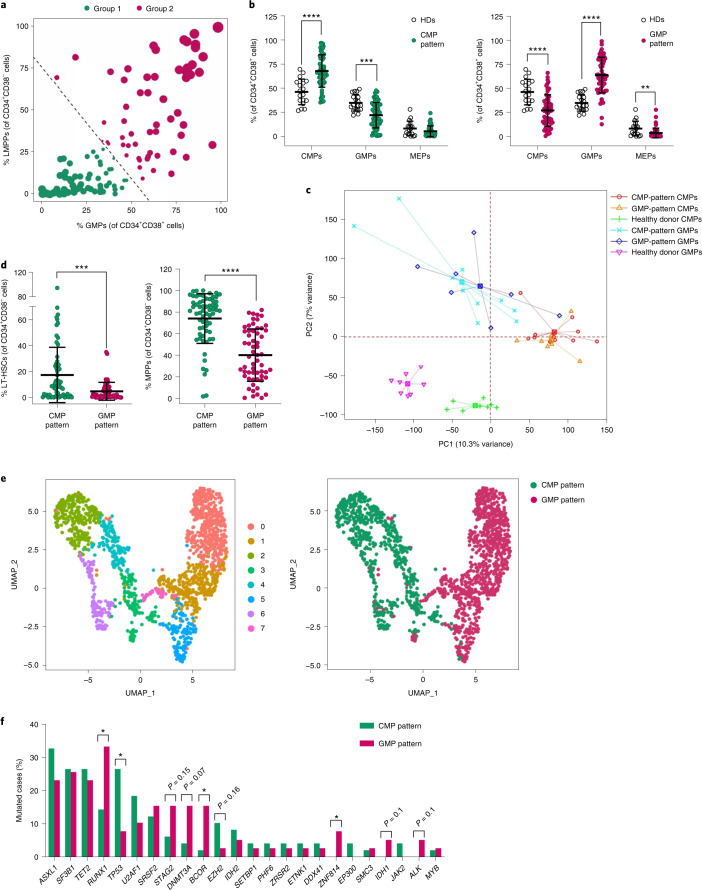
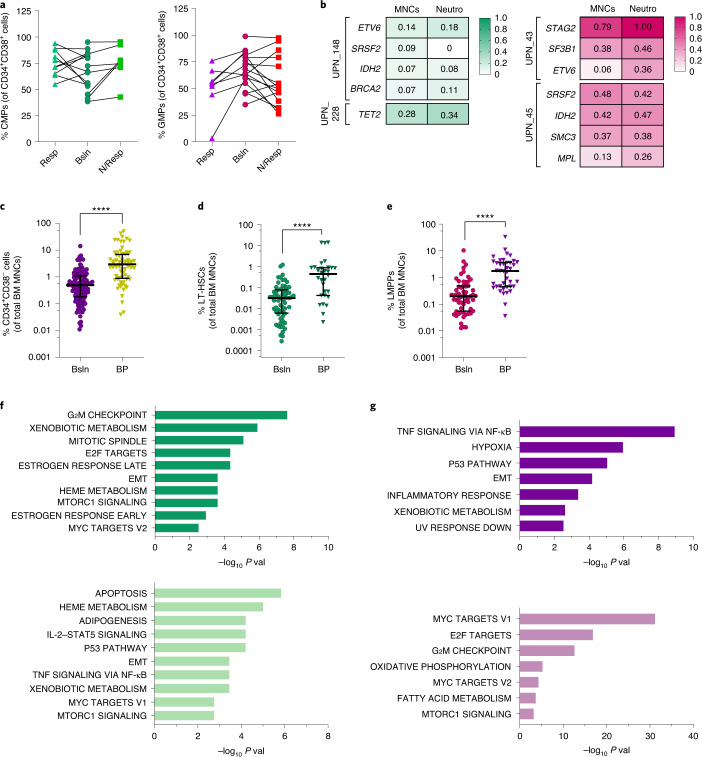
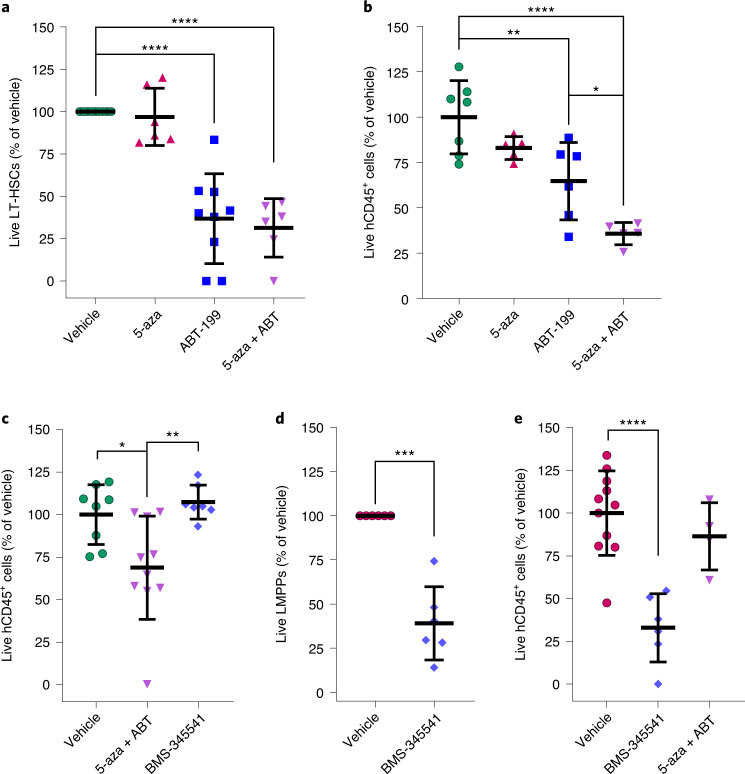
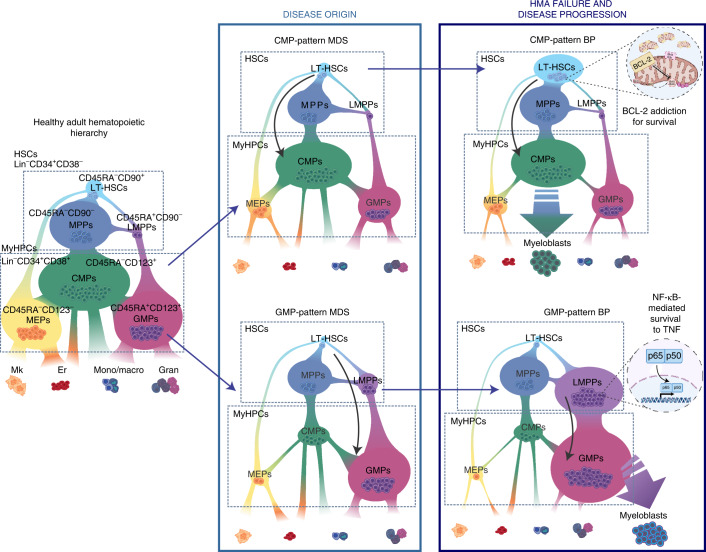
Myelodysplastic syndromes (MDS) are heterogeneous neoplastic disorders of hematopoietic stem cells (HSCs). The current standard of care for patients with MDS is hypomethylating agent (HMA)-based therapy; however, almost 50% of MDS patients fail HMA therapy and progress to acute myeloid leukemia, facing a dismal prognosis due to lack of approved second-line treatment options. As cancer stem cells are the seeds of disease progression, we investigated the biological properties of the MDS HSCs that drive disease evolution, seeking to uncover vulnerabilities that could be therapeutically exploited. Through integrative molecular profiling of HSCs and progenitor cells in large patient cohorts, we found that MDS HSCs in two distinct differentiation states are maintained throughout the clinical course of the disease, and expand at progression, depending on recurrent activation of the anti-apoptotic regulator BCL-2 or nuclear factor-kappa B-mediated survival pathways. Pharmacologically inhibiting these pathways depleted MDS HSCs and reduced tumor burden in experimental systems. Further, patients with MDS who progressed after failure to frontline HMA therapy and whose HSCs upregulated BCL-2 achieved improved clinical responses to venetoclax-based therapy in the clinical setting. Overall, our study uncovers that HSC architectures in MDS are potential predictive biomarkers to guide second-line treatments after HMA failure. These findings warrant further investigation of HSC-specific survival pathways to identify new therapeutic targets of clinical potential in MDS.


Conflict of interest statement

S.C. and M.A. report research funding from AbbVie and Amgen. J.P.I. and J.D.L. worked at AbbVie at the time of the study; G.G.-M. reports clinical funding from AbbVie and Amgen. All other authors report no competing interests related to this study.

Figures

Fig. 1
Fig. 1. Myelodysplastic syndrome stem cells are in two distinct differentiation states.
a, Logistic regression stratification of 123 BM samples isolated from untreated patients with MDS based on the frequencies of immunophenotypic LMPPs and GMPs in the lineage-negative (Lin) HSC (CD34+CD38) and MyHPC (CD34+CD38+) compartments, respectively. Each symbol represents one sample. The size of each symbol and its distance from the dashed line are proportional to the sample’s odds of belonging to the specific group. b, Frequencies of immunophenotypic CMPs, GMPs, and MEPs in the MyHPC compartment from baseline CMP-pattern MDS samples (left; n = 64) and GMP-pattern MDS samples (right; n = 59) compared with those from HDs (n = 18). Lines represent means ± s.d. Statistical significance was determined using two-tailed Student t-tests (CMP pattern: ****P = 0.000003, ***P = 0.000184; GMP pattern: ****P = 0.000022 and P < 0.000001, respectively, **P = 0.0039). c, PCA of RNA-seq data from immunophenotypic CMPs and GMPs isolated from the BMs of CMP-pattern patients with MDS (n = 11 and n = 10, respectively), GMP-pattern patients with MDS (n = 7), and HDs (n = 8). Each symbol represents one sample. d, Frequencies of immunophenotypic LT-HSCs (left) and MPPs (right) in the HSC compartment in CMP-pattern (n = 64) and GMP-pattern (n = 59) MDS samples. Lines represent medians ± interquartile ranges (IQRs). Statistical significance was calculated using two-tailed Mann–Whitney tests (***P = 0.0001, ****P < 0.0001). e, Uniform manifold approximation and projection (UMAP) plots of scRNA-seq data displaying 702 and 970 LinCD34+ cells isolated from representative baseline CMP-pattern and GMP-pattern MDS samples, respectively. Each symbol represents one cell. Different colors represent gene expression cluster types (left) and sample identities (right). f, Prevalence of somatic mutations in oncogenes and leukemia-relevant genes in BM MNCs from untreated CMP-pattern (n = 49) and GMP-pattern (n = 39) MDS samples. Genes mutated in ≥2 patients are shown. Statistical significance was calculated using Chi-squared tests (RUNX1, *P = 0.034; TP53, *P = 0.023; BCOR, *P = 0.022; ZNF814, *P = 0.048). Source data
Fig. 2
Fig. 2. Stem cells maintain the myelodysplastic syndrome phenotype and clonal burden during hypomethylating agent therapy, expand and activate specific survival pathways during blast progression.
a, Frequencies of CMPs and GMPs in the MyHPC compartment of CMP-pattern and GMP-pattern MDS samples, respectively, sequentially collected at baseline (Bsln; n = 15 and n = 21) and during HMA therapy at the times of best response (Resp; n = 10 and n = 8) or no response (N/Resp; n = 7 and n = 15). No significant differences were detected using one-way analysis of variance (ANOVA) with Dunnett’s multiple-comparisons test (CMPs) and a Kruskal–Wallis test with Dunn’s multiple-comparisons test. b, Variant allele frequencies (VAFs) of somatic mutations detected in total BM MNCs and neutrophils (Neutro) from CMP-pattern (left) and GMP-pattern (right) patients with MDS during hematological response to HMAs. c, HSC frequencies in total BM MNCs from MDS samples obtained at baseline (n = 123) and after HMA failure and BP (n = 70). Lines represent medians ± IQRs. Statistical significance was calculated using the two-tailed Mann–Whitney test (****P < 0.0001). d, LT-HSC frequencies in total BM MNCs from CMP-pattern MDS samples obtained at baseline (n = 64) and after HMA failure and BP (n = 30). Lines represent medians ± IQRs. Statistical significance was calculated using the two-tailed Mann–Whitney test (****P < 0.0001). e, LMPP frequencies in total BM MNCs from GMP-pattern MDS samples obtained at baseline (n = 59) and after HMA failure and BP (n = 40). Lines represent medians ± IQRs. Statistical significance was calculated using the two-tailed Mann–Whitney test (****P < 0.0001). f, Gene-set enrichment analysis (GSEA) of genes significantly (P < 0.004) upregulated (top; n = 515) or downregulated (bottom; n = 418) in LT-HSCs isolated from CMP-pattern MDS patients with BP (n = 4) compared with those from patients at baseline (n = 5). Hallmark gene sets with a gene enrichment overlap rate (k/K) > 0.02 and P < 0.01 are shown. EMT, epithelial-mesenchymal transition. g, GSEA of genes significantly (P < 0.01) upregulated (top; n = 352) or downregulated (bottom; n = 164) in LMPPs isolated from GMP-pattern MDS patients with BP (n = 6) compared with those from patients at baseline (n = 6). Hallmark gene sets are shown (P < 0.01; k/K > 0.02). Source data
Fig. 3
Fig. 3. Pharmacologically targeting upregulated survival pathways in myelodysplastic syndrome stem cells reduces tumor burden and halts disease progression.
a, Numbers of live cultured LT-HSCs from CMP-pattern MDS patients with BP after treatment with 0.5 µM 5-aza (n = 6), 50 nM ABT-199 (ABT; n = 9) or the combination of the agents (n = 6) for 72 h. Lines represent means ± s.d. Statistical significance was calculated using one-way ANOVA and Tukey’s multiple-comparison test (****P < 0.0001). b, Human CD45 chimerism in total BM cells from MDS-L xenografts after one cycle of treatment with vehicle (n = 7), 5-aza (n = 5), ABT-199 (n = 6) or the combination of the agents (n = 5). Lines represent the means ± s.d. of one experiment. Statistical significance was calculated using one-way ANOVA and Tukey’s multiple-comparison test (****P < 0.0001, **P = 0.0049, *P = 0.038). c, Human CD45 chimerism in total BM white blood cells (WBCs) from xenografts of a CMP-pattern BP sample after treatment with vehicle (n = 8), 5-aza plus ABT-199 (n = 10) or with BMS-345541 (n = 7). Lines represent the means ± s.d. of two independent experiments. Statistical significance was calculated using one-way ANOVA and Tukey’s multiple-comparisons test (**P = 0.0056, *P = 0.02). d, Numbers of live cultured LMPPs isolated from samples of GMP-pattern MDS with BP (n = 6) after treatment with 5 µM BMS-345541 for 48 h in the presence of 2.5 ng ml−1 human-recombinant TNF. Lines represent means ± s.d. Statistical significance was calculated using a paired two-tailed Student t-test (***P = 0.0008). e, Human CD45 chimerism in total BM WBCs from xenografts of a GMP-pattern BP sample after treatment with vehicle (n = 11), BMS-345541 (n = 6) or with 5-aza plus ABT-199 (n = 4). Lines represent the means ± s.d. of three independent experiments. Statistical significance was calculated using one-way ANOVA and Dunnett’s multiple-comparisons test (****P < 0.001). Source data
Fig. 4
Fig. 4. Venetoclax-based-therapy selectively targets hematopoietic stem cells from common myeloid progenitor-pattern myelodysplastic syndrome at blast progression after hypomethylating agent therapy failure.
a, Cumulative time to achieve CR in CMP-pattern (n = 8) and GMP-pattern (n = 13) MDS patients with BP after HMA therapy failure treated with venetoclax-based therapy. Statistical significance was calculated using the log-rank (Mantel–Cox) test (P = 0.018). b, BM MNC frequencies of immunophenotypic LT-HSCs from CMP-pattern MDS patients with BP (left), and LT-HSCs and LMPPs from GMP-pattern MDS patients with BP (center and right). Sequential samples were analyzed before the start of venetoclax-based therapy (C0, cycle 0; n = 8 and n = 8, respectively) and at the time of hematological remission (CR/mCR, complete remission or marrow CR; n = 5 and n = 4, respectively). Lines represent means ± IQRs. Statistical significance was determined using two-tailed Mann–Whitney tests (*P = 0.045). c, t-SNE plots of mass cytometry data displaying 287,354 and 509,697 BM MNCs isolated from a representative patient with CMP-pattern MDS (top) and one patient with GMP-pattern MDS (bottom), respectively, at multiple time points during therapy. Each dot represents one cell. Different colors indicate the hematopoietic clusters (left) and sample origin of each cell (right). Er, erythroid; Prog, progenitors; DCs, dendritic cells; Lymph, lymphoid; DP, double positive (CD4+CD8+); NK, natural killer; SD, stable disease (SD 1, after 1 cycle of therapy; SD 2, after 2 cycles of therapy); mCR, marrow complete remission; C0, cycle zero; PD, progressive disease. d, Frequencies of CD34+ HSPCs in the total BM MNC samples from the patients with CMP-pattern MDS (left) and GMP-pattern MDS (right) shown in c, at the indicated time points (n = 1 sample per time point). e, Metascape pathway enrichment analysis of the marker genes of cluster 1 (LMPPs) shown in Supplementary Fig. 11 (adjusted P value ≤ 0.05; n = 1,722 genes). The top ten Hallmark gene sets are shown. IFN-γ, interferon gamma. Source data
Fig. 5
Fig. 5. Proposed working model.
Distinct differentiation trajectories characterize the HSPC compartment in healthy adults (left) and MDS patients at the time of diagnosis (middle) and progression (right). MDS can be classified as one of two immunophenotypically distinct groups, CMP-pattern MDS or GMP-pattern MDS, based on the frequency of CMPs or GMPs, respectively, in the MyHPC compartment. In each group, MDS stem cells in distinct differentiation states (LT-HSCs in CMP-pattern MDS or LMPPs in GMP-pattern MDS) maintain the disease during HMA-based therapy and expand at progression. Specific survival pathways are selectively activated in each MDS stem cell type at BP and drive disease transformation. Er, erythrocyte; Gran, granulocyte; Mk, megakaryocyte; Mono/macro, monocyte/macrophage.
Extended Data Fig. 1
Extended Data Fig. 1. MDS stem cells are in two distinct differentiation states.
(a) tSNE maps displaying 5,000 Lin-CD34+ cells from the BM of 122 untreated MDS patients, clustered based on their raw immunophenotypic profiles. Overlaid colors represent the HSPC populations assigned to each cell (left), based on the gating strategy displayed in (b), and the phenotypic group of the corresponding sample of origin of each cell (right). (b) Flow cytometry plots of Lin-CD34+CD38- and Lin-CD34+CD38+ populations in representative CMP-pattern (top) and GMP-pattern (bottom) MDS samples. (c) Frequencies of immunophenotypic MyHPC populations in total BM MNCs from CMP-pattern MDS (left; n=64) and GMP-pattern MDS (right; n=59) samples, compared with those in BM MNCs from HD samples (n=18). Lines represent medians ± IQRs. Statistically significant differences between pairs were detected using two-tailed Mann-Whitney tests (CMP-pattern: *P=0.029, ****P<0.0001, **P=0.003; GMP-pattern: ****P<0.0001, ***P=0.0002). (d) Plating efficiency of colony-forming units (CFUs) derived from CMPs (left), GMPs (center), and MEPs (right) isolated from the BMs of CMP-pattern MDS (CMPs, n=8; GMPs and MEPs, n=6) and GMP-pattern MDS (CMPs, n=11; GMPs and MEPs, n=8), compared with those of HDs (CMPs, n=7; GMPs and MEPs, n=4). Each symbol represents the average of the technical duplicate; lines represent means ± s.d. Statistical significance was calculated using one-way ANOVA and Tukey’s multiple comparisons test (CMPs: ****P=0.0001, *P=0.014; MEPs: P=0.017). (e) Frequencies of CFUs derived from CMPs (left), GMPs (center), and MEPs (right) isolated from CMP-pattern MDS (CMPs, n=8; GMPs and MEPs, n=6) and GMP-pattern MDS (CMPs, n=11; GMPs and MEPs, n=8) samples, compared with those derived from cells isolated from HDs (CMPs: n=6 BFUs-E and GEMMs, n=7 GMs; GMPs and MEPs, n=4). Lines represent means ± SEMs. Statistical significance was calculated using a mixed model analysis with the Geisser-Greenhouse correction for matched values, using type 3 tests of fixed effects (disease x colony lineage in CMPs: F[4, 67]=1.46, P=0.22; GMPs: F[4, 43]=0.97, P=0.43; MEPs: F[4, 43])=5.94, P=0.0007), and Dunnett’s multiple comparison test (CFU-GM: **P=0.0084; CFU-GEMM: **P=0.0028, *P=0.019). BFU-E, burst forming unit-erythroid; GEMM, granulocyte/erythrocyte/monocyte/megakaryocyte; GM, granulocyte/macrophage. Source data
Extended Data Fig. 2
Extended Data Fig. 2. MDS HSPC architectures have myeloid-biased progenitors.
(a) Unsupervised clustering analysis of genes differentially expressed in CMPs (left; 957 genes) and GMPs (right; 1,369 genes) isolated from untreated CMP-pattern (n=11 and n=10, respectively) and GMP-pattern MDS patients (n=7 in both) and HDs (n=8 in both). (b) GSEA of genes significantly (P adj<0.05) upregulated in CMPs (top; 903 genes) and GMPs (bottom; 951 genes) isolated from MDS patients (n=18 and n=17, respectively), compared with those from HDs. Hallmark gene sets with a gene enrichment overlap rate (k/K) >0.05 and P>0.01 are shown. (c) Frequencies of immunophenotypic LT-HSCs (left), MPPs (center), and LMPPs (right) in total BM MNCs samples from HDs (n=18), baseline CMP-pattern MDS (n=64), and baseline GMP-pattern MDS (n=59). Lines represent medians ± IQRs. Statistical significance was calculated using Kruskal-Wallis tests and Dunn’s multiple comparisons test (****P<0.0001, **P<0.01, *P<0.05). Source data
Extended Data Fig. 3
Extended Data Fig. 3. MDS HSPCs are transcriptionally different.
(a) UMAP plots of scRNA-seq data displaying 878 Lin-CD34+ cells isolated from the BM samples of two representative HDs. Each symbol represents one cell. Different colors indicate the transcriptional cluster type (left) and sample origin (right) of each cell. (b) Distribution of the total number of HD (left) and MDS (right) Lin-CD34+ cells shown in (a) and in Fig. 1e, respectively, among scRNA-seq clusters with HSC, megakaryocytic/erythroid, or lymphoid/myeloid identity. Lineage identities are represented by different patterns. (c) UMAP plots of scRNA-seq data displaying the differential expression of MLLT3 (top) and CEBPA (bottom) in Lin-CD34+ cells isolated from the representative CMP-pattern and GMP-pattern MDS samples shown in Fig. 1e. Each symbol represents one cell. (d) Single-cell trajectory maps of the clusters shown in Fig. 1e. Each symbol represents one cell. Different colors represent transcriptional cluster types (top) and sample identities (bottom). Source data
Extended Data Fig. 4
Extended Data Fig. 4. The two MDS architectures are driven by different genetic alterations.
(a) Prevalence of founding somatic mutations in dominant clones in BM MNCs from untreated CMP-pattern (n=49) and GMP-pattern (n=39) MDS samples. Genes whose founding mutations were detected in ≥2 patients are shown. Statistical significance was calculated using chi-square tests (TP53:*P=0.023; DNMT3A: *P=0.046; BCOR: *P=0.046). (b) Prevalence of founding somatic mutations in secondary non-branching clones in BM MNCs from untreated CMP-pattern (n=24) and GMP-pattern (n=21) MDS samples. Genes whose founding mutations were detected in ≥2 patients are shown. Statistical significance was calculated using chi-square tests. (c) Co-mutation patterns in dominant BM MNC clones from CMP-pattern (left; n=49) and GMP-pattern (right; n=39) MDS patients. Founder genes whose mutations were detected in ≥2 patients are shown along with genes secondarily mutated in the same clones. Genes are color-coded by the inner circular segments, whose sizes are proportional to the total numbers of mutations in the cohort. Ribbons connect genes whose mutations co-occur in a dominant clone, color-matching the founder gene (first hit). Outer circular segments represent the relative contribution of mutations in other genes to a gene’s co-mutation profile. Missing outer colored segments represent cases in which the gene was a single-hit founder (no co-mutation). (d) Numbers of somatic mutations in BM MNCs from CMP-pattern (n=49) and GMP-pattern MDS (n=39) patients. Lines represent medians and IQRs. No statistical significance was found by a two-tailed Mann-Whitney test. (e) Numbers of somatic mutations in HSC subpopulations from untreated CMP-pattern (n=24) and GMP-pattern (n=14) MDS patients. Boxes represent medians (center) ± IQRs (maxima and minima); crosses represent means; whisker lines represent ranges. Dotted lines represent mutation gain (Mut gain). Statistical significance was calculated using Wilcoxon rank-sum tests and a parametric analysis as explained in Methods. P values are two-tailed. Source data
Extended Data Fig. 5
Extended Data Fig. 5. MDS HSCs maintain the disease phenotype in MDS patients during HMA therapy.
(a-c) Frequencies of immunophenotypic LT-HSCs (a), MPPs (b) and LMPPs (c) in BM MNCs from samples sequentially collected from CMP-pattern (left) and GMP-pattern (right) MDS patients at baseline (Bsln; n=15 and n=21, respectively) and during HMA therapy at the time of best response (Resp; n=10 and n=8, respectively) and/or lack of response (N/Resp; n=7 and n=15, respectively), compared with those of HDs (n=18). Lines represent medians ± IQRs. Statistical significance was calculated using Kruskal-Wallis tests and Dunn’s multiple comparison tests (****P<0.0001, ***P<0.001, **P<0.01, *P<0.05). (d) Frequencies of immunophenotypic CMPs and GMPs in the MyHPC compartment of the total cohort of CMP-pattern (left) and GMP-pattern (right) MDS patients, respectively, compared with those of HDs (n=18). MDS samples were collected at baseline (n=64 and n=59, respectively) and during HMA therapy, at the time of best available response (n=32 and n=14, respectively) or primary lack of response (n=22 and n=25, respectively). Lines represent means ± s.d. Statistical significance was calculated using one-way ANOVA and Tukey’s multiple comparisons tests (****P<0.0001, *P<0.05). (e-g) Frequencies of immunophenotypic LT-HSCs (e), MPPs (f) and LMPPs (g) in total BM MNCs from the total cohort of CMP-pattern (left) and GMP-pattern (right) MDS patients at baseline (n=64 and n=59, respectively) and during HMA therapy at the time of best available response (n=32 and n=14, respectively) and primary lack of response (n=22 and n=25, respectively), compared with those of HDs (n=18). Lines represent medians ± IQRs. Statistical significance was calculated using Kruskal-Wallis tests and Dunn’s multiple comparisons tests (****P<0.0001, ***P<0.001, **P<0.01, *P<0.05). Source data
Extended Data Fig. 6
Extended Data Fig. 6. MDS HSCs maintain the disease phenotype in MDS-like mice during HMA therapy.
(a) Complete blood counts before treatment and after 1 week of treatment with 5-aza or vehicle in G0 (TertER/+; n=15/each) and G5 (TertER/ER; n=16/each) mice. Lines represent the means ± s.d. of three independent experiments. Statistical significance was calculated using two-tailed Student t-tests (WBCs: ****P<0.000001, **P=0.0025; Neutrophils: ****P<0.000001; Hemoglobin [left to right]: ***P=0.00034, ***P=0.0006); Platelets: P<0.000001). (b) Frequency of cleaved caspase-3+ BM cells after 1 week of treatment with 5-aza or vehicle in G0 (n=5/each) and G5 mice (n=4 and n=5, respectively). Lines represent means ± s.d. Statistical significance was calculated using one-way ANOVA and Tukey’s multiple comparisons test (****P<0.0001, ***P<0.001, *P<0.05). (c) Numbers of CMPs (left) and GMPs (right) in the BMs of G0 and G5 mice treated with 5-aza (n=15/each) or vehicle (n=14/each) for 1 week. Lines represent the means ± s.d. of three independent experiments. Statistical significance was calculated using one-way ANOVA and Tukey’s multiple comparisons tests (****P<0.0001). (d) Numbers of LT-HSCs (left) and ST-HSCs (right) in the BMs of G0 and G5 mice treated with 5-aza (n=15/each) or vehicle (n=15 and n=14, respectively) for 1 week. Lines represent the means ± s.d. of three independent experiments. Statistical significance was calculated using one-way ANOVA and Tukey’s multiple comparisons test (***P<0.001). (e) Frequencies of quiescent (left) and cycling (right) LT-HSCs and ST-HSCs from G0 and G5 mice after 1 week of treatment with 5-aza (n=5/each) or vehicle (n=10 and n=15, respectively). Lines represent the means ± s.d. of one representative experiment of two. Statistical significance was calculated using one-way ANOVA and Tukey’s multiple comparisons tests (quiescent, LT-HSCs: ****P<0.0001, *P=0.031; ST-HSCs: ***P=0.0008, *P=0.01; cycling, LT-HSCs: ***P=0.0005). (f) Numbers of GMPs in the BMs of G0 and G5 mice treated with two cycles of 5-aza (n=9 and n=8, respectively) or vehicle (n=9 and n=10, respectively). Lines represent the means ± s.d. of two experiments. No statistical significance between vehicle- and 5-aza-treated mice was detected using one-way ANOVA and Tukey’s multiple comparisons test. Source data
Extended Data Fig. 7
Extended Data Fig. 7. MDS HSCs maintain the BM clonal burden in MDS-like mice during HMA therapy.
(a) Normalized CD45.2+ chimerism rates in HSCs (left) and MyHPCs (right) from mice competitively transplanted with CD45.1+ WT and CD45.2+ Vav-Cre or Vav-Cre/Tet2L/L (Tet2L/L) cells after two cycles of treatment with 5-aza (n=11 and n=13, respectively) or vehicle (n=13 and n=10, respectively). Lines represent the means ± s.d. of two independent experiments. No statistically significant differences were detected by one-way ANOVAs and Tukey’s multiple comparison tests for each cell type. (b) Normalized CD45.2+ chimerism frequencies in HSCs (left) and MyHPCs (right) from mice competitively transplanted with CD45.1+ WT and CD45.2+ Mx1-Cre or Mx1-Cre/Srsf2P95H (Srsf2P95H) cells after two cycles of treatment with 5-aza (n=12 and n=11, respectively) or vehicle (n=9 and n=12, respectively). Lines represent the means ± s.d. of two independent experiments. No statistically significant differences were detected using one-way ANOVAs and Tukey’s multiple comparison tests for each cell type. (c) Normalized CD45.2+ chimerism frequencies in HSCs (left) and MyHPCs (right) from mice competitively transplanted with CD45.1+ WT and CD45.2+ U2AF1wt/rtTA or U2AF1S34F/rtTA cells after two cycles of treatment with 5-aza (n=8/each) or vehicle (n=6 and n=5, respectively) in the presence of doxycycline. Lines represent the means ± s.d. of one experiment. No statistically significant differences were detected using one-way ANOVAs and Tukey’s multiple comparison tests for each cell type. (d) Normalized CD45.2+ chimerism frequencies in HSCs (left) and MyHPCs (right) from mice competitively transplanted with CD45.1+ WT and CD45.2+ Mx1-Cre or Mx1-Cre/Runx1L/+/Srsf2P95H (Runx1L/+/Srsf2P95H) cells after two cycles of treatment with 5-aza (n=5 and n=7, respectively) or vehicle (n=6 and n=7, respectively). Lines represent the means ± s.d. of one experiment. No statistically significant differences were detected using one-way ANOVAs and Tukey’s multiple comparison tests for each cell type. Source data
Extended Data Fig. 8
Extended Data Fig. 8. Distinct MDS HSCs expand during MDS progression and activate specific survival pathways.
(a) Cellularity rates in BM biopsies sequentially collected from CMP-pattern (n=3) and GMP-pattern (n=7) MDS patients at baseline (Bsln) and at the time of BP. (b) Frequencies of immunophenotypic LT-HSCs and LMPPs in total BM MNCs from CMP-pattern (n=3) and GMP-pattern (n=6) MDS patient samples, respectively, sequentially collected at bsln and BP. Statistical significance was calculated using a two-tailed ratio paired t-test (**P=0.0021). (c) Frequencies of immunophenotypic LT-HSCs in total BM MNCs from GMP-pattern MDS samples obtained at bsln (n=59) and BP (n=40). Lines represent medians ± IQRs. Statistical significance was calculated using the two-tailed Mann-Whitney test. (d) CD34 and BCL-2 expression in overlapping BM biopsy specimens obtained from a representative CMP-pattern MDS patient after HMA therapy failure with BP. Scale bars, 20 µm (400x magnification). (e) Frequency of phospho-p65+ cells in sequential BM biopsy specimens from five GMP-pattern MDS patients at baseline and BP. Statistical significance was calculated using a paired two-tailed Student t-test. A representative phospho-p65 staining is shown on the right. Scale bars, 20 µm (400x magnification). (f) Prevalence of newly detected somatic mutations in total BM MNCs from CMP-pattern (n=7) and GMP-pattern (n=8) MDS patients with BP. No statistically significant differences were detected using chi-square tests. (g) Variation in the VAFs of somatic mutations detected in BM MNCs from CMP-pattern and GMP-pattern MDS patients (n=11/each) at BP, compared with baseline. Each dot represents one variant (n=30 and n=40, respectively). Lines represent medians ± IQRs. No statistically significant differences were detected using a two-tailed Mann-Whitney test. Source data
Extended Data Fig. 9
Extended Data Fig. 9. Pharmacologically targeting the upregulated survival pathways in MDS HSCs reduces tumor burden and halts disease progression.
(a) Numbers of live cultured LT-HSCs from HD BMs (n=3) after 72 h of treatment with ABT-199. Lines represent means ± SEMs. (b) Numbers of active caspase-3/7+ Lin-CD34+ cells from CMP-pattern MDS patients with BP (n=2) treated with 50 nM ABT-199 and/or 0.5 µM 5-aza over 48 h. Symbols and lines represent means + SEMs. (c) Numbers of live LT-HSCs from baseline CMP-pattern MDS BM samples (n=7) after treatment with 0.5 µM 5-aza and/or 50 nM ABT-199 (ABT) for 72 h. Lines represent means ± s.d. No statistical significance was found using one-way ANOVA and Tukey’s multiple comparison test. (d) Representative Western blot of BCL-2 in MDS-L cells. The experiment was performed twice. Molecular weight marker positions are illustrative; a picture of the membrane can be visualized in the corresponding Source Data file. (e) Human CD45 chimerism in total splenic WBCs from MDS-L xenografts after treatment with vehicle (n=5), 5-aza (n=5), ABT-199 (n=6), or 5-aza and ABT-199 (n=5). Lines represent the means ± s.d. from one experiment. Statistical significance was calculated using one-way ANOVA and Tukey’s multiple comparison tests (*P=0.018). (f) Ratios of human BIM complexes with BCL-2, BCL-XL, and MCL-1 in BM cells isolated from MDS-L xenografts treated with ABT-199 for the indicated times (n=4/each). Lines represent the means ± s.d. of one experiment. Statistical significance was calculated using one-way ANOVAs and Dunnett’s multiple comparisons tests (**P=0.0062, *P=0.017). (g) Numbers of live BM LMPPs from HDs (n=5) and GMP-pattern MDS patients with BP (n=6) after treatment with 2.5 ng/mL hrTNF for 48 h. Lines represent means ± s.d. Statistical significance was calculated using an unpaired two-tailed Student t-test (**P=0.0087). (h) GSEA of genes significantly (P adj<0.05) upregulated in human myeloblasts (clusters 0, 1, 2, and 4 in Supplementary Figure 9a). Hallmark gene sets with a P<0.0001 and a gene enrichment overlap rate (k/K)>0.02 are shown. (i) GSEA of genes significantly (P adj<0.05) downregulated in human LMPPs and myeloblasts (clusters 0, 1, 2, and 3 in Supplementary Fig. 9b) from xenografts treated with BMS-345541 compared with those from xenografts treated with vehicle. Hallmark gene sets with a P<0.001 and a k/K>0.02 are shown. (j) Western blot of p65, phospho-p65 (p-p65), and BCL-2 in human cells isolated from GMP-pattern MDS xenografts from a patient with BP treated with BMS-345541 (BMS) or ABT-199 (ABT) in combination with 5-aza. The experiment was performed once. Molecular weight marker positions are illustrative; a picture of the membrane can be visualized in the corresponding Source Data file. (k) Human CD45 chimerism in total BM WBCs from the xenografts described in (j) after treatment. Each symbol represents one sample; lines represent the means ± s.d. of one experiment (n=7 mice/group). No statistical significance was detected using one-way ANOVA and Tukey’s multiple comparisons test. Source data
Extended Data Fig. 10
Extended Data Fig. 10. Venetoclax-based therapy selectively targets HSCs from CMP-pattern MDS at BP after HMA therapy failure.
(a) Heatmaps showing the normalized expression of CyTOF signaling pathway regulators in CD34+ HSPC clusters from the sequential CMP-pattern (top) or GMP-pattern (bottom) MDS samples shown in Fig. 4c. SD, stable disease; mCR, marrow complete remission; C0, cycle zero; PD, progressive disease. (b) Distribution (%) of the total number of BM MNCs from a GMP-pattern patient with BP among the scRNA-seq clusters shown in Supplementary Fig. 11a at each time point of venetoclax-based therapy. Lymph, lymphoid; My, myeloid. (c) Differential expression of cluster 1 marker genes significantly enriched in the TNF signaling via NF-κB pathway as indicated in in Fig. 4e, across all clusters shown in Supplementary Fig. 11. Source data

References

    1. Will B, et al. Stem and progenitor cells in myelodysplastic syndromes show aberrant stage-specific expansion and harbor genetic and epigenetic alterations. Blood. 2012;120:2076–2086. doi: 10.1182/blood-2011-12-399683. - DOI - PMC - PubMed
    1. Woll PS, et al. Myelodysplastic syndromes are propagated by rare and distinct human cancer stem cells in vivo. Cancer Cell. 2014;25:794–808. doi: 10.1016/j.ccr.2014.03.036. - DOI - PubMed
    1. Mortera-Blanco T, et al. SF3B1-initiating mutations in MDS-RSs target lymphomyeloid hematopoietic stem cells. Blood. 2017;130:881–890. doi: 10.1182/blood-2017-03-776070. - DOI - PMC - PubMed
    1. Chesnais V, et al. Architectural and functional heterogeneity of hematopoietic stem/progenitor cells in non-del(5q) myelodysplastic syndromes. Blood. 2017;129:484–496. doi: 10.1182/blood-2016-03-707745. - DOI - PubMed
    1. Sperling AS, Gibson CJ, Ebert BL. The genetics of myelodysplastic syndrome: from clonal haematopoiesis to secondary leukaemia. Nat. Rev. Cancer. 2017;17:5–19. doi: 10.1038/nrc.2016.112. - DOI - PMC - PubMed

Publication types

MeSH terms