. 2022 Feb 15:16:815697.
doi: 10.3389/fnins.2022.815697. eCollection 2022.

The 3-Minute Psychomotor Vigilance Test Demonstrates Inadequate Convergent Validity Relative to the 10-Minute Psychomotor Vigilance Test Across Sleep Loss and Recovery

Affiliations

The 3-Minute Psychomotor Vigilance Test Demonstrates Inadequate Convergent Validity Relative to the 10-Minute Psychomotor Vigilance Test Across Sleep Loss and Recovery

Caroline A Antler et al. Front Neurosci. .

Abstract

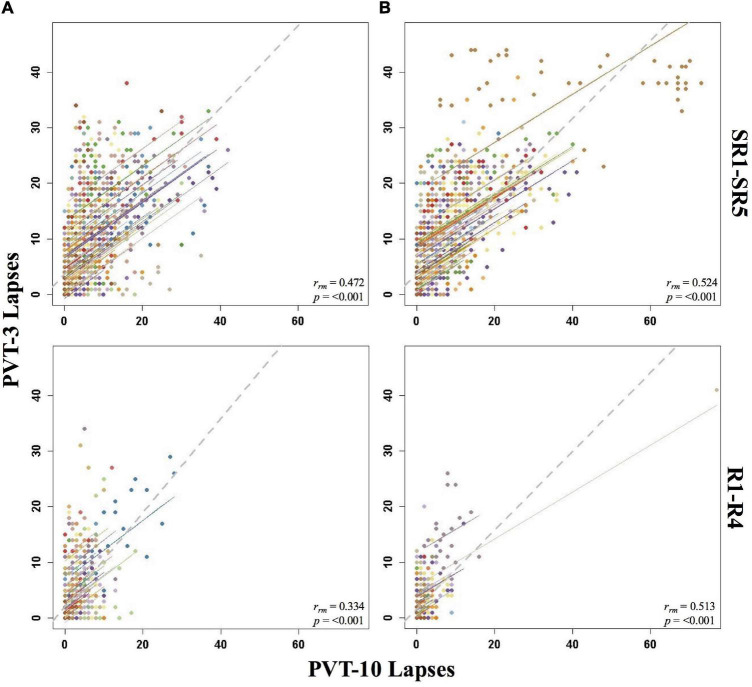
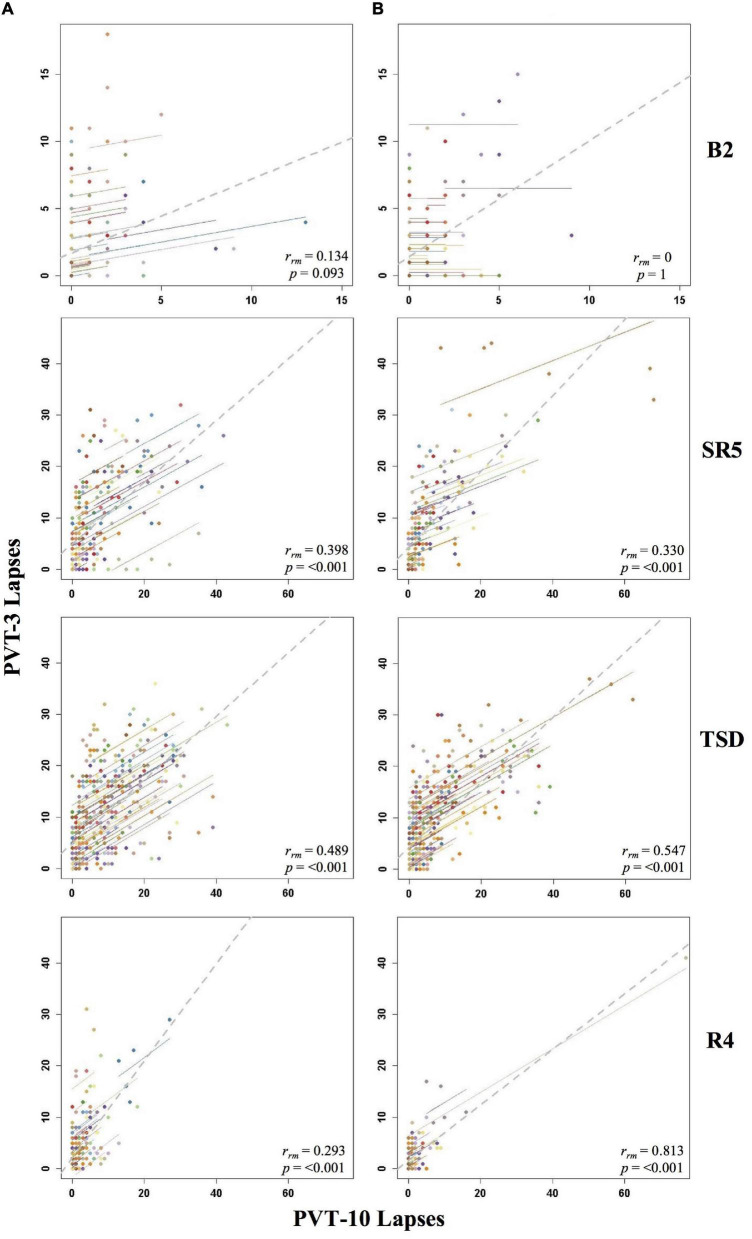
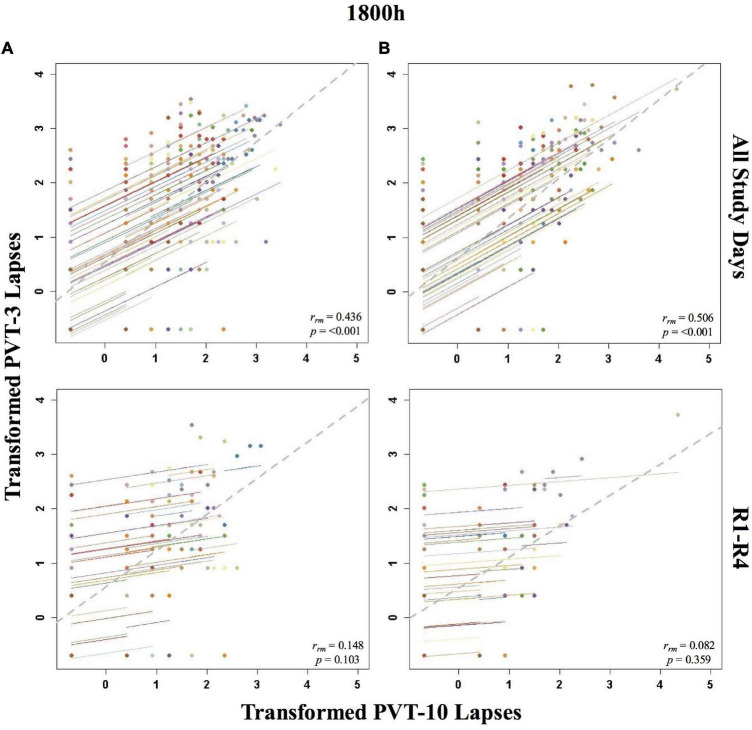
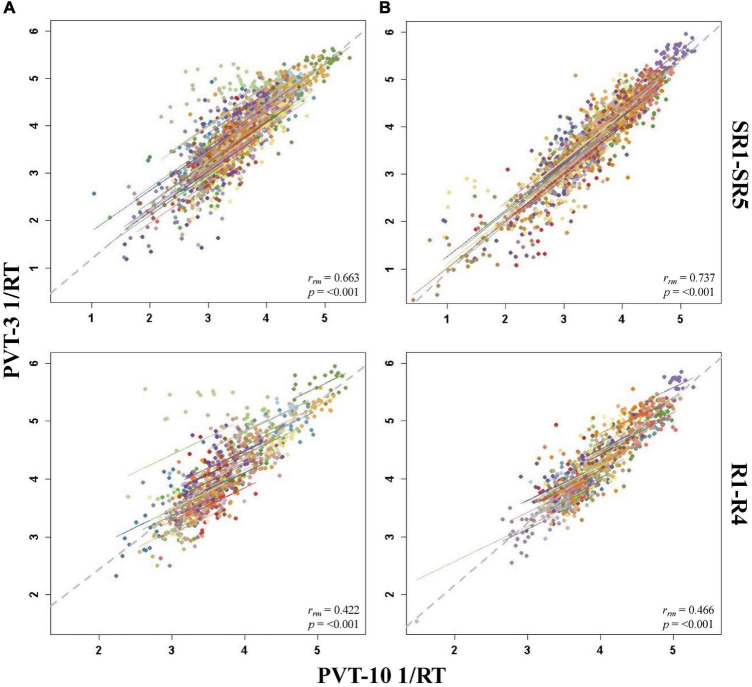
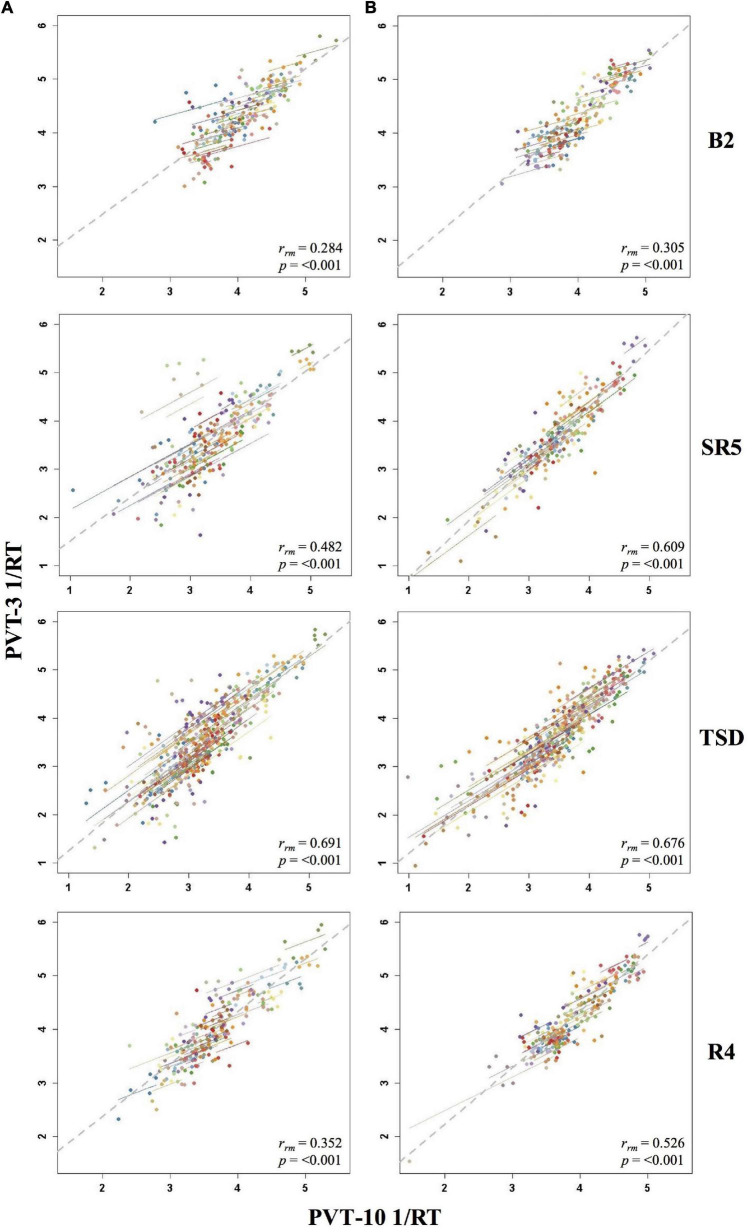
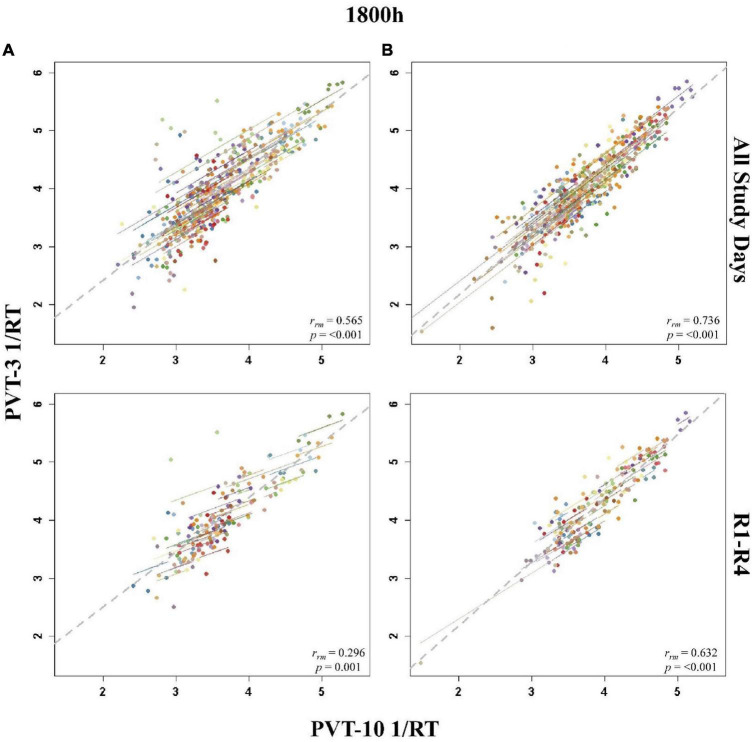
The Psychomotor Vigilance Test (PVT) is a widely used behavioral attention measure, with the 10-min (PVT-10) and 3-min (PVT-3) as two commonly used versions. The PVT-3 may be comparable to the PVT-10, though its convergent validity relative to the PVT-10 has not been explicitly assessed. For the first time, we utilized repeated measures correlation (rmcorr) to evaluate intra-individual associations between PVT-10 and PVT-3 versions across total sleep deprivation (TSD), chronic sleep restriction (SR) and multiple consecutive days of recovery. Eighty-three healthy adults (mean ± SD, 34.7 ± 8.9 years; 36 females) received two baseline nights (B1-B2), five SR nights (SR1-SR5), 36 h TSD, and four recovery nights (R1-R4) between sleep loss conditions. The PVT-10 and PVT-3 were completed every 2 h during wakefulness. Rmcorr compared responses on two frequently used, sensitive PVT metrics: reaction time (RT) via response speed (1/RT) and lapses (RT > 500 ms on the PVT-10 and > 355 ms on the PVT-3) by day (e.g., B2), by study phase (e.g., SR1-SR5), and by time point (1000-2000 h). PVT 1/RT correlations were generally stronger than those for lapses. The majority of correlations (48/50 [96%] for PVT lapses and 38/50 [76%] for PVT 1/RT) were values below 0.70, indicating validity issues. Overall, the PVT-3 demonstrated inadequate convergent validity with the "gold standard" PVT-10 across two different types of sleep loss and across extended recovery. Thus, the PVT-3 is not interchangeable with the PVT-10 for assessing behavioral attention performance during sleep loss based on the design of our study and the metrics we evaluated. Our results have substantial implications for design and measure selection in laboratory and applied settings, including those involving sleep deprivation.

Keywords: Psychomotor Vigilance Test; behavioral attention; convergent validity; lapses; recovery; repeated measures correlation; response speed; sleep deprivation.


Conflict of interest statement

The authors declare that the research was conducted in the absence of any commercial or financial relationships that could be construed as a potential conflict of interest.

Figures

FIGURE 1
FIGURE 1
Rmcorr plots of repeated-measures correlations between 10-min Psychomotor Vigilance Test (PVT-10) and 3-min Psychomotor Vigilance Test (PVT-3) lapses by study phase for Condition A (A) and Condition B (B). Each color represents a distinct participant with each point showing performance on both measures at one time point while the corresponding line shows the rmcorr fit for that participant (Bakdash and Marusich, 2020; R Core Team, 2020). The gray dashed line represents the regression line obtained by ignoring repeated measurements and treating the data as independent observations; rrm represents the common within-individual association (rmcorr). Rmcorr effect sizes were interpreted as follows: 0.00–0.29, negligible; 0.30–0.49, weak; 0.50–0.69, moderate; 0.70–0.89, strong; and 0.90–1.00, very strong. Included time points for study phases were as follows: sleep restriction day one from 0800 h through sleep restriction day five at 2000 h (SR1-SR5) and recovery day one from 1000 h through recovery day four at 2000 h (R1-R4).
FIGURE 2
FIGURE 2
Rmcorr plots of repeated-measures correlations between 10-min Psychomotor Vigilance Test (PVT-10) and 3-min Psychomotor Vigilance Test (PVT-3) lapses by study day for Condition A (A) and Condition B (B). Each color represents a distinct participant with each point showing performance on both measures at one time point while the corresponding line shows the rmcorr fit for that participant (Bakdash and Marusich, 2020; R Core Team, 2020). The gray dashed line represents the regression line obtained by ignoring repeated measurements and treating the data as independent observations; rrm represents the common within-individual association (rmcorr). Rmcorr effect sizes were interpreted as follows: 0.00–0.29, negligible; 0.30–0.49, weak; 0.50–0.69, moderate; 0.70–0.89, strong; and 0.90–1.00, very strong. Included time points for each day were as follows: baseline day 2 (B2) from 1000 to 2200 h; sleep restriction day 5 (SR5) from 0800 to 2000 h; total sleep deprivation (TSD) from 2200 to 2000 h; and recovery day 4 (R4) from 1000 to 2000 h.
FIGURE 3
FIGURE 3
Rmcorr plots of repeated-measures correlations between 10-min Psychomotor Vigilance Test (PVT-10) and 3-min Psychomotor Vigilance Test (PVT-3) transformed lapses at 1800 h across the entire study (All Study Days) and across only recovery days 1–4 (R1-R4) for Condition A (A) and Condition B (B). Each color represents a distinct participant with each point showing performance on both measures at one time point while the corresponding line shows the rmcorr fit for that participant (Bakdash and Marusich, 2020; R Core Team, 2020). The gray dashed line represents the regression line obtained by ignoring repeated measurements and treating the data as independent observations; rrm represents the common within-individual association (rmcorr). Rmcorr effect sizes were interpreted as follows: 0.00–0.29, negligible; 0.30–0.49, weak; 0.50–0.69, moderate; 0.70–0.89, strong; and 0.90–1.00, very strong. Values were transformed by adding 0.5 and natural log transforming the result.
FIGURE 4
FIGURE 4
Rmcorr plots of repeated-measures correlations between 10-min Psychomotor Vigilance Test (PVT-10) and 3-min Psychomotor Vigilance Test (PVT-3) response speed (1/RT) by study phase for Condition A (A) and Condition B (B). Each color represents a distinct participant with each point showing performance on both measures at one time point while the corresponding line shows the rmcorr fit for that participant (Bakdash and Marusich, 2020; R Core Team, 2020). The gray dashed line represents the regression line obtained by ignoring repeated measurements and treating the data as independent observations; rrm represents the common within-individual association (rmcorr). Rmcorr effect sizes were interpreted as follows: 0.00–0.29, negligible; 0.30–0.49, weak; 0.50–0.69, moderate; 0.70–0.89, strong; and 0.90–1.00, very strong. Included time points were as follows: sleep restriction day one from 0800 h through sleep restriction day five at 2000 h (SR1-SR5) and recovery day one from 1000 h through recovery day four at 2000 h (R1–R4).
FIGURE 5
FIGURE 5
Rmcorr plots of repeated-measures correlations between 10-min Psychomotor Vigilance Test (PVT-10) and 3-min Psychomotor Vigilance Test (PVT-3) response speed (1/RT) by study day for Condition A (A) and Condition B (B). Each color represents a distinct participant with each point showing performance on both measures at one time point while the corresponding line shows the rmcorr fit for that participant (Bakdash and Marusich, 2020; R Core Team, 2020). The gray dashed line represents the regression line obtained by ignoring repeated measurements and treating the data as independent observations; rrm represents the common within-individual association (rmcorr). Rmcorr effect sizes were interpreted as follows: 0.00–0.29, negligible; 0.30–0.49, weak; 0.50–0.69, moderate; 0.70–0.89, strong; and 0.90–1.00, very strong. Included time points for each day were as follows: baseline day 2 (B2) from 1000 to 2200 h; sleep restriction day 5 (SR5) from 0800 to 2000 h; total sleep deprivation (TSD) from 2200 to 2000 h; and recovery day 4 (R4) from 1000 to 2000 h.
FIGURE 6
FIGURE 6
Rmcorr plots of repeated-measures correlations between 10-min Psychomotor Vigilance Test (PVT-10) and 3-min Psychomotor Vigilance Test (PVT-3) response speed (1/RT) at 1800 h across the entire study (All Study Days) and across only recovery days 1–4 (R1-R4) for Condition A (A) and Condition B (B). Each color represents a distinct participant with each point showing performance on both measures at one time point while the corresponding line shows the rmcorr fit for that participant (Bakdash and Marusich, 2020; R Core Team, 2020). The gray dashed line represents the regression line obtained by ignoring repeated measurements and treating the data as independent observations; rrm represents the common within-individual association (rmcorr). Rmcorr effect sizes were interpreted as follows: 0.00–0.29, negligible; 0.30–0.49, weak; 0.50–0.69, moderate; 0.70–0.89, strong; and 0.90–1.00, very strong.

Similar articles

References

    1. Arsintescu L., Kato K. H., Cravalho P. F., Feick N. H., Stone L. S., Flynn-Evans E. E. (2019). Validation of a touchscreen psychomotor vigilance task. Accid. Anal. Prev. 126 173–176. 10.1016/j.aap.2017.11.041 - DOI - PubMed
    1. Bakdash J. Z., Marusich L. R. (2017). Repeated measures correlation. Front. Psychol. 8:456. 10.3389/fpsyg.2017.00456 - DOI - PMC - PubMed
    1. Bakdash J. Z., Marusich L. R. (2020). rmcorr: Repeated Measures Correlation. R Package Version 0.4.1. Available Online at: https://CRAN.R-project.org/package=rmcorr. (accessed April 16, 2021).
    1. Banks S., Van Dongen H. P. A., Maislin G., Dinges D. F. (2010). Neurobehavioral dynamics following chronic sleep restriction: dose-response effects of one night for recovery. Sleep 33 1013–1026. 10.1093/sleep/33.8.1013 - DOI - PMC - PubMed
    1. Basner M., Dinges D. F. (2011). Maximizing sensitivity of the psychomotor vigilance test (PVT) to sleep loss. Sleep 34 581–591. 10.1093/sleep/34.5.581 - DOI - PMC - PubMed