. 2022 Feb 15:13:785361.
doi: 10.3389/fnsyn.2021.785361. eCollection 2021.

Dynamics of Neuromuscular Transmission Reproduced by Calcium-Dependent and Reversible Serial Transitions in the Vesicle Fusion Complex

Affiliations

Dynamics of Neuromuscular Transmission Reproduced by Calcium-Dependent and Reversible Serial Transitions in the Vesicle Fusion Complex

Alejandro Martínez-Valencia et al. Front Synaptic Neurosci. .

Abstract

Neuromuscular transmission, from spontaneous release to facilitation and depression, was accurately reproduced by a mechanistic kinetic model of sequential maturation transitions in the molecular fusion complex. The model incorporates three predictions. First, calcium-dependent forward transitions take vesicles from docked to preprimed to primed states, followed by fusion. Second, prepriming and priming are reversible. Third, fusion and recycling are unidirectional. The model was fed with experimental data from previous studies, whereas the backward (β) and recycling (ρ) rate constant values were fitted. Classical experiments were successfully reproduced with four transition states in the model when every forward (α) rate constant had the same value, and both backward rate constants were 50-100 times larger. Such disproportion originated an abruptly decreasing gradient of resting vesicles from docked to primed states. By contrast, a three-state version of the model failed to reproduce the dynamics of transmission by using the same set of parameters. Simulations predict the following: (1) Spontaneous release reflects primed to fusion spontaneous transitions. (2) Calcium elevations synchronize the series of forward transitions that lead to fusion. (3) Facilitation reflects a transient increase of priming following the calcium-dependent maturation transitions. (4) The calcium sensors that produce facilitation are those that evoke the transitions form docked to primed states. (5) Backward transitions and recycling restore the resting state. (6) Depression reflects backward transitions and slow recycling after intense release. Altogether, our results predict that fusion is produced by one calcium sensor, whereas the modulation of the number of vesicles that fuse depends on the calcium sensors that promote the early transition states. Such finely tuned kinetics offers a mechanism for collective non-linear transitional adaptations of a homogeneous vesicle pool to the ever-changing pattern of electrical activity in the neuromuscular junction.

Keywords: calcium; depression; facilitation; fusion complex; kinetics; neuromuscular synapse; synapse; transmitter release.


Conflict of interest statement

The authors declare that the research was conducted in the absence of any commercial or financial relationships that could be construed as a potential conflict of interest.

Figures

FIGURE 1
FIGURE 1
Kinetic model of molecular transitions of the fusion complex in individual vesicles. D, docked; pP, preprimed; P, primed; F, fusion; α, forward rate constant; f(t), calcium time dependence of the forward transition; β, backward rate constant; ρ, recycling rate constant. D ⇌ pP ⇌ P are bidirectional; PFD are unidirectional; spontaneous transitions occur following the corresponding rate constant. On electrical activity, the calcium-dependence accelerates the DppPPF transitions.
FIGURE 2
FIGURE 2
Spontaneous quantal release. (A) Experimental (black) and simulated (red) time distributions of spontaneous mepps from 5-min recording intervals. The experimental distribution of 143 mepps was obtained with license from Boyd and Martin (1956b); the simulation contains 148 mepps. The 1.54 s decay half time of the experimental probability rendered the value of α as 0.62 s–1 value used in simulations of cat neuromuscular transmission along the paper. (B) Predicted contributions of the α and λ values on the mepp spontaneous frequency. Arrowheads point to values that gave the best fittings in simulations of frog and cat transmission. (C) Predicted mepps frequency as a function of the λ coefficient in frog (vermillion) and cat (black) synapses. The ρ = 1.0 value was equally successful in all simulations. Arrowheads point to experimental mepp frequencies at the indicated temperatures, from Boyd and Martin (1956a). (D) Effect of α on release with different number of kinetic steps. (E) Effect of λ on release with different number of kinetic steps. The gray lines in (D,E) are the α and λ values that reproduce all forms of release in frog neuromuscular junction. Arrowheads indicate the α and λ values that reproduce release with five kinetic steps. Three kinetic steps failed to reproduce spontaneous release regardless of the α and λ values.
FIGURE 3
FIGURE 3
“Calcium-dependence” of quantal release. (A) The mean number of quanta (m) depends on the mean decay time (τe) of the intracellular calcium increase. The dots are model predictions; the lines were obtained with the equation by Dodge and Rahamimoff (1967) with third and fourth order cooperativities. (B) The normalized number of quanta (m/mmax) depends on the normalized t/τe duration of the calcium signal. The traces are superimpositions of curves obtained using two different amplitudes (Ie, arbitrary units) of calcium signal. The semilogarithmic chart in the inset shows the dispersion from a single exponential behavior below t/τe = 1. (C) Increasing the value of α accelerated the release. (D) Adding kinetic steps to the model increased the latency of release.
FIGURE 4
FIGURE 4
Evoked quantal release at low probability experimental conditions. (A) Amplitude distributions of quantal release in frog neuromuscular junction. Counts are the number of quanta from single runs of the program; the black lines link the discrete Poisson classes. The τe values are above in each plot. (B) Amplitude distributions at increasing probabilities by use of larger τe values. The discrepancies between the simulations and the Poisson predictions are clear with τe values above 0.25 ms. Each plot contains data from 250 stimuli mediated by a 5-s recovery interval. (C) Pearson’s significance (p) dependence on the τe value. The horizontal line indicates the 0.05 significance.
FIGURE 5
FIGURE 5
Contribution of the backward rate constant to quantal release. Data are presented in terms of the λ = β/α coefficients. λ1 corresponds to D ⇌ pP; λ2 corresponds to pP ⇌ P. The plots are as in Figure 4. The Pearson’s significance (p) appears in each chart. The central chart was obtained with λ1 = λ2 = 50, which fitted every form of release in frog synapses. Other parameters were α = 0.3 s–1, ρ = 1.0 s–1, and τe = 0.15 ms.
FIGURE 6
FIGURE 6
Sequence of facilitation and depression in frog neuromuscular junction. (A) Number of quanta released in response to a train of three conditioning pulses 30 ms apart, followed by a test pulse 250 ms later (Mallart and Martin, 1968). Facilitation on the second and third impulses was followed by depression on the test pulse. The traces are averages of 1,000 runs in the program. The inset amplifies a single run in the region contained in green to show asynchronous release after the conditioning impulses. The simulation parameters were α = 0.3 s–1; λ = 50; ρ = 1.0 s–1, and τe = 1.3 ms. (B) Elimination of facilitation by a briefer τe = 0.3 ms coupled to the α transitions of the third conditioning impulse simulates the presence of intracellular calcium chelator in crayfish neuromuscular junction (Kamiya and Zucker, 1994). The inset shows persistence of asynchronous release with lower frequency after the third impulse.
FIGURE 7
FIGURE 7
Calcium and rate constants influence short-term plasticity. (A) The duration of the calcium signal (τe) determines the balance between facilitation and depression. (B) The λ2 coefficient determines the duration of facilitation. (C) The λ1 coefficient reduces facilitation and depression. Ntest/N1cond is the ratio between the amplitude of the response to the test pulse (Ntest) and the conditioned pulse (N1cond). Values above 1.0 indicate facilitation; values below 1.0 indicate depression. Experimental data obtained with license from Betz (1970).
FIGURE 8
FIGURE 8
Vesicle recycling affects depression. The arrowhead denotes increased facilitation at high ρ value. Note the similar time course of the facilitation–depression sequence on extreme ρ values. Data were obtained with conventional α and λ values for frog.
FIGURE 9
FIGURE 9
Short-term plasticity with different numbers of kinetic steps. (A) Three kinetic steps produced depression without facilitation. (B) Five kinetic steps reproduced short-term plasticity by using a larger α = 0.62 s– 1 and a smaller λ = 21.
FIGURE 10
FIGURE 10
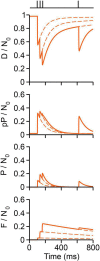
Vesicle dynamics in frog neuromuscular junction. The stimulation protocol is shown above (Mallart and Martin, 1968). The proportion of vesicles in each state is normalized to a pool of 10,000 (N0) vesicles. Calcium produces rapid D ⇀ pP ⇀ P ⇀ F transitions. Reversibility contributes to rapid recovery to resting state. Recycling contributes to slow recovery and depression.

Similar articles

Cited by

References

    1. Alabi A. A., Tsien R. W. (2012). Synaptic vesicle pools and dynamics. Cold Spring Harb. Perspect. Biol. 4:a013680. 10.1101/cshperspect.a013680 - DOI - PMC - PubMed
    1. Andrews-Zwilling Y. S., Kawabe H., Reim K., Varoqueaux F., Brose N. (2006). Binding to Rab3A-interacting molecule RIM regulates the presynaptic recruitment of Munc13-1 and ubMunc13-2. J. Biol. Chem. 281 19720–19731. 10.1074/jbc.M601421200 - DOI - PubMed
    1. Atluri P. P., Regehr W. G. (1998). Delayed release of neurotransmitter from cerebellar granule cells. J. Neurosci. 18 8214–8227. 10.1523/JNEUROSCI.18-20-08214.1998 - DOI - PMC - PubMed
    1. Augustine G. J., Charlton M. P. (1986). Calcium dependence of presynaptic calcium current and post-synaptic response at the squid giant synapse. J. Physiol. 381 619–640. 10.1113/jphysiol.1986.sp016347 - DOI - PMC - PubMed
    1. Bacaj T., Wu D., Burré J., Malenka R. C., Liu X., Südhof T. C. (2015). Synaptotagmin-1 and -7 are redundantly essential for maintaining the capacity of the readily-releasable pool of synaptic vesicles. PLoS Biol. 13:e1002267. 10.1371/journal.pbio.1002267 - DOI - PMC - PubMed

LinkOut - more resources