

Dynamics of COVID-19 in Amazonia: A history of government denialism and the risk of a third wave
- PMID: 35242505
- PMCID: PMC8883727
- DOI: 10.1016/j.pmedr.2022.101752
Dynamics of COVID-19 in Amazonia: A history of government denialism and the risk of a third wave
Abstract
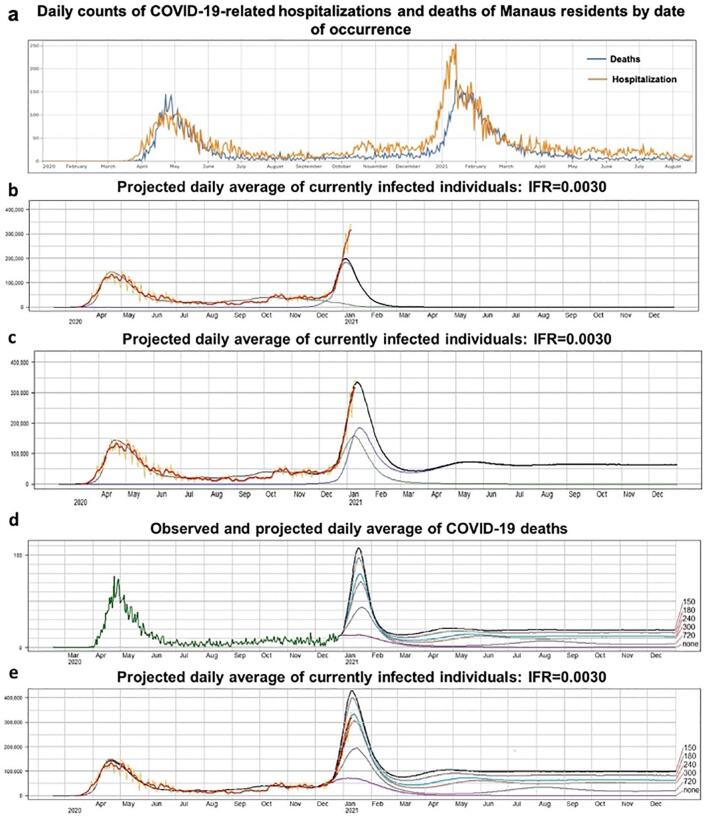
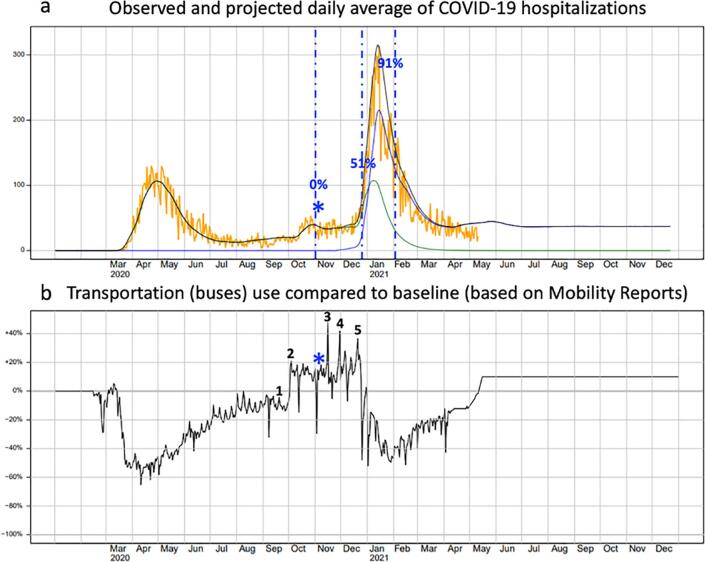
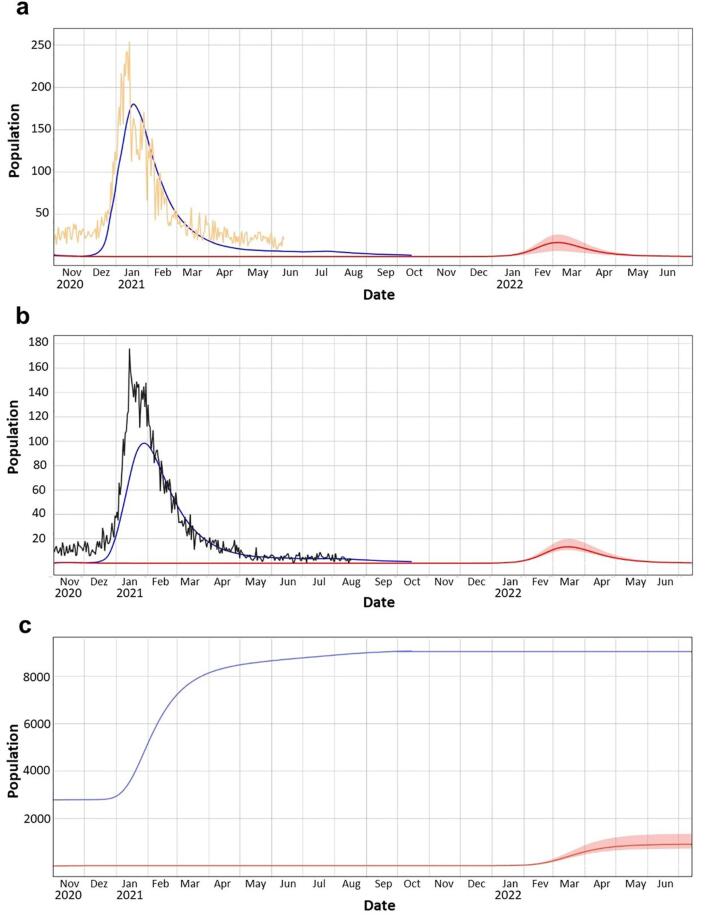
The city of Manaus (the capital of Brazil's state of Amazonas) has become a key location for understanding the dynamics of the global pandemic of COVID-19. Different groups of scientists have foreseen different scenarios, such as the second wave or that Manaus could escape such a wave by having reached herd immunity. Here we test five hypotheses that explain the second wave of COVID-19 in Manaus: 1) The greater transmissibility of the Amazonian (gamma or P.1) variant is responsible for the second wave; 2) SARS-CoV-2 infection levels during the first wave were overestimated by those foreseeing herd immunity, and the population remained below this threshold when the second wave began at the beginning of December 2020; 3) Antibodies acquired from infection by one lineage do not confer immunity against other lineages; 4) Loss of immunity has generated a feedback phenomenon among infected people, which could generate future waves, and 5) A combination of the foregoing hypotheses. We also evaluated the possibility of a third wave in Manaus despite advances in vaccination, the new wave being due to the introduction of the delta variant in the region and the loss of immunity from natural contact with the virus. We developed a multi-strain SEIRS (Susceptible-Exposed-Infected-Removed-Susceptible) model and fed it with data for Manaus on mobility, COVID-19 hospitalizations, numbers of cases and deaths. Our model contemplated the current vaccination rates for all vaccines applied in Manaus and the individual protection rates already known for each vaccine. Our results indicate that the SARS-CoV-2 gamma (P.1) strain that originated in the Amazon region is not the cause of the second wave of COVID-19 in Manaus, but rather this strain originated during the second wave and became predominant in January 2021. Our multi-strain SEIRS model indicates that neither the doubled transmission rate of the gamma variant nor the loss of immunity alone is sufficient to explain the sudden rise of hospitalizations in late December 2020. Our results also indicate that the most plausible explanation for the current second wave is a SARS-CoV-2 infection level at around 50% of the population in early December 2020, together with loss of population immunity and early relaxation of restrictive measures. The most-plausible model indicates that contact with one strain does not provide protection against other strains and that the gamma variant has a transmissibility rate twice that of the original SARS-CoV-2 strain. Our model also shows that, despite the advance of vaccination, and even if future vaccination advances at a steady pace, the introduction of the delta variant or other new variants could cause a new wave of COVID-19.
Keywords: Brazil; Coronavirus; Delta variant; Epidemiology; Gamma variant; Immunity loss; Manaus; Multi-strain SEIRS model; Pandemic; Public health; Public health policy; Reinfection; SARS-CoV-2; Transmissibility.
© 2022 Published by Elsevier Inc.
Conflict of interest statement
The authors declare that they have no known competing financial interests or personal relationships that could have appeared to influence the work reported in this paper.
Figures

References
-
- Amazonas Atual, 2021. FVS confirma quatro casos de Covid da variante delta em Manaus e dois no interior. – Amazonas Atual, 18/8/2021. – Online available at: https://amazonasatual.com.br/fvs-confirma-quatro-casos-de-covid-da-varia....
-
- Bakker, M., Berke, A., Groh, M. et al., 2020. Effect of social distancing measures in the New York City metropolitan area: Main findings. Massachusetts Institute of Technology (MIT), Boston MA. http://curveflattening.media.mit.edu/Social_Distancing_New_York_City.pdf.
-
- Bernal J.L., Andrews N., Goweret C., et al. Effectiveness of Covid-19 vaccines against the B.1.617.2 (Delta) Variant. N. Engl. J. Med. 2021;385:585–594. https://www.nejm.org/doi/full/10.1056/nejmoa2108891 - DOI - PMC - PubMed
LinkOut - more resources
Full Text Sources
Miscellaneous
