

Characterization of changes in the tyrosine pathway by 24-h profiling during nitisinone treatment in alkaptonuria
- PMID: 35242577
- PMCID: PMC8856922
- DOI: 10.1016/j.ymgmr.2022.100846
Characterization of changes in the tyrosine pathway by 24-h profiling during nitisinone treatment in alkaptonuria
Abstract
Background: Although changes in the tyrosine pathway during nitisinone therapy are known, a complete characterization of the induced tyrosinaemia is lacking to improve disease management.
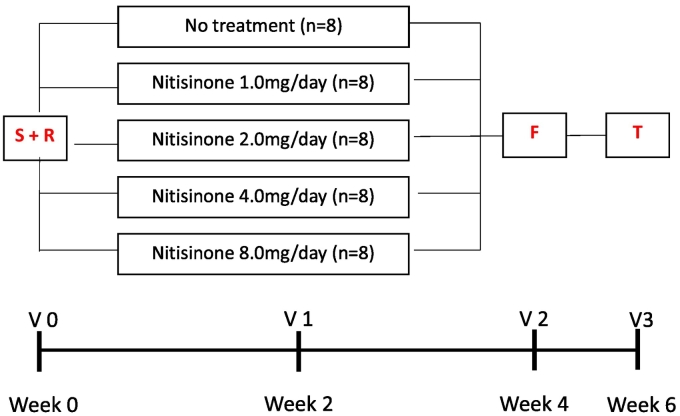
Patients and methods: Our research aims were addressed by 24-h blood sampling. 40 patients with alkaptonuria (AKU), treated with 0, 1, 2, 4 and 8 mg nitisinone daily (n = 8), were studied over four weeks. Serum homogentisic acid (sHGA), tyrosine (sTYR), phenylalanine (sPHE), hydroxyphenylpyruvate (sHPPA), hydroxyphenyllactate (sHPLA) and nitisinone (sNIT) were measured at baseline and after four weeks.
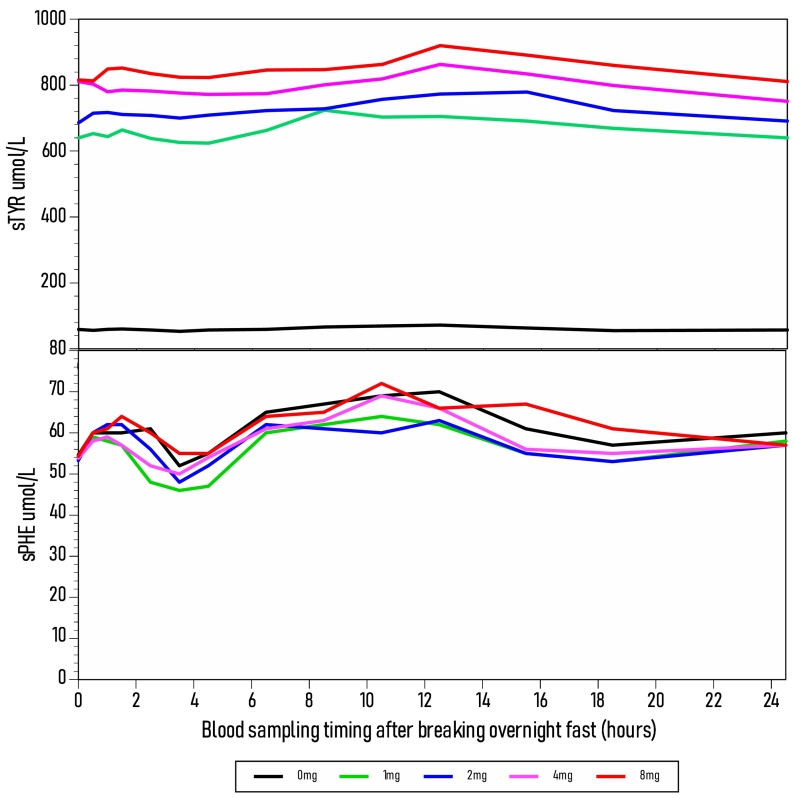
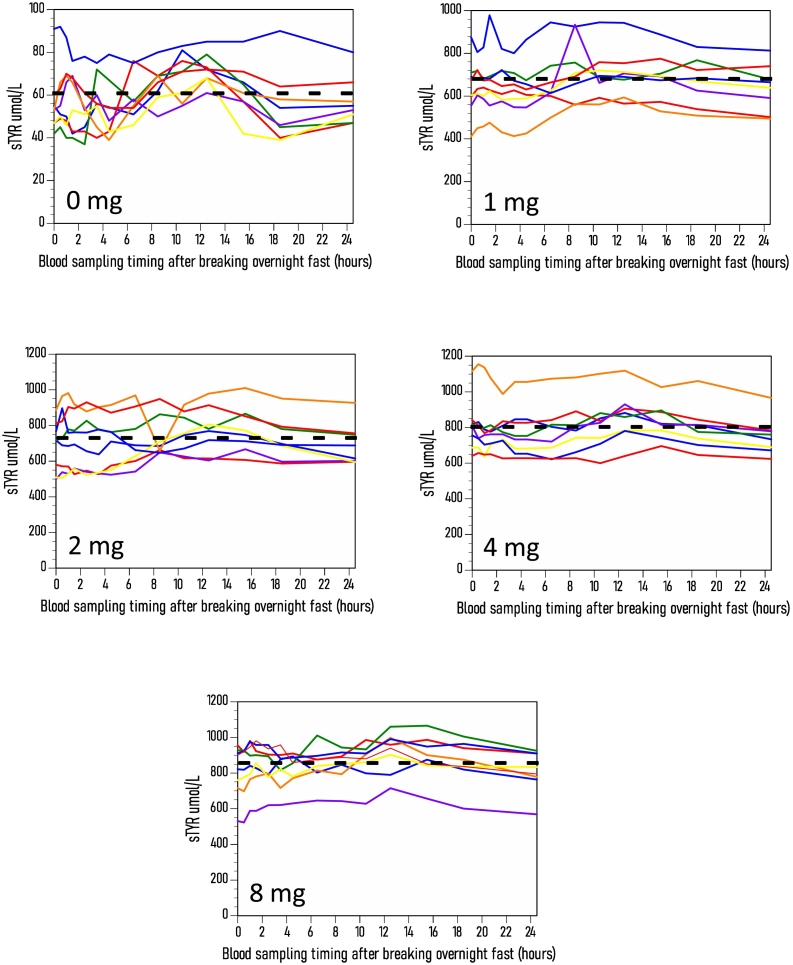
Results: sNIT showed a clear dose-proportional response. sTYR increased markedly but with less clear-cut dose responses after nitisinone. Fasting and average 24-h (Cav) sTYR responses were similar. Individual patient sTYR 24-h profiles showed significant fluctuations during nitisinone therapy. At week 4, sTYR, sHPPA and sHPPL all showed dose-related increases compared to V0, with the greatest difference between 1 and 8 mg nitisinone seen for HPLA, while there was no change from V0 in sPHE. sHGA decreased to values around the lower limit of quantitation.
Discussion: There was sustained tyrosinaemia after four weeks of nitisinone therapy with significant fluctuations over the day in individual patients. Diet and degree of conversion of HPPA to HPLA may determine extent of nitisinone-induced tyrosinaemia.
Conclusion: A fasting blood sample is recommended to monitor sTYR during nitisinone therapy Adaptations in HPPA metabolites as well as the inhibition of tyrosine aminotransferase could be contributing factors generating tyrosinaemia during nitisinone therapy.
Keywords: 24-h sampling; Alkaptonuria; Homogentisic acid; Hydroxyphenyllactate; Hydroxyphenylpyruvate; Nitisinone; Phenylalanine; Tyrosine.
© 2022 Published by Elsevier Inc.
Conflict of interest statement
Lakshminarayan Ranganath received fees for lectures and consultations from Swedish Orphan Biovitrum. Mattias Rudebeck and Olsson B, are share-holders and were employees of Swedish Orphan Biovitrum at the time of the study.
Figures


References
-
- O’Brien W.M., La Du B.N., Bunim J.J. Biochemical, pathologic and clinical aspects of alcaptonuria, ochronosis and ochronotic arthropathy: review of world literature (1584–1962) Am. J. Med. 1963;34:813–838.
-
- Phornphutkul C., Introne W.J., Perry M.B., et al. Natural history of alkaptonuria. N. Engl. J. Med. 2002;347:2111–2121. - PubMed
-
- Ranganath L.R., Khedr M., Milan A.M., et al. Nitisinone arrests ochronosis and decreases rate of progression of alkaptonuria: evaluation of the effect of nitisinone in the United Kingdom National Alkaptonuria Centre. Mol. Genet. Metab. 2018;125:127–134. - PubMed
-
- First treatment for rare metabolic disorder alkaptonuria. https://www.ema.europa.eu/en/news/first-treatment-raremetabolic-disorder.... Accessed December 1, 2021.
LinkOut - more resources
Full Text Sources
