. 2022 Feb 7:9:256-268.
doi: 10.1016/j.toxrep.2022.01.011. eCollection 2022.

Rapeseed (canola) oil aggravates metabolic syndrome-like conditions in male but not in female stroke-prone spontaneously hypertensive rats (SHRSP)

Affiliations

Rapeseed (canola) oil aggravates metabolic syndrome-like conditions in male but not in female stroke-prone spontaneously hypertensive rats (SHRSP)

Mai Nishikawa et al. Toxicol Rep. .

Abstract

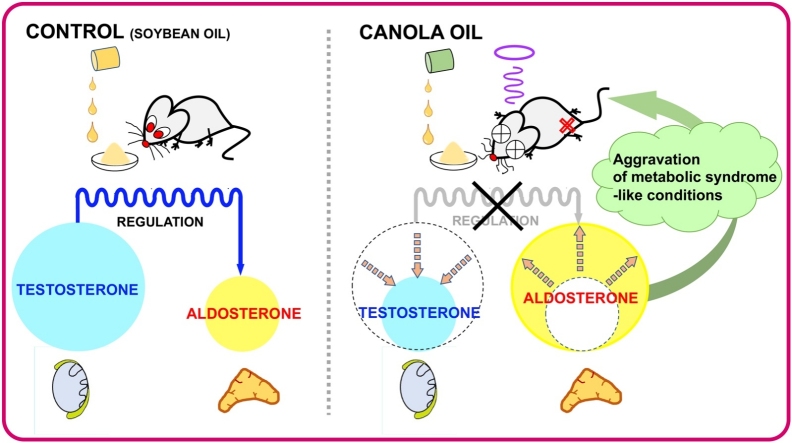
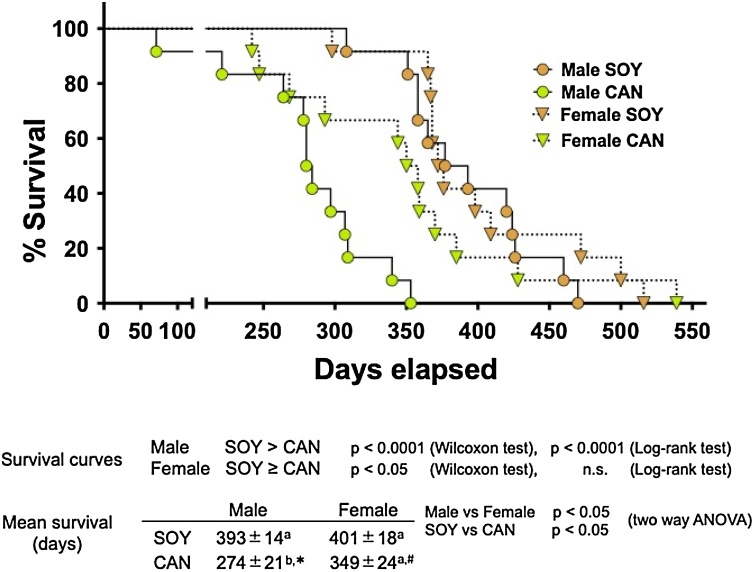
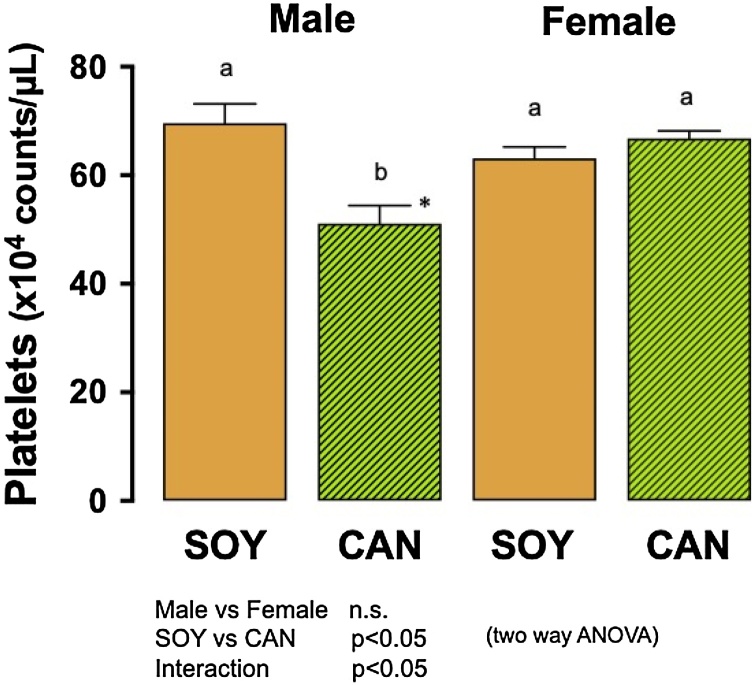
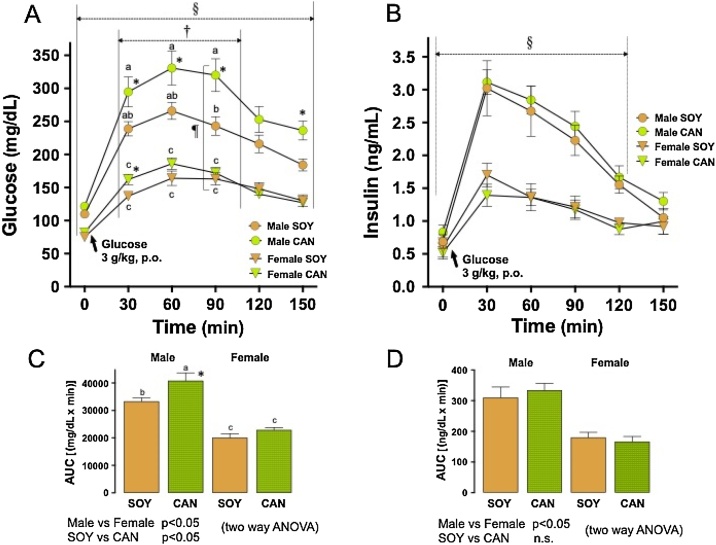
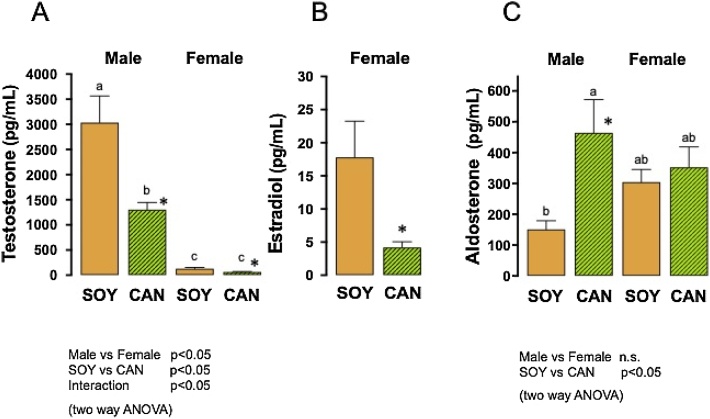
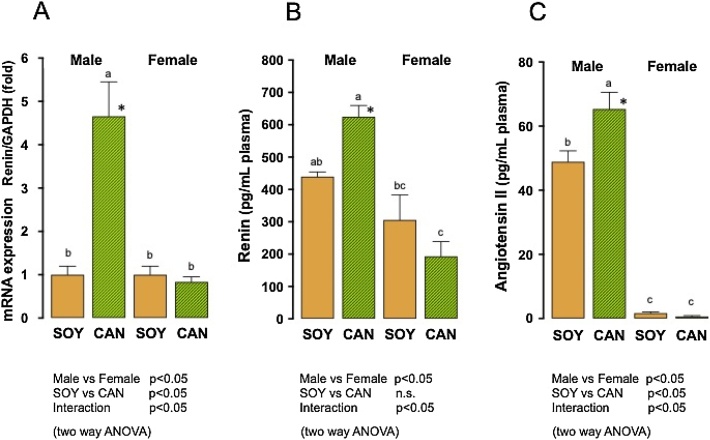
This study was conducted to investigate whether or not there are sex differences in canola oil (CAN)-induced adverse events in the rat and to understand the involvement and the role of testosterone in those events, including life-shortening. Stroke-prone spontaneously hypertensive rats (SHRSP) of both sexes were fed a diet containing 10 wt/wt% soybean oil (SOY, control) or CAN as the sole dietary fat. The survival of the males fed the CAN diet was significantly shorter than that of those fed the SOY diet. In contrast, the survival of the females was not affected by CAN. The males fed the CAN diet showed elevated blood pressure, thrombopenia and insulin-tolerance, which are major symptoms of metabolic syndrome, whereas such changes by the CAN diet were not found in the females. Plasma testosterone was significantly lower in animals of both sexes fed the CAN diet than in those fed the SOY diet, but interestingly, the lowered testosterone was accompanied by a marked increase in plasma aldosterone only in the males. These results demonstrate significant sex differences in CAN-toxicity and suggest that those sex differences may be attributable to the increased aldosterone level, which triggers aggravation of the genetic diseases specific to SHRSP, that is, metabolic syndrome-like conditions, but only in the males. The present results also suggest that testosterone may negatively regulate aldosterone production in the physiology of the males, and the inhibition of that negative regulation caused by the CAN diet is one of the possible causes of the adverse events.

Keywords: AUC, area under the curve; Aldosterone; BW, body weight; CAN, Canola oil; FC, food consumption; FCh, free cholesterol; FFA, free fatty acid; GAPDH, glyceraldehyde-3-phosphate dehydrogenase; Glu, glucose; Life-shortening; MR, mineralocorticoid receptor; OGTT, oral glucose tolerance test; RAAS, renin-angiotensin-aldosterone system; Rapeseed (canola) oil; SHR, spontaneously hypertensive rat; SHRSP; SHRSP, stroke-prone spontaneously hypertensive rat; SOY, soybean oil; Sex difference; TCh, total cholesterol; TG, triglyceride; Testosterone; WKY rat, Wistar Kyoto rat.


Conflict of interest statement

The authors report no declarations of interest.

Figures

None
Graphical abstract
Fig. 1
Fig. 1
Body weight gain in SHRSP during the survival experiment. Twelve animals of each sex were assigned to the group fed 10 % soybean oil diet (SOY, control) or 10 % canola oil diet (CAN). Symbols with bars represent means with SEMs. § and , Significantly different between sexes and between the 2 different diets, respectively (p<0.05, two way ANOVA). , Interaction exists between the factors, sexes and diets (p<0.05, two way ANOVA). Identical alphabetical letters indicate the absence of significant differences between the groups (p>0.05, Tukey’s test). *, Significantly different from the SOY group in each sex (p<0.05, unpaired t-test).
Fig. 2
Fig. 2
Food consumption in SHRSP during the survival experiment. Twelve animals of each sex were assigned to the group fed 10 % soybean oil diet (SOY, control) or 10 % canola oil diet (CAN). Symbols with bars represent means with SEMs. § and , Significantly different between sexes and between the 2 different diets, respectively (p<0.05, two way ANOVA). , Interaction exists between the factors, sexes and diets (p<0.05, two way ANOVA). Identical alphabetical letters indicate the absence of significant differences between the groups (p>0.05, Tukey’s test). *, Significantly different from the SOY group in each sex (p<0.05, unpaired t-test).
Fig. 3
Fig. 3
Survival curves of SHRSP fed 10 % soybean oil diet or 10 % canola oil diet. Twelve animals of each sex were assigned to the group given 10 % soybean oil diet (SOY, control) or 10 % canola oil diet (CAN). The survival curves in the males in the SOY group and in the CAN group were significantly different (Wilcoxon and log-rank tests). The curves in the females were evaluated significantly different between the 2 dietary groups by Wilcoxon test but not by log-lank test. The mean survival time was significantly different between sexes, female>male, and between the animals given the 2 different diets, SOY>CAN (two way ANOVA). Identical alphabetical letters indicate the absence of significant differences between the groups (p>0.05, Tukey’s test). *, Significantly different from the SOY group in the males (p<0.05, unpaired t-test). #, Significantly different from the male animals given CAN diet (p<0.05, unpaired t-test).
Fig. 4
Fig. 4
Platelet count in SHRSP fed 10 % soybean oil diet (SOY, control) or 10 % canola oil diet (CAN). At the 8th week of feeding during the survival experiment, platelet count was determined. Columns with bars represent means with SEMs of 12 animals. Platelet count was similar in both sexes but was significantly different between the animals given the 2 different diets (p<0.05, two way ANOVA). Platelet count in the males in the CAN group was significantly lower than any other group. Identical alphabetical letters indicate the absence of significant differences between the groups (p>0.05, Tukey’s test). *, Significantly different from the SOY group in the males (p<0.05, unpaired t-test).
Fig. 5
Fig. 5
Oral glucose tolerance test (OGTT) in SHRSP fed 10 % soybean oil diet (SOY, control) or 10 % canola oil diet (CAN) for 8 weeks. Symbols or columns with bars represent means with SEMs of 10 animals. A. Time course of plasma Glu, B. Time course of serum insulin; § and , Significantly different between sexes and between the 2 different diets, respectively (p<0.05, two way ANOVA). , Interaction exists between the factors, sexes and diets (p<0.05, two way ANOVA). Identical alphabetical letters indicate the absence of significant differences between the groups (p>0.05, Tukey’s test). *, Significantly different from the SOY group in each sex (p<0.05, unpaired t-test). C. AUCs for the curves of Glu levels; The AUCs were significantly different between sexes and between the 2 diets given (two way ANOVA). Identical alphabetical letters indicate the absence of significant differences between the groups (p>0.05, Tukey’s test). *, Significantly different from the SOY group in the males (unpaired t-test). D. AUCs for the curves of insulin levels. The AUCs were significantly different between sexes but not different between the 2 different diets (two way ANOVA).
Fig. 6
Fig. 6
Plasma testosterone, estradiol and aldosterone levels in SHRSP fed 10 % soybean oil diet (SOY, control) or 10 % canola oil diet (CAN) for 8 weeks. Columns with bars represent the means with SEMs of 6 animals. A. Plasma testosterone concentration was significantly different between sexes and between the 2 different diets (p<0.05, two way ANOVA). Identical alphabetical letters indicate the absence of significant differences between the groups (p>0.05, Tukey’s test). *, Significantly different from the SOY group in each sex (p<0.05, unpaired t-test). Testosterone level in the males in the CAN group was significantly lower than in the SOY group (unpaired t-test). In the females, testosterone level in the CAN group was also significantly lower than in the SOY group (unpaired t-test). B. In the females, the CAN diet-induced decrease in testosterone was associated with a significantly lower estradiol level in the CAN group than in the SOY group (unpaired t-test). C. Aldosterone level was not different between sexes but significantly different between the 2 different diets (two way ANOVA). In the males, the aldosterone level in the CAN group was significantly higher than in the SOY group (Tukey’s test and unpaired t-test). Aldosterone concentrations in the females did not show difference between the 2 different diets.
Fig. 7
Fig. 7
Expression of mRNA for renin in the kidney and plasma concentrations of renin and angiotensin II in SHRSP fed 10 % soybean oil diet (SOY, control) or 10 % canola oil diet (CAN) for 8 weeks. Columns with bars represent the means with SEMs of 6 animals. Identical alphabetical letters indicate the absence of significant differences between the groups (p>0.05, Tukey’s test). *, Significantly different from the SOY group in each sex (p<0.05, unpaired t-test). A. Expression of mRNA for renin/that for GAPDH was significantly different between sexes and between the 2 different diets (p<0.05, two way ANOVA). The gene expression for renin in the males in the CAN group was significantly greater than in any other group (Tukey’s test). In the males, the gene expression in the CAN group was greater than in the SOY group (unpaired t-test). B. Plasma renin concentration was significantly different between sexes but not between the 2 different diets (two way ANOVA). In the males, plasma renin level in the CAN group was significantly greater than in the SOY group (Tukey’s test and unpaired t-test). In the females, plasma renin level in the CAN group was significantly less than in the SOY group (Tukey’s test). C. Plasma angiotensin II concentration was significantly different between sexes and between the 2 different diets (two way ANOVA). In the males, plasma angiotensin II concentration in the CAN group was significantly greater than in the SOY group (Tukey’s test and unpaired t-test).

Similar articles

Cited by

References

    1. Huang M.Z., Naito Y., Watanabe S., Kobayashi T., Kanai H., Nagai H., Okuyama H. Effect of rapeseed and dietary oils on the mean survival time of stroke-prone spontaneously hypertensive rats. Biol. Pharm. Bull. 1996;19:554–557. doi: 10.1248/bpb.19.554. - DOI - PubMed
    1. Huang M.Z., Watanabe S., Kobayashi T., Nagatsu A., Sakakibara J., Okuyama H. Unusual effects of some vegetable oils on the survival time of stroke-prone spontaneously hypertensive rats. Lipids. 1997;32:745–751. doi: 10.1007/s11745-997-0095-z. - DOI - PubMed
    1. Miyazaki M., Huang M.Z., Takemura N., Watanabe S., Okuyama H. Free fatty acid fractions from some vegetable oils exhibit reduced survival time-shortening activity in stroke-prone spontaneously hypertensive rats. Lipids. 1998;33:655–661. doi: 10.1007/s11745-998-0253-3. - DOI - PubMed
    1. Ratnayake W.M., Plouffe L., Hollywood R., L’Abbé M.R., Hidiroglou N., Sarwar G., Mueller R. Influence of sources of dietary oils on the life span of stroke-prone spontaneously hypertensive rats. Lipids. 2000;35:409–420. doi: 10.1007/s11745-000-539-5. - DOI - PubMed
    1. Ratnayake W.M., L’Abbé M.R., Mueller R., Hayward R., Plouffe L., Hollywood R., Trick K. Vegetable oils high in phytosterols make erythrocytes less deformable and shorten the life span of stroke-prone spontaneously hypertensive rats. J. Nutr. 2000;130:1166–1178. doi: 10.1093/jn/130.5.1166. - DOI - PubMed