

Serum Metabonomics Reveals Risk Factors in Different Periods of Cerebral Infarction in Humans
- PMID: 35242810
- PMCID: PMC8887861
- DOI: 10.3389/fmolb.2021.784288
Serum Metabonomics Reveals Risk Factors in Different Periods of Cerebral Infarction in Humans
Abstract
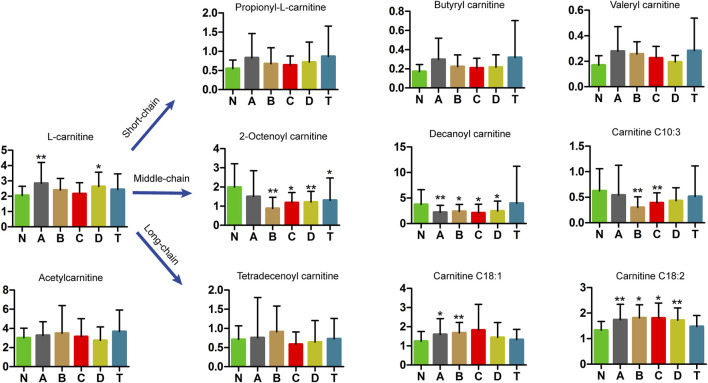
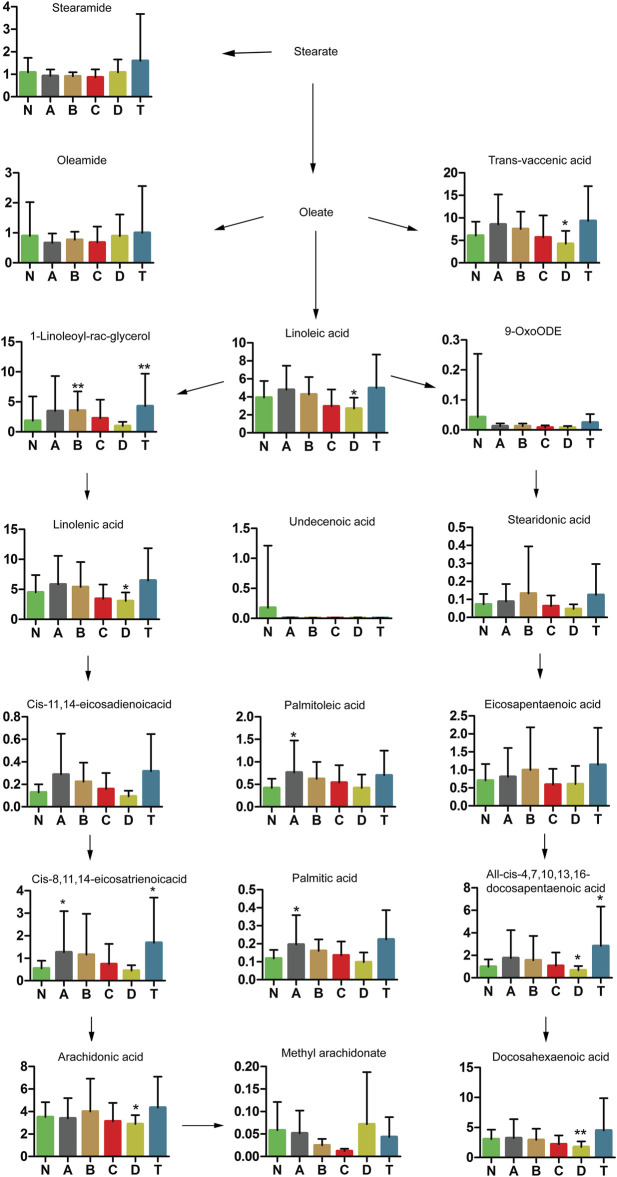
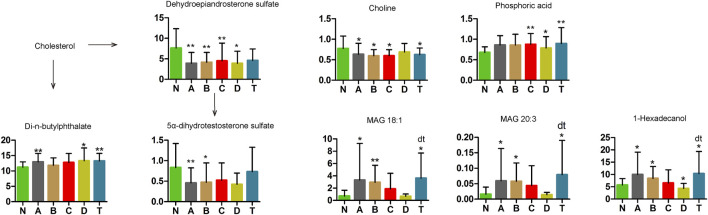
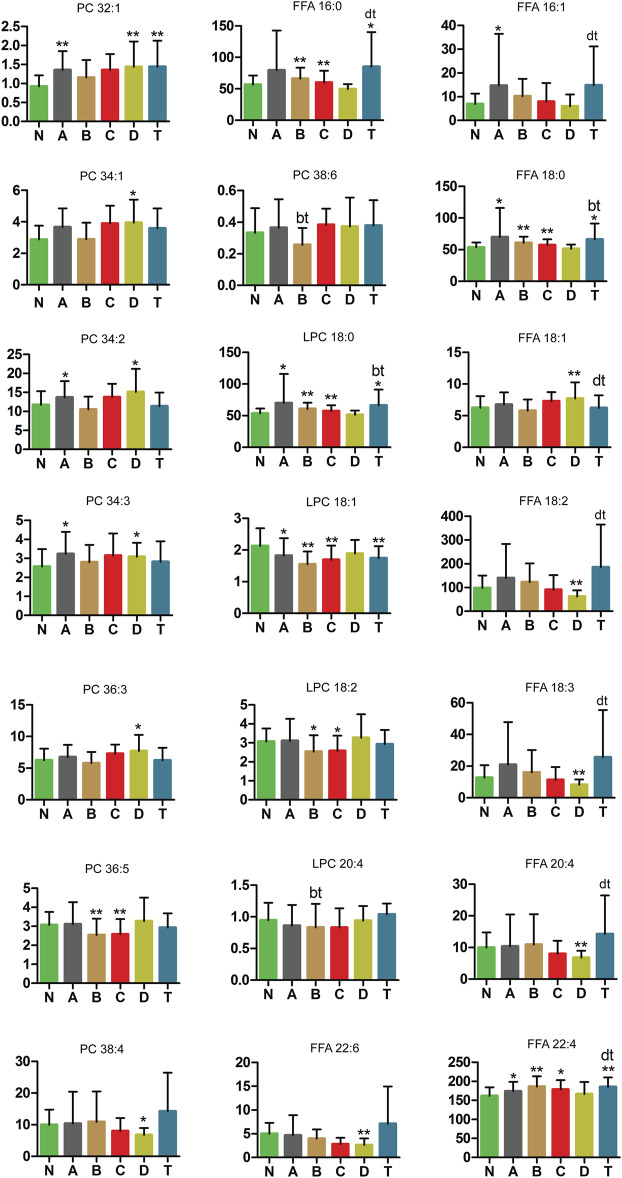
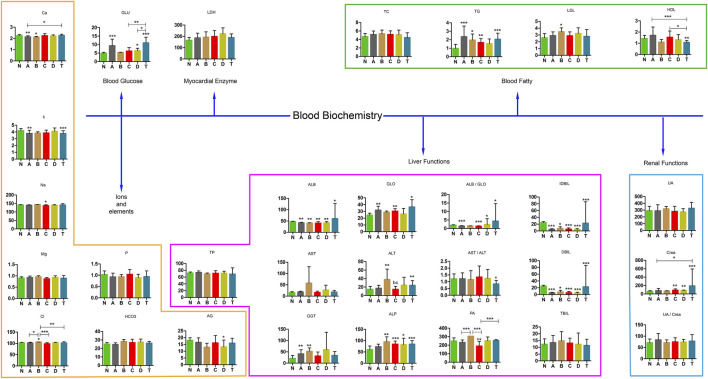
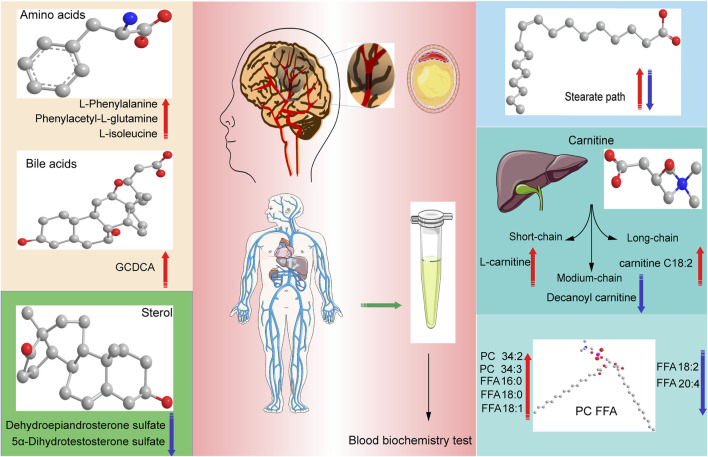
Studies of key metabolite variations and their biological mechanisms in cerebral infarction (CI) have increased our understanding of the pathophysiology of the disease. However, how metabolite variations in different periods of CI influence these biological processes and whether key metabolites from different periods may better predict disease progression are still unknown. We performed a systematic investigation using the metabonomics method. Various metabolites in different pathways were investigated by serum metabolic profiling of 143 patients diagnosed with CI and 59 healthy controls. Phe-Phe, carnitine C18:1, palmitic acid, cis-8,11,14-eicosatrienoic acid, palmitoleic acid, 1-linoleoyl-rac-glycerol, MAG 18:1, MAG 20:3, phosphoric acid, 5α-dihydrotestosterone, Ca, K, and GGT were the major components in the early period of CI. GCDCA, glycocholate, PC 36:5, LPC 18:2, and PA showed obvious changes in the intermediate time. In contrast, trans-vaccenic acid, linolenic acid, linoleic acid, all-cis-4,7,10,13,16-docosapentaenoic acid, arachidonic acid, DHA, FFA 18:1, FFA 18:2, FFA 18:3, FFA 20:4, FFA 22:6, PC 34:1, PC 36:3, PC 38:4, ALP, and Crea displayed changes in the later time. More importantly, we found that phenylalanine metabolism, medium-chain acylcarnitines, long-chain acylcarnitines, choline, DHEA, LPC 18:0, LPC 18:1, FFA 18:0, FFA 22:4, TG, ALB, IDBIL, and DBIL played vital roles in the development of different periods of CI. Increased phenylacetyl-L-glutamine was detected and may be a biomarker for CI. It was of great significance that we identified key metabolic pathways and risk metabolites in different periods of CI different from those previously reported. Specific data are detailed in the Conclusion section. In addition, we also explored metabolite differences of CI patients complicated with high blood glucose compared with healthy controls. Further work in this area may inform personalized treatment approaches in clinical practice for CI by experimentally elucidating the pathophysiological mechanisms.
Keywords: cerebral infarction; different periods; human serum; key metabolites and pathways; metabonomics.
Copyright © 2022 Chen, Guo, Zhao, Ren, Chen, Liu, Jiang, Liu, Liu, Hu, Wang, Peng, Xu and Tao.
Conflict of interest statement
The authors declare that the research was conducted in the absence of any commercial or financial relationships that could be construed as a potential conflict of interest.
Figures
Similar articles
-
Serum Metabonomics Reveals Key Metabolites in Different Types of Childhood Short Stature.Front Pharmacol. 2022 May 5;13:818952. doi: 10.3389/fphar.2022.818952. eCollection 2022. Front Pharmacol. 2022. PMID: 35600884 Free PMC article.
-
[Differential metabolites and metabolic pathways involving acupuncture-induced improvement of rheumatoid arthritis patients based on gas chromatography-mass spectrometry].Zhen Ci Yan Jiu. 2021 Feb 25;46(2):145-51. doi: 10.13702/j.1000-0607.200181. Zhen Ci Yan Jiu. 2021. PMID: 33788436 Chinese.
-
Comprehensive metabolic profiling of Parkinson's disease by liquid chromatography-mass spectrometry.Mol Neurodegener. 2021 Jan 23;16(1):4. doi: 10.1186/s13024-021-00425-8. Mol Neurodegener. 2021. PMID: 33485385 Free PMC article.
-
Targeted assessment of the metabolome in skeletal muscle and in serum of dairy cows supplemented with conjugated linoleic acid during early lactation.J Dairy Sci. 2021 Apr;104(4):5095-5109. doi: 10.3168/jds.2020-19185. Epub 2021 Mar 2. J Dairy Sci. 2021. PMID: 33663821
-
[Study on Serum Metabolite Profiling in Pi-deficiency Rats Based on LC-MS Technique].Zhongguo Zhong Xi Yi Jie He Za Zhi. 2016 Mar;36(3):359-65. Zhongguo Zhong Xi Yi Jie He Za Zhi. 2016. PMID: 27236897 Chinese.
Cited by
-
Serum-derived extracellular vesicles promote the growth and metastasis of non-small cell lung cancer by delivering the m6A methylation regulator HNRNPC through the regulation of DLGAP5.J Cancer Res Clin Oncol. 2023 Jul;149(8):4639-4651. doi: 10.1007/s00432-022-04375-6. Epub 2022 Sep 29. J Cancer Res Clin Oncol. 2023. PMID: 36175801 Free PMC article.
-
Discovery of metabolic biomarkers for distinguishing LAA and SVO subtypes of acute ischemic stroke.Sci Rep. 2025 Jul 2;15(1):23574. doi: 10.1038/s41598-025-09375-3. Sci Rep. 2025. PMID: 40604085 Free PMC article.
-
Glycosylated SARs Cov 2 interaction with plant lectins.Glycoconj J. 2024 Jun;41(3):185-199. doi: 10.1007/s10719-024-10154-x. Epub 2024 May 15. Glycoconj J. 2024. PMID: 38748325 Review.
-
Deep learning reconstruction for improving the visualization of acute brain infarct on computed tomography.Neuroradiology. 2024 Jan;66(1):63-71. doi: 10.1007/s00234-023-03251-5. Epub 2023 Nov 22. Neuroradiology. 2024. PMID: 37991522 Free PMC article.
-
GIMAP8 could serve as a potential prognostic factor for lung adenocarcinoma and is closely related to immunity.Sci Rep. 2025 May 2;15(1):15465. doi: 10.1038/s41598-025-99894-w. Sci Rep. 2025. PMID: 40316818 Free PMC article.
References
LinkOut - more resources
Full Text Sources
Research Materials
Miscellaneous