

Characterizing the behavioral and neuroendocrine features of susceptibility and resilience to social stress
- PMID: 35242893
- PMCID: PMC8857076
- DOI: 10.1016/j.ynstr.2022.100437
Characterizing the behavioral and neuroendocrine features of susceptibility and resilience to social stress
Abstract
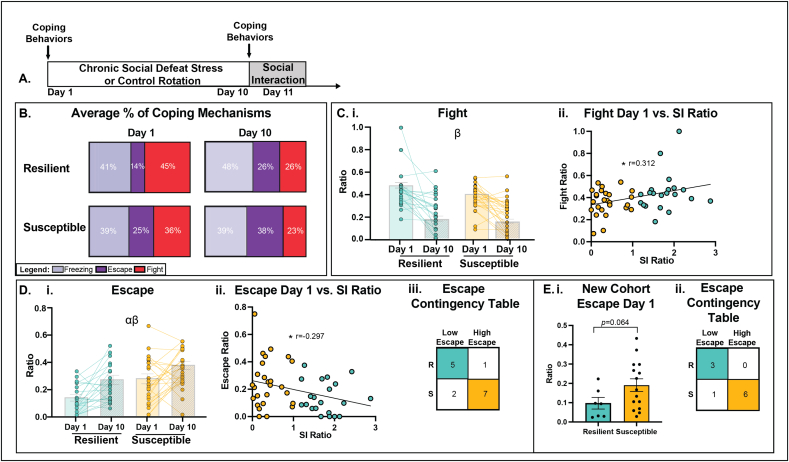
Evaluating and coping with stressful social events as they unfold is a critical strategy in overcoming them without long-lasting detrimental effects. Individuals display a wide range of responses to stress, which can manifest in a variety of outcomes for the brain as well as subsequent behavior. Chronic Social Defeat Stress (CSDS) in mice has been widely used to model individual variation following a social stressor. Following a course of repeated intermittent psychological and physical stress, mice diverge into separate populations of social reactivity: resilient (socially interactive) and susceptible (socially avoidant) animals. A rich body of work reveals distinct neurobiological and behavioral consequences of this experience that map onto the resilient and susceptible groups. However, the range of factors that emerge over the course of defeat have not been fully described. Therefore, in the current study, we focused on characterizing behavioral, physiological, and neuroendocrine profiles of mice in three separate phases: before, during, and following CSDS. We found that following CSDS, traditional read-outs of anxiety-like and depression-like behaviors do not map on to the resilient and susceptible groups. By contrast, behavioral coping strategies used during the initial social stress encounter better predict which mice will eventually become resilient or susceptible. In particular, mice that will emerge as susceptible display greater escape behavior on Day 1 of social defeat than those that will emerge as resilient, indicating early differences in coping mechanisms used between the two groups. We further show that the social avoidance phenotype in susceptible mice is specific to the aggressor strain and does not generalize to conspecifics or other strains, indicating that there may be features of threat discrimination that are specific to the susceptible mice. Our findings suggest that there are costs and benefits to both the resilient and susceptible outcomes, reflected in their ability to cope and adapt to the social stressor.
Keywords: Avoidance; Chronic social defeat stress; Coping behaviors; Predictive traits; Social; Threat discrimination.
Conflict of interest statement
Authors declare no conflict of interest.
Figures


Similar articles
-
Paradoxical enhancement of fear expression and extinction deficits in mice resilient to social defeat.Behav Brain Res. 2013 Nov 1;256:580-90. doi: 10.1016/j.bbr.2013.09.009. Epub 2013 Sep 9. Behav Brain Res. 2013. PMID: 24029700
-
Synergistic consequences of early-life social isolation and chronic stress impact coping and neural mechanisms underlying male prairie vole susceptibility and resilience.Front Behav Neurosci. 2022 Jul 25;16:931549. doi: 10.3389/fnbeh.2022.931549. eCollection 2022. Front Behav Neurosci. 2022. PMID: 35957922 Free PMC article.
-
Establishment of the Mouse Model of Social Avoidance Induced by Female-Directed Female Aggression.Chronic Stress (Thousand Oaks). 2022 Sep 28;6:24705470221129288. doi: 10.1177/24705470221129288. eCollection 2022 Jan-Dec. Chronic Stress (Thousand Oaks). 2022. PMID: 36187211 Free PMC article.
-
Stress and personality.Psychiatriki. 2011 Oct-Dec;22(4):290-7. Psychiatriki. 2011. PMID: 22271841 Review.
-
Behavioral coping with chronic defeat stress in mice: A systematic review of current protocols.Neurobiol Stress. 2024 Nov 8;33:100689. doi: 10.1016/j.ynstr.2024.100689. eCollection 2024 Nov. Neurobiol Stress. 2024. PMID: 39628708 Free PMC article. Review.
Cited by
-
Corticosterone effects induced by stress and immunity and inflammation: mechanisms of communication.Front Endocrinol (Lausanne). 2025 Mar 20;16:1448750. doi: 10.3389/fendo.2025.1448750. eCollection 2025. Front Endocrinol (Lausanne). 2025. PMID: 40182637 Free PMC article. Review.
-
Stress, associative learning, and decision-making.Neurobiol Learn Mem. 2023 Oct;204:107812. doi: 10.1016/j.nlm.2023.107812. Epub 2023 Aug 19. Neurobiol Learn Mem. 2023. PMID: 37598745 Free PMC article. Review.
-
Untangling the multifaceted VTA responses to stress.Trends Neurosci. 2025 Aug;48(8):582-593. doi: 10.1016/j.tins.2025.06.004. Epub 2025 Jul 16. Trends Neurosci. 2025. PMID: 40675841 Review.
-
Behavioural and dopaminergic signatures of resilience.Nature. 2022 Nov;611(7934):124-132. doi: 10.1038/s41586-022-05328-2. Epub 2022 Oct 19. Nature. 2022. PMID: 36261520 Free PMC article.
-
Comparative Evaluation of Antidepressant and Anxiolytic Effects of Escitalopram, Crocin, and their Combination in Rats.Adv Biomed Res. 2024 Oct 28;13:99. doi: 10.4103/abr.abr_259_23. eCollection 2024. Adv Biomed Res. 2024. PMID: 39717248 Free PMC article.
References
LinkOut - more resources
Full Text Sources
