. 2022 Feb 5;25(3):103866.
doi: 10.1016/j.isci.2022.103866. eCollection 2022 Mar 18.

Circuit topology analysis of cellular genome reveals signature motifs, conformational heterogeneity, and scaling

Affiliations

Circuit topology analysis of cellular genome reveals signature motifs, conformational heterogeneity, and scaling

Barbara Scalvini et al. iScience. .

Abstract

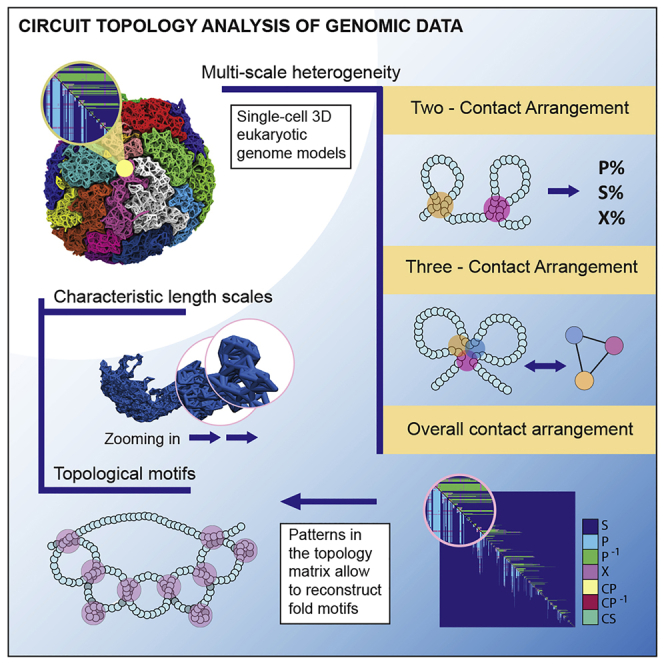
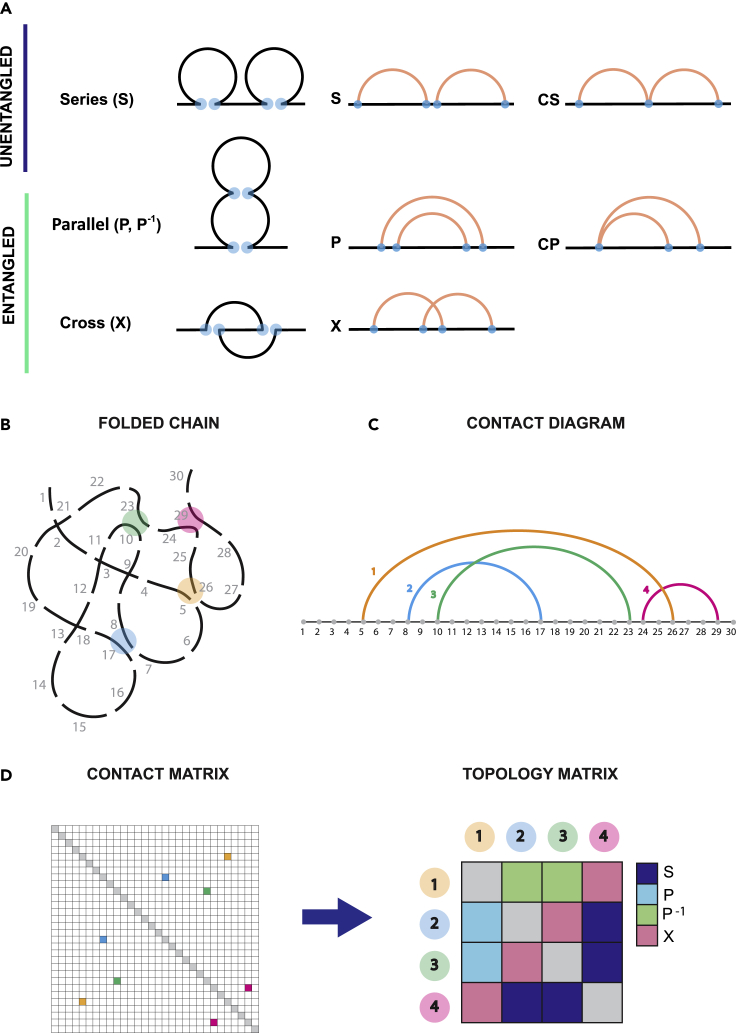
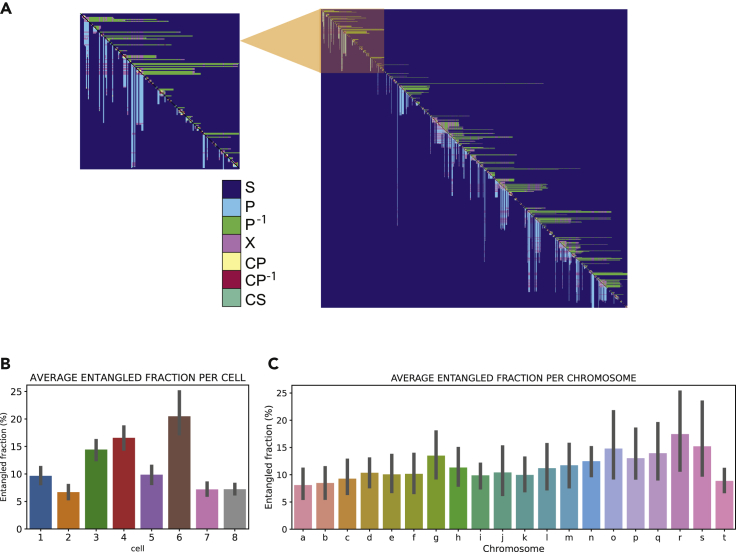
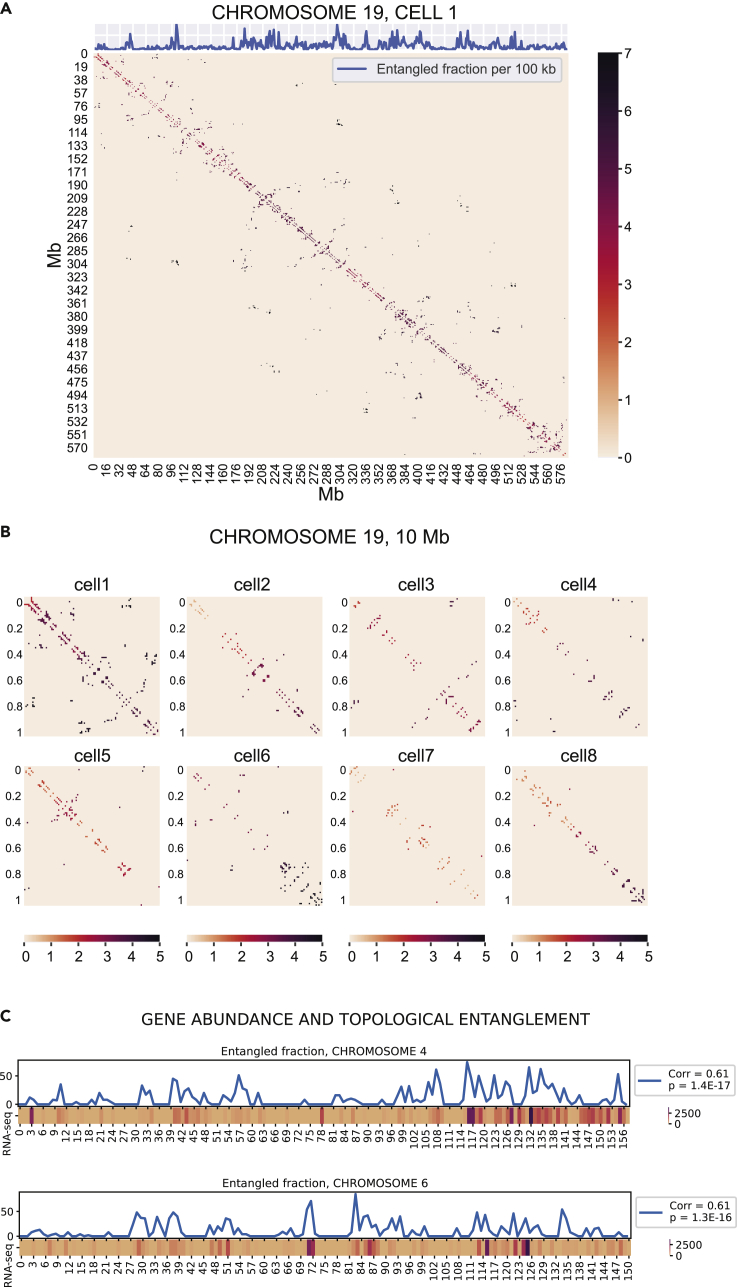
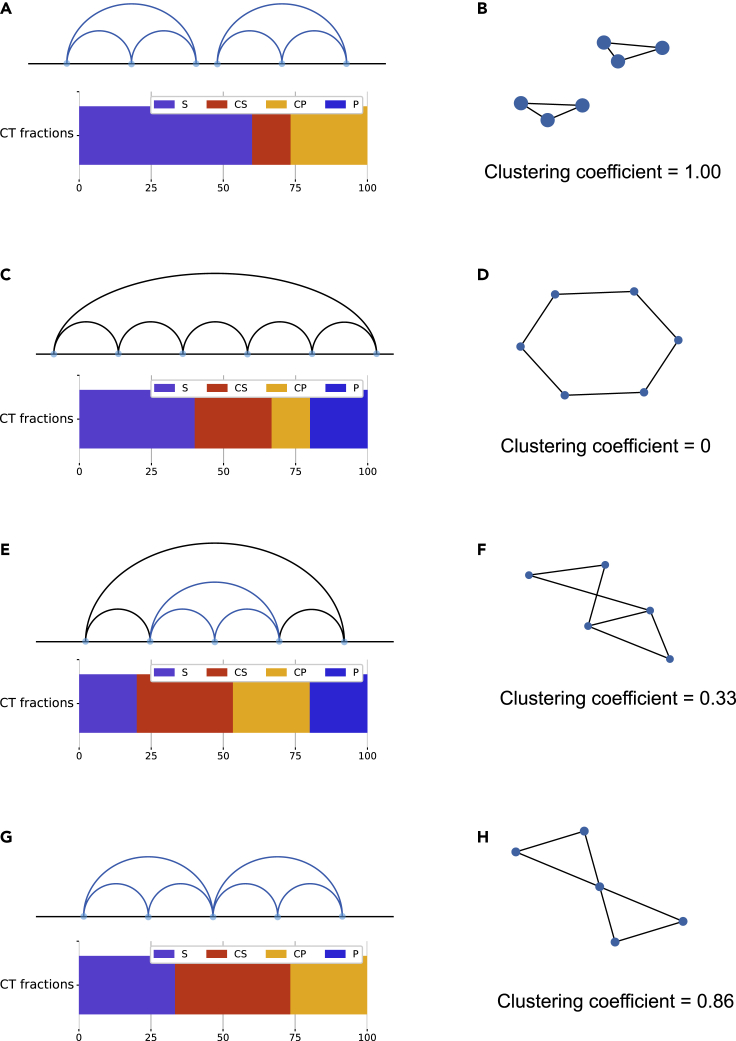
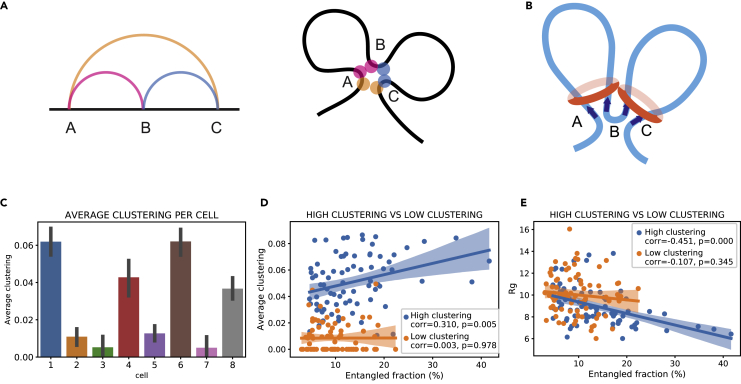
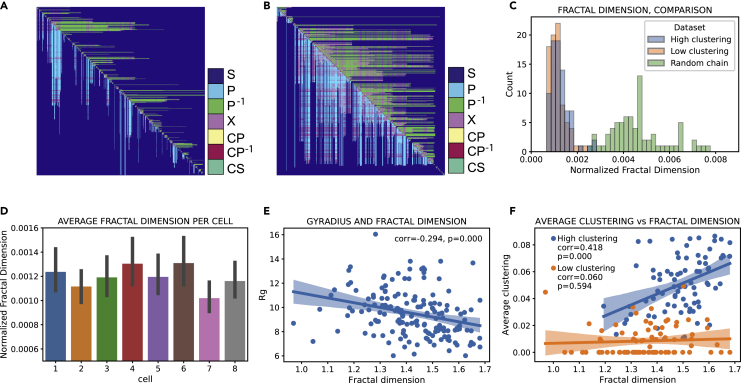
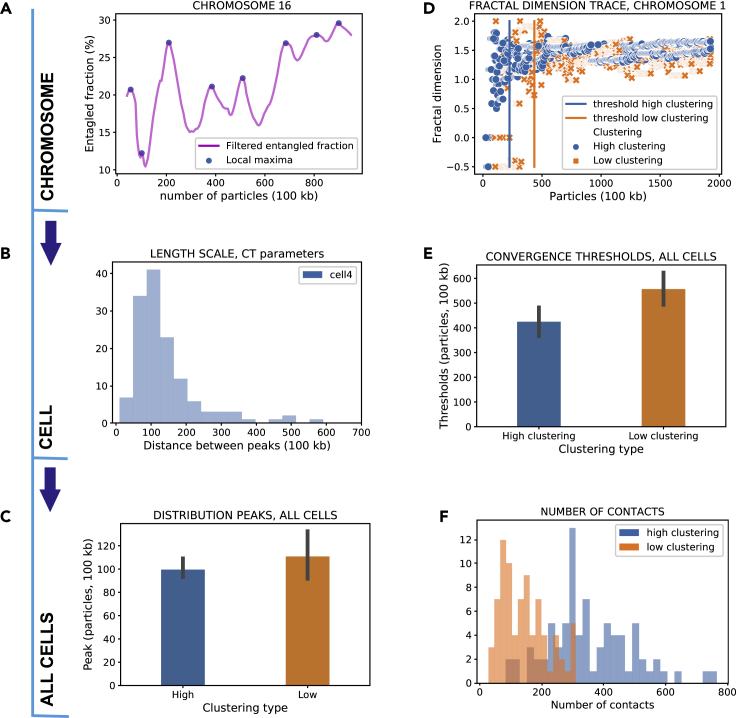
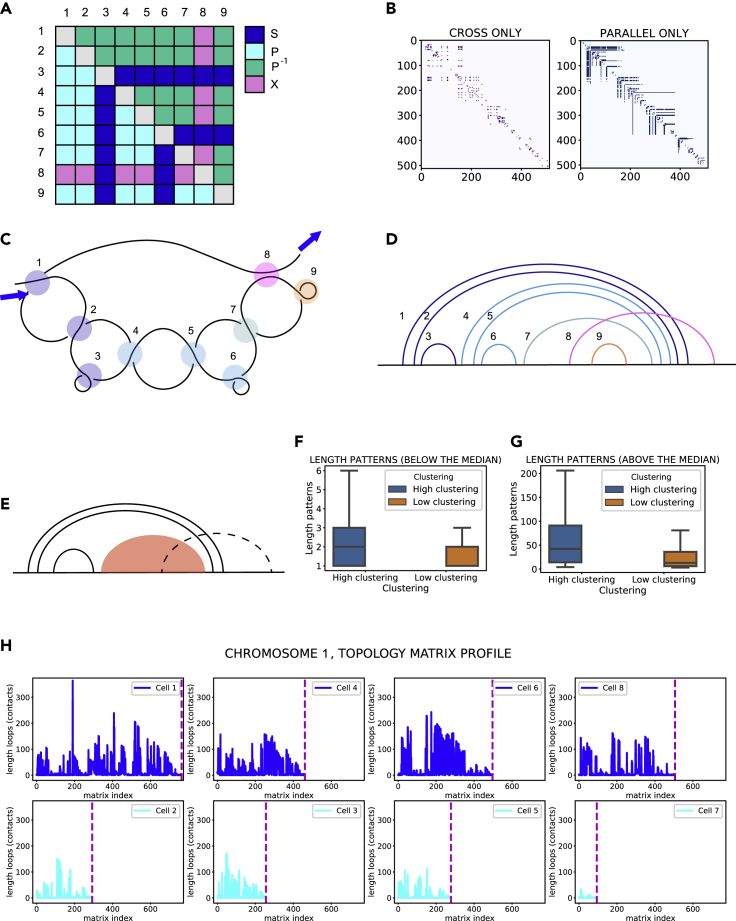
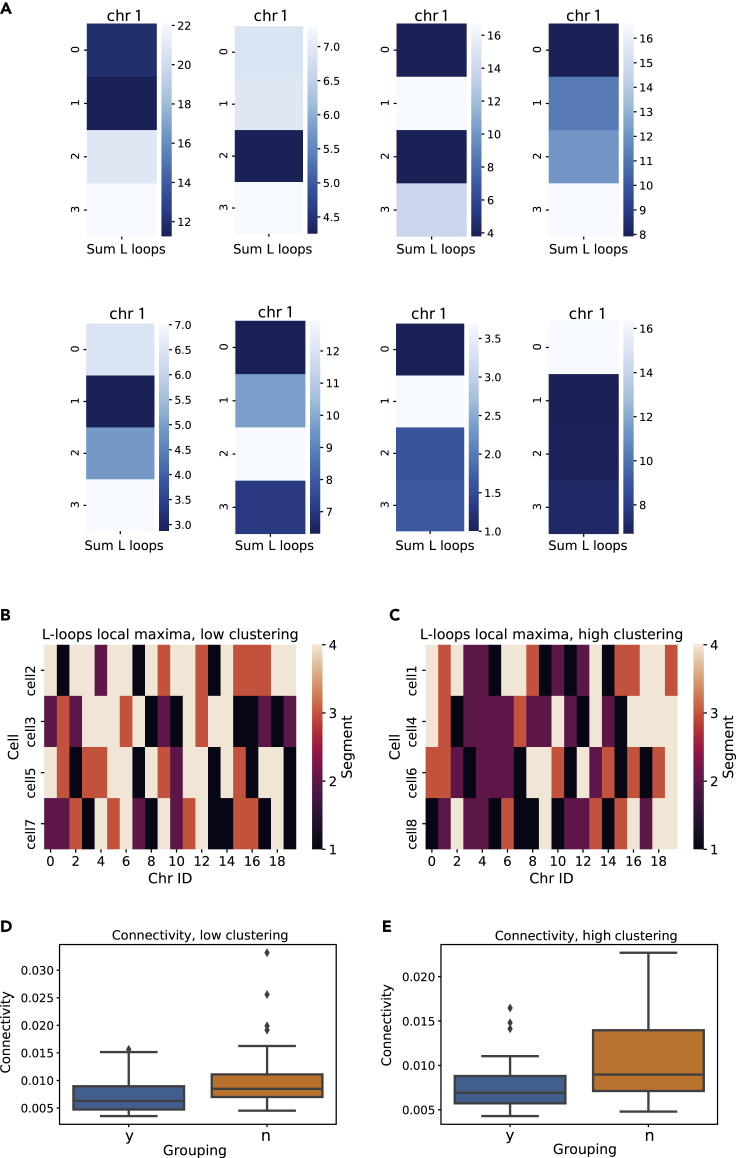
Reciprocal regulation of genome topology and function is a fundamental and enduring puzzle in biology. The wealth of data provided by Hi-C libraries offers the opportunity to unravel this relationship. However, there is a need for a comprehensive theoretical framework in order to extract topological information for genome characterization and comparison. Here, we develop a toolbox for topological analysis based on Circuit Topology, allowing for the quantification of inter- and intracellular genomic heterogeneity, at various levels of fold complexity: pairwise contact arrangement, higher-order contact arrangement, and topological fractal dimension. Single-cell Hi-C data were analyzed and characterized based on topological content, revealing not only a strong multiscale heterogeneity but also highly conserved features such as a characteristic topological length scale and topological signature motifs in the genome. We propose that these motifs inform on the topological state of the nucleus and indicate the presence of active loop extrusion.

Keywords: Genomics; In silico biology; Mathematical biosciences.


Conflict of interest statement

The authors declare no competing interests.

Figures

None
Graphical abstract
Figure 1
Figure 1
Circuit topology classifies chains based on the pairwise arrangement of intra-chain contacts (A) Circuit topology relations: contacts can be in either one of three topological relations: series, parallel, and cross. Parallel and cross are grouped together as entangled relations. (B) Schematic representation of a folded 3D chain. The chain is divided into segments, which in our case can be interpreted as the 100 kb chromosome portions which make up our 3D structures. Contacts can be identified for those segments in the chain that lie closer to each other than the chosen cutoff. Often adjacent segments participate in the same contact (as might be for example the case for segments 26 and 27, which are both close to segment 5). In this case the arrangement gives rise to what we call concerted topological relations (CS, CP). In this scheme, we ignore concerted relations for simplicity. (C) We can represent contacts in the chain as a linear diagram. This representation is useful to visualize the topological relations between contacts. For example, it becomes apparent that contact 1 and contact 4 are in cross relation with each other, as the two respective arcs cross paths. (D) The size of the topology matrix is N x N (where N is the number of contacts). If we compare contact map and topology matrix, we see that each contact in the contact map is represented on both rows and columns of the topology matrix. Elements on the diagonal represent the topological interaction of the contact with itself; although this is defined theoretically as parallel, such relations are excluded from the analysis for lack of physical meaning. Each element of the matrix represents the topological relation of a pair of contacts in the chain. There is a significant reduction in dimensionality, going from a contact map to its topology matrix, which makes the topology matrix easier to handle computationally. In the topology matrix, we lose the spatial information, because we do not know how far the contacts are from each other in the 3D space. However, we gain information about reciprocal contact arrangement.
Figure 2
Figure 2
The percentage of entanglement varies from cell to cell (A) Topology matrix of chromosome 1, cell 1 (Stevens et al., 2017). Entangled relations cluster together along the diagonal, indicating a domain-like structure, where domains are in series with each other. (B) Bar plot of the entangled fraction per cell, averaged over all chromosomes. Error bars show a 95% CI for the mean. (C) Bar plot of the entangled fraction per chromosome, averaged over all cells. Error bars show a 95% CI for the mean.
Figure 3
Figure 3
Topological parameters can be projected onto the chromosome sequence and correlated with structural and biological information (A) Contact map of chromosome 19, cell 1, obtained with a spatial cutoff equal to 1.5 particle radii (100 kb). The color scheme represents the number of entangled relationships that each contact entertains with other contacts, as retrieved by the topology matrix. At the same time, we can sum each row of the contact map in (A), to obtain a 1D trace corresponding to the number of entangled relations that each contact site (represented here by a 100 kb chromosomal sequence) experiences. This 1D trace can easily be coupled with other structural and biological information. (B) Zoom over the first 10 Mb of the contact map of chromosome 19, for all cells. The color scheme represents the number of entangled relationships that each contact entertains with other contacts, as retrieved by the topology matrix. (C) Plot of the entanglement fraction trace calculated over population Hi-C maps, coupled with a heatmap of gene abundance data as retrieved by nuclear RNA-seq, for chromosome 4 and 6. The data were coarse-grained in 1 Mb bins. Gene abundance lower than 50 for Mb was set to zero, and a threshold of 250 counts was set over population Hi-C contacts, in order to increase the signal to noise ratio. The label shows the correlation between entangled fraction and gene abundance
Figure 4
Figure 4
Nonzero clustering coefficient values stem from concerted relations among contacts (A) CT diagram and bar plot with concerted relations, corresponding to clustering coefficient = 1. (B) Network representation of the diagram in (A). (C) CT diagram and bar plot with concerted relations, corresponding to clustering coefficient = 0. (D) Network representation of the diagram in (C). (E) CT diagram and bar plot with concerted relations, corresponding to clustering coefficient = 0.33. (F) Network representation of the diagram in (E). (G) CT diagram and bar plot with concerted relations, corresponding to clustering coefficient = 0.86. (H) Network representation of the diagram in (G).
Figure 5
Figure 5
Cells can be divided into topological subgroups depending on their average clustering (A and B) Schematic representation of the type of fold giving rise to the trefoil diagram. (B) Two extrusion complexes bound to DNA during loop extrusion. The complexes stop extruding DNA when they meet on both ends CTCF motifs with convergent orientation. In this case two loops (A-B, B-C) are formed. However, because of the spatial proximity of the loci, this configuration would result in a trefoil configuration in our analysis. (C) Bar plot of the average clustering per cell, averaged over all chromosomes. Error bars show a 95% CI for the mean. (D) Scatterplot of average clustering versus entangled fraction. The high clustering subgroup shows statistically significant positive correlation between the two variables. Dots represent chromosomes from all cells. (E) Scatterplot of gyration radius (per chromosome) versus entangled fraction. The high clustering subgroup displays statistically significant negative correlation between the two variables. Dots represent chromosomes from all cells (Stevens et al., 2017).
Figure 6
Figure 6
Fractal dimension quantifies the overall contact arrangement in the chromosome (A) Topology matrix of chromosome 5, cell 1 (649 contacts) (Stevens et al., 2017). (B) Topology matrix of a random chain containing 617 contacts. (C) Distribution of chromosome fractal dimension, normalized by number of contacts, for high and low clustering subgroups, and for 80 randomly generated chains. (D) Bar plot of fractal dimension per cell, normalized by number of contacts and averaged over all chromosomes. Error bars show a 95% CI for the mean. (E) Scatterplot of gyration radius versus fractal dimension. Dots represent chromosomes from all cells. The two variables display statistically significant negative correlation. (F) Scatterplot of average clustering versus fractal dimension. Dots represent chromosomes from all cells. The high clustering subgroup shows statistically significant positive correlation between the two variables
Figure 7
Figure 7
Cumulative CT parameter analysis highlights periodic features and scale invariance (A) Entangled fraction trace of chromosome 16, cell 4 (Stevens et al., 2017). (B) Distribution of distance between local maxima in the chromosome entangled traces, for cell 4. (C) Bar plot of peaks of the distributions of distance between local maxima in entangled traces for all cells. Error bars show a 95% CI for the mean. (D) Trace analysis for fractal dimension, for chromosome 1, all cells. The vertical bars indicate the convergence threshold for the traces. (E) Bar plot of the convergence thresholds of the fractal dimension trace for chromosome 1 in all cells. Error bars show a 95% CI for the mean. (F) Distribution of the number of contacts in each chromosome, all cells. High clustering cells display a significantly higher number of contacts.
Figure 8
Figure 8
L-loops are topological models for chromatin looping (A) Model matrix of L-patterns. (B) Topology matrix of chromosome X, cell 1 (Stevens et al., 2017), split into its parallel and cross components. (C) Graphical representation of the L-loop corresponding to the matrix in (A). (D) Circuit diagram corresponding to the L-loop in (C). (E) Model circuit diagram of an L-loop. (F and G) Quantile analysis of the length of L-patterns in the matrix. Bar plots of L-pattern lengths for above and below the median of the dataset. Whiskers in the boxplot are extended to 1.5 IQR. (H) Matrix profile of chromosome 1 in all cells. First row: high clustering subgroup. Second row: low clustering subgroup. Dashed lines indicate the end of the topology matrix for each chromosome.
Figure 9
Figure 9
Local distribution of L-loops reveals inter-cellular chromosomal heterogeneity (A) Heatmaps of the sum of contacts enveloped by L-loops, for chromosomes divided into four segments. The figure shows the heatmap for Chromosome 1 in all eight cells (Stevens et al., 2017). (B) Heatmap of the local maxima position of L-loop contacts for each chromosome in low clustering cells. (C) Heatmap of the local maxima position of L-loop contacts for each chromosome in low clustering cells. (D) Boxplot of connectivity for the two groups of chromosomes, based on L-loop contact maxima in Segment 2, for low clustering cells. Whiskers in the boxplot are extended to 1.5 IQR. (E) Boxplot of connectivity for the two groups of chromosomes, based on L-loop contact maxima in Segment 2, for high clustering cells. Whiskers in the boxplot are extended to 1.5 IQR.

Similar articles

Cited by

References

    1. Alipour E., Marko J.F. Self-organization of domain structures by DNA-loop-extruding enzymes. Nucleic Acids Res. 2012;40:11202–11212. doi: 10.1093/nar/gks925. - DOI - PMC - PubMed
    1. Ashoor H., Chen X., Rosikiewicz W., Wang J., Cheng A., Wang P., Ruan Y., Li S. Graph embedding and unsupervised learning predict genomic sub-compartments from HiC chromatin interaction data. Nat. Commun. 2020;11:1173. doi: 10.1038/s41467-020-14974-x. - DOI - PMC - PubMed
    1. Brandão H.B., Paul P., van den Berg A.A., Rudner D.Z., Wang X., Mirny L.A. RNA polymerases as moving barriers to condensin loop extrusion. Proc. Natl. Acad. Sci. U S A. 2019;116:20489–20499. doi: 10.1073/pnas.1907009116. - DOI - PMC - PubMed
    1. Carrière M., Rabadán R. In: Topological Data Analysis. Abel Symposia. Baas N., Carlsson G., Quick G., Szymik M., editors. Springer; 2020. Topological data analysis of single-cell hi-C contact maps; pp. 147–162. - DOI
    1. Cavalli G., Misteli T. Functional implications of genome topology. Nat. Struct. Mol. Biol. 2013;20:290–299. doi: 10.1038/nsmb.2474. - DOI - PMC - PubMed

LinkOut - more resources