. 2022 Feb 11;25(3):103908.
doi: 10.1016/j.isci.2022.103908. eCollection 2022 Mar 18.

Akkermansia muciniphila induces mitochondrial calcium overload and α -synuclein aggregation in an enteroendocrine cell line

Affiliations

Akkermansia muciniphila induces mitochondrial calcium overload and α -synuclein aggregation in an enteroendocrine cell line

Dionísio Pedro Amorim Neto et al. iScience. .

Abstract

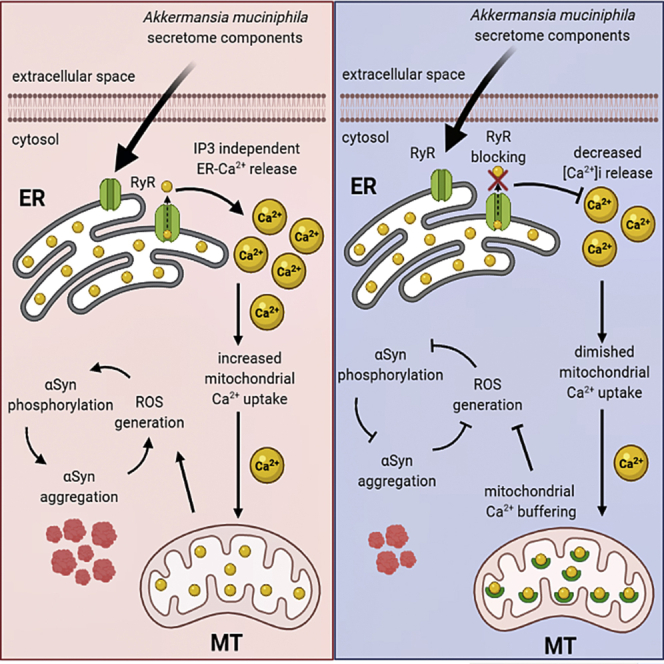
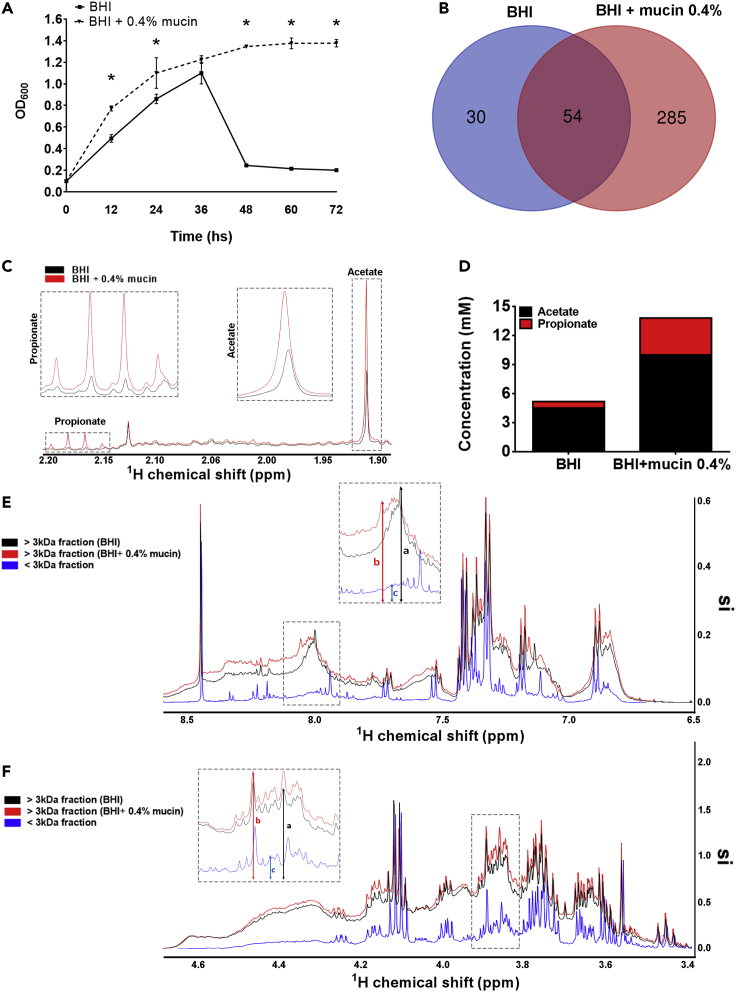
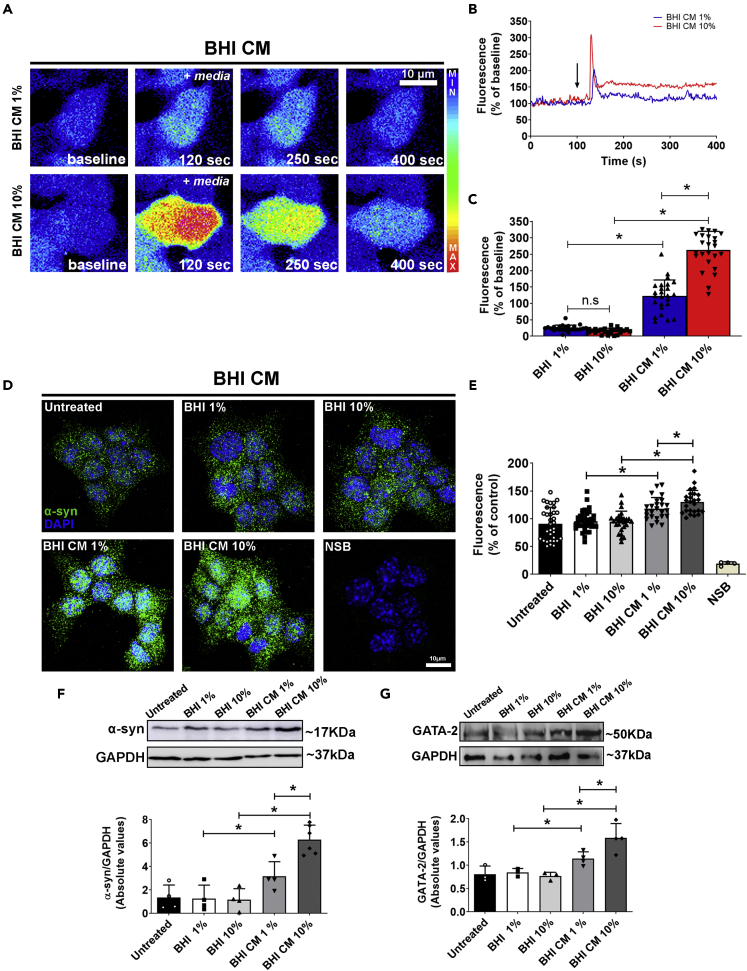
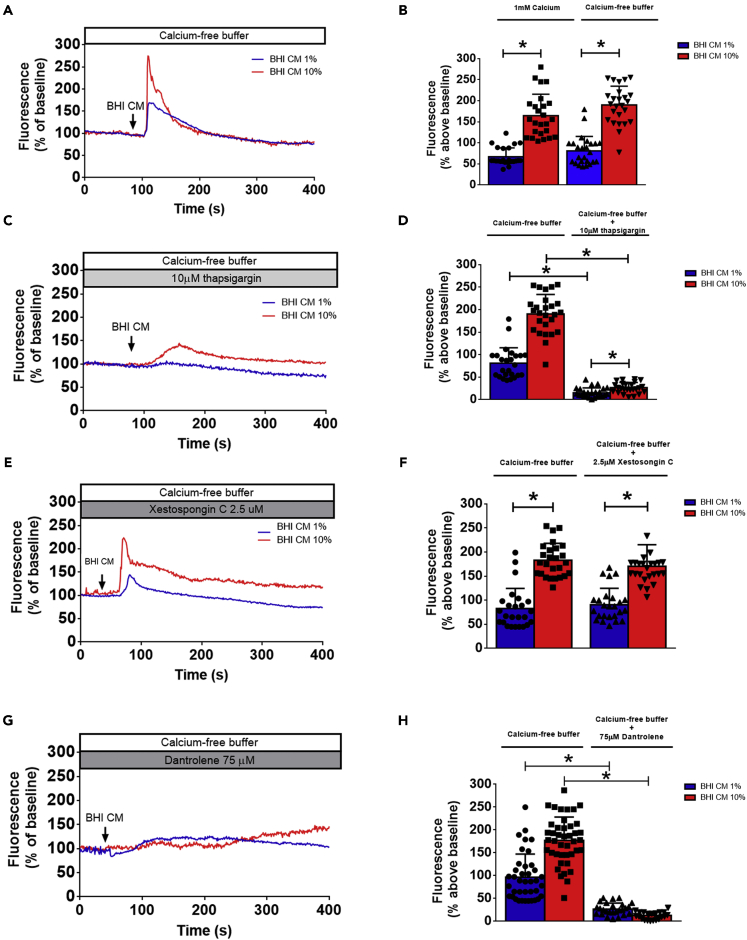
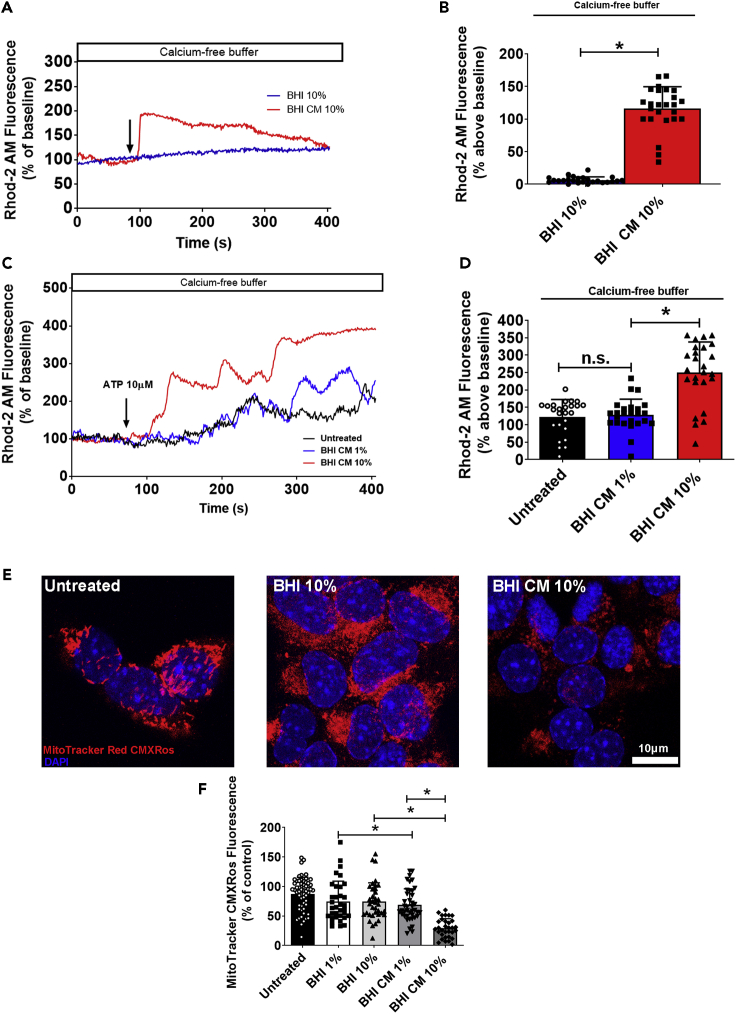
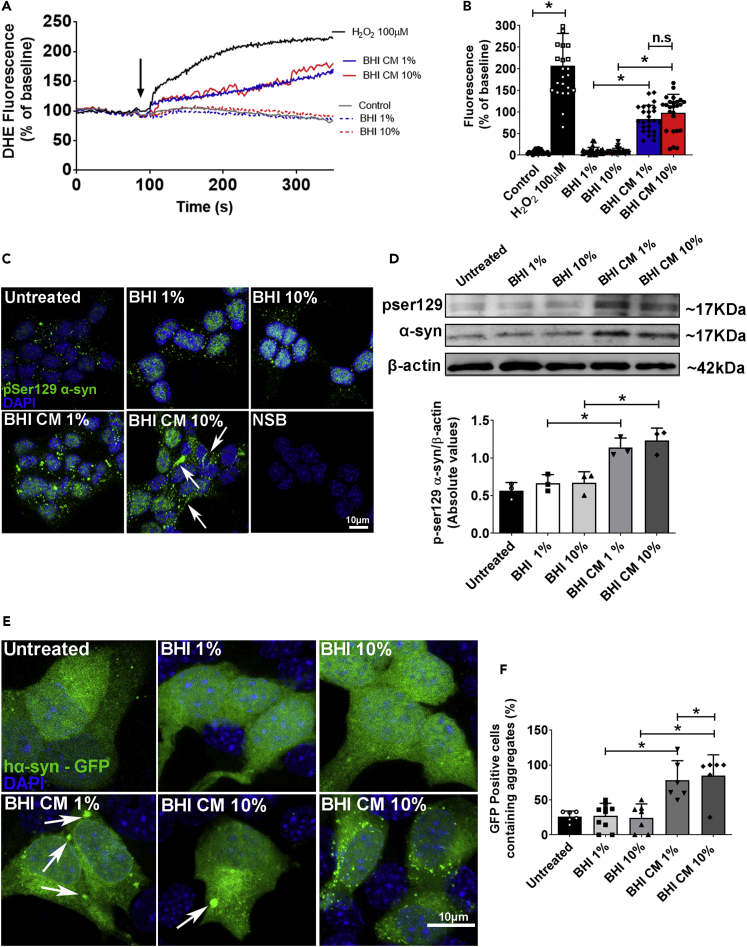
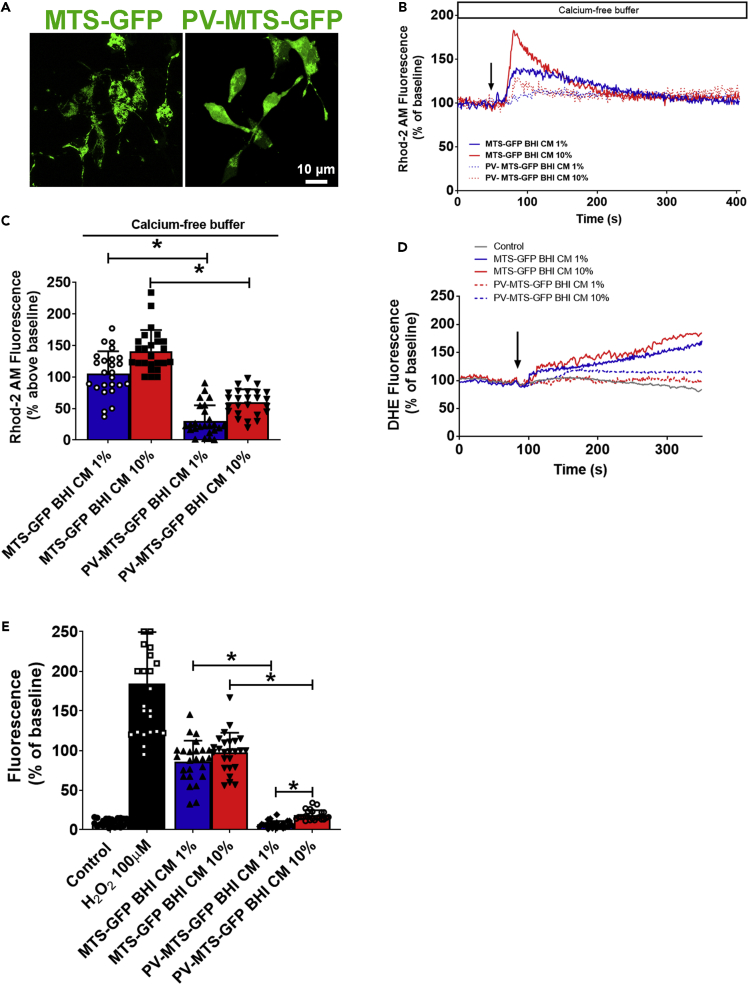
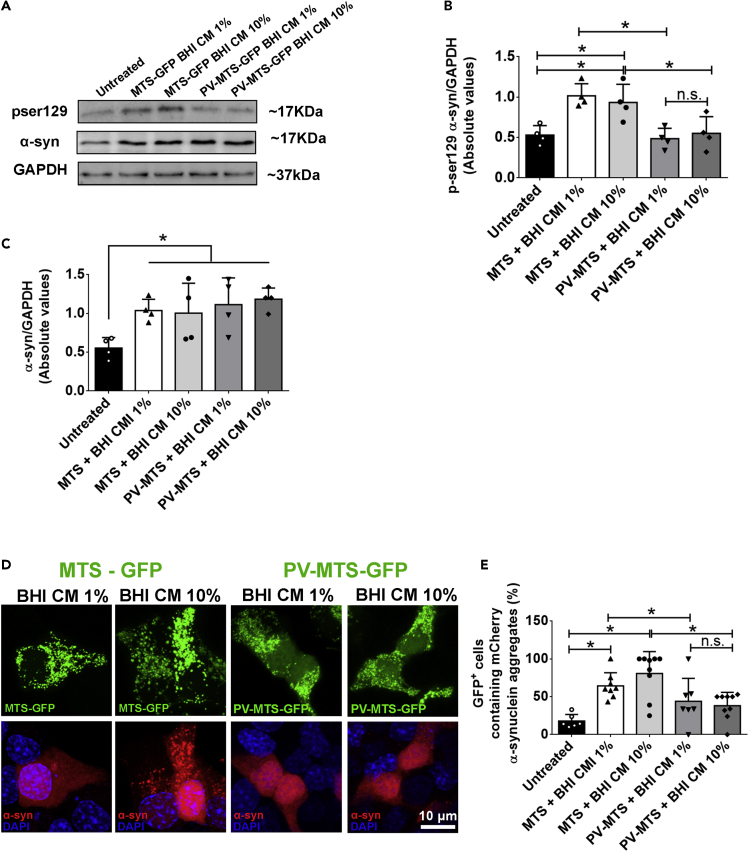
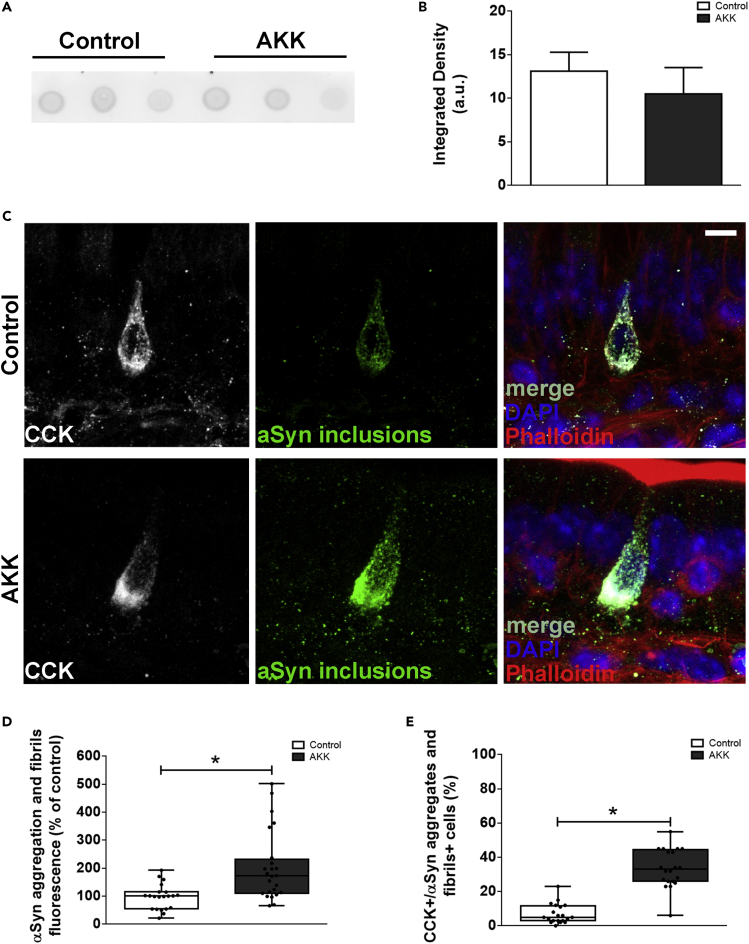
The gut microbiota influence neurodevelopment, modulate behavior, and contribute to neurodegenerative disorders. Several studies have consistently reported a greater abundance of Akkermansia muciniphila in Parkinson disease (PD) fecal samples. Therefore, we investigated whether A.muciniphila-conditioned medium (CM) could initiate α-synuclein (αSyn) misfolding in enteroendocrine cells (EEC) - a component of the gut epithelium featuring neuron-like properties. We found that A. muciniphila CM composition is influenced by the ability of the strain to degrade mucin. Our in vitro experiments showed that the protein-enriched fraction of mucin-free CM induces RyR-mediated Ca2+ release and increased mitochondrial Ca2+ uptake leading to ROS generation and αSyn aggregation. Oral administration of A. muciniphila cultivated in the absence of mucin to mice led to αSyn aggregation in cholecystokinin (CCK)-positive EECs but no motor deficits were observed. Noteworthy, buffering mitochondrial Ca2+ reverted the damaging effects observed. These molecular insights offer evidence that bacterial proteins can induce αSyn aggregation in EECs.

Keywords: Microbiome; Neuroscience.


Conflict of interest statement

The authors declare no competing interests.

Figures

None
Graphical abstract
Figure 1
Figure 1
Growth curve of A. muciniphila and conditioned media characterization (A) Growth curve as a function of culture media supplementation. (Error bars indicate the media ±SEM of six individual bacterial culture for each condition; unpaired Student’|'s t-test, ∗p < 0.05). (B) Qualitative Venn diagram showing the common and unique expressed proteins between the 0.4% mucin and mucin-free culture condition identified by mass spectrometry. Mass spectrometry data were obtained from at least six vials for each culture condition. (C) Representative 500 MHz 1H NMR spectra of A. muciniphila conditioned BHI (black line) and BHI+0.4% mucin (red line) with acetate and propionate labeled. Inserts show zoom of the metabolites spectra. (D) Graph represents 1H NMR quantification of acetate (black) and propionate (red) concentration in both conditioned media (BHI: acetate – 4.52mM ± 0.01mM; propionate: 0.67 ± 0.03mM. BHI + mucin 0.4%: acetate – 10.02 ± 0.18mM; propionate: 3.8–0.2mM). (E) and (F) shows a comparison of protein content evaluated by 500 MHz 1H NMR spectra of > 3kDa fraction of A. muciniphila conditioned BHI (black line) and BHI+0.4% mucin (red line) and < 3kDa fraction (flow-through) of BHI CM (blue line). Protein side-chain HN is shown in (E) and Hα is shown in (F). Inserts highlight representative peaks in the chemical shift portraying enlarged profile (A and B) in > 3kDa fractions when compared to <3kDa fraction (C). See also Figure 1B and Table S1.
Figure 2
Figure 2
Akkermansia muciniphila conditioned medium induces intracellular calcium signals and increased levels of α-synuclein in STC-1 cells (A) Confocal microscopy imaging of STC-1 cells incubated with Fluo-4/AM (6μM) and stimulated with 1% or 10% >3kDa fraction of mucin-free A. muciniphila conditioned medium (BHI CM) (scale bar: 10 μm). (B) Representative time-course of total Ca2+ signal. Arrow indicates the moment when culture medium was applied. (C) Quantification of the peak fluorescence following stimulation with 1% or 10% conditioned (BHI CM) and unconditioned (BHI) media. (Error bars indicate the media ±SEM; n = at least 25 cells for each group, ∗p < 0.05 by unpaired Student’s t-test). (D) αSyn staining (green) in STC-1 cells after 48-h incubation with 1%–10% conditioned (BHI CM) or unconditioned media (BHI) demonstrating increased expression of the protein. Nuclei were stained with DAPI (blue) and immunofluorescence control is shown as NSB (non-specific binding control) (scale bar: 10 μm). (E) Quantification of αSyn fluorescence intensity in images shown in (D). (Data are represented as mean ± SEM; n = at least 25 cells for each group from three individual experiments, ∗p < 0.05 by unpaired Student’s t-test). (F) Immunoblots (upper image) of total cell lysates showing the increased expression of αSyn after 48-hincubation with 1%–10% conditioned (BHI CM) or unconditioned medium (BHI). Densitometric analysis shows increased expression of αSyn in 1%–10% BHI CM condition when compared to 1%–10% BHI. (Data are represented as mean ± SEM; n = 4 individual experiments, ∗p < 0.05 by two-way Student’s t-test). (G) Immunoblots (upper image) of total cell lysates showing the increased expression of GATA-2 after 48-hincubation with 1%–10% conditioned (BHI CM) or unconditioned media (BHI). Densitometric analysis shows increased expression of GATA-2 in 1%–10% BHI CM condition when compared to 1%–10% BHI. (Data are represented as mean ± SEM; n = 3 individual experiments; ∗p < 0.05 by unpaired Student’s t-test). See also Figure Figures S1–S6.
Figure 3
Figure 3
Akkermansia muciniphila conditioned medium induces InsP3-independent intracellular calcium signals by acting directly on ryanodine receptors (A) STC-1 cells were stimulated with 1% or 10% A. muciniphila conditioned media (BHI CM) in the presence of Ca2+-free buffer. Graph shows a representative time-course of total Ca2+ signal in STC-1cells. The arrow indicates the time when culture medium was applied. (B) Quantification of the peak fluorescence following cells stimulation with 1% or 10% conditioned (BHI CM) and unconditioned (BHI) media in the presence of 1 mM Ca2+ buffer or Ca2+-free buffer. (C) STC-1 cells were incubated with 10 μM thapsigargin for 30 min and stimulated with 1% or 10% A. muciniphila conditioned media (BHI CM) in the presence of Ca2+-free buffer containing 10 μM thapsigargin. Graph shows a representative time-course of total Ca2+ signal in STC-1 cells. Arrow indicates the time when culture medium was applied. (D) Quantification of the peak fluorescence following cells stimulation with 1% or 10% conditioned (BHI CM) and unconditioned (BHI) media shows that the Ca2+ signal induced by BHI CM is blocked by 10 μM thapsigargin. (E) STC-1 cells were incubated with 2.5 μM xestospongin C for 30 min and stimulated with 1% or 10% A. muciniphila conditioned media (BHI CM) in the presence of Ca2+-free buffer containing 2.5 μM xestospongin (C) Graph shows a representative time-course of total Ca2+ signal in STC-1 cells. The arrow indicates the time when culture medium was applied. (F) Quantification of the peak fluorescence following cells stimulation with 1% or 10% conditioned (BHI CM) and unconditioned (BHI) media shows that the Ca2+ signal induced by BHI CM is not blocked by the InsP3 receptor inhibitor xestospongin C (2.5 μM). (G) STC-1 cells were incubated with 75 μM dantrolene for 30 min and stimulated with 1% or 10% A. muciniphila conditioned media (BHI CM) in the presence of Ca2+-free buffer containing 75μM dantrolene. Graph shows a representative time-course of total Ca2+ signal in STC-1cells. The arrow indicates the time when culture medium was applied. (H) Quantification of the peak fluorescence following cells stimulation with 1% or 10% conditioned (BHI CM) and unconditioned (BHI) media shows that the Ca2+ signal induced by BHI CM is completely blocked by the RyR receptor inhibitor, dantrolene (75 μM). Data in (A), (C), (E), and (G) represent a representative tracing recorded from one individual STC-1 cell of each group. Data in (B), (D), (F), and (H) represented as mean ± SEM of three independent experiments in which at least 25 individual cells were analyzed for calcium transient. ∗p < 0.05 by one-way Student’s t-test). See also Figure S7.
Figure 4
Figure 4
Increased mitochondrial Ca2+ uptake elicited by Akkermansia muciniphila conditioned media leads to mitochondrial stress and reduced ΔΨm (A) Representative time-course of mitochondrial Ca2+ signal. Cells were incubated with the mitochondrial Ca2+ indicator Rhod-2/AM and stimulated with 10% A. muciniphila conditioned medium (BHI CM) in the presence of Ca2+-free buffer. The arrow indicates the time when culture medium was applied. (B) Graphs show quantification of the peak of fluorescence following stimulation with 10% BHI CM. (C) Representative time-course of mitochondrial Ca2+ signal of cells incubated for 48 h with 1%–10% A. muciniphila conditioned medium (BHI CM) and stimulated with 10 μM ATP in the presence of Ca2+-free buffer. The arrow indicates the moment when culture medium was applied. (D) Graphs show quantification of the peak of fluorescence following stimulation with ATP. (E) Confocal images of STC-1 cells incubated for 48 h with 10% BHI CM and then stained with MitoTracker Red CMXRos (red). Nuclei were stained with DAPI (blue). (F) Quantification of fluorescent signal in untreated and treated cells. Data in (A) and (C) represent a representative tracing recorded from one individual STC-1 cell of each group. Data in (B), (D), and (F) represented as mean ± SEM of three independent experiments in which at least 25 individual cells were analyzed. ∗p < 0.05 by unpaired Student’s t-test See also Figure S8.
Figure 5
Figure 5
α-synuclein phosphorylation and aggregation as a result of increased intracellular levels of ROS due to Akkermansia muciniphila conditioned media treatment of enteroendocrine cells (A) Time lapse of ROS production in STC-1 cells measured by DHE fluorescence intensity under confocal live imaging. 1% and 10% BHI or BHI CM was used as stimuli. 100 μM H2O2 was used as positive control. (B) Quantitative summary of the effects of A. muciniphila conditioned and unconditioned media on ROS production. ∗p < 0.001 by unpaired Student’s t-test. (C) Confocal images of pSer129 αSyn staining (green) in STC-1 cells after 48-h incubation with 1%–10% conditioned (BHI CM) or unconditioned media (BHI) demonstrating increased phosphorylation of the protein. Nuclei were stained with DAPI (blue) and immunofluorescence control is shown as NSB (non-specific binding control). Arrows point to aberrant fibrillary-like structures. (Scale bar: 10 μm). (D) Immunoblots (upper image) of total cell lysates showing the increased phosphorylation of αSyn on Ser129 (normalized against total αSyn) after 48-h incubation with 1/10% conditioned (BHI CM) or unconditioned media (BHI). Densitometric analysis shows phosphorylation of αSyn (pSer129) in 1%–10% BHI CM condition when compared to 1/10% BHI. ∗p < 0.05 by unpaired Student’s t-test. (E) Confocal images of hαSyn GFP-tagged plasmid transfected into STC-1 cells exhibits diffuse distribution in untreated or BHI-treated cells. Cells treated with 1%–10% BHI CM medium forms inclusions of different sizes (bottom images). (Scale bar: 10 μm). (F) Graph shows the number of GFP-positive cells containing inclusions in each condition. ∗p < 0.05 by unpaired Student’s t-test. Data in (A) represent a representative tracing recorded from one individual STC-1 cell of each group. Data in (B) and (F) represented as mean ± SEM of independent experiments in which at least 25 individual cells were analyzed in B and six slides for (F). Densitometric analysis of western blot (D) is derived from triplicates of three different experiments. See also Figure S8.
Figure 6
Figure 6
Mitochondrial Ca2+ buffering reduces intracellular ROS levels elicited by Akkermansia muciniphila conditioned medium (A) Confocal images of STC-1 cells transfected with mitochondrial parvalbumin (PV) expression and control vectors showing the expression and mitochondrial localization of targeted PV-MTS-GFP and MTS-GFP fusion proteins. Scale bar = 10 μM. (B) Representative changes in mitochondrial Ca2+ signals over time are shown. Cells transfected with the indicated vectors were loaded with Rhod-2/AM and stimulated with 1%–10% unconditioned (BHI) or conditioned medium (BHI-CM) (arrow). Ca2+ signals were attenuated in cells expressing PV in mitochondria. (C) Peak Ca2+ signals were observed in three separate experiments for STC-1 cells transfected with MTS-GFP, and cells transfected with PV-MTS-GFP. ∗p < 0.05 by unpaired Student's t-test. (D) Representative changes in intracellular ROS levels over time are shown. Cells transfected with the indicated vectors were loaded with DHE and induced by 1/10% unconditioned (BHI) or conditioned medium (BHI-CM) (arrow). DHE fluorescence intensity was significantly reduced in cells expressing PV-MTS-GFP fusion protein. (E) Peak ROS signals were observed in three separate experiments for STC-1 cells transfected with MTS-GFP, and cells transfected with PV-MTS-GFP stimulated with each represented condition. ∗p < 0.05 by unpaired Student’s t-test. Data in (B) and (D) represent a representative tracing recorded from one individual STC-1 cell of each group. Data in (C) and (E) represented as mean ± SEM of three independent experiments in which at least 25 individual cells were analyzed.
Figure 7
Figure 7
α-synuclein phosphorylation and aggregation induced by Akkermansia muciniphila conditioned medium are prevented due to mitochondrial Ca2+ buffering (A) Immunoblots (upper image) of total cell lysates from PV-MTS-GFP or MTS-GFP transfected cells showing a decrease in αSyn phosphorylation on Ser129 after 48-h incubation with 1%–10% conditioned (BHI CM) or unconditioned media (BHI). (B) Densitometric analysis shows that mitochondrial Ca2+ buffering reduced αSyn phosphorylation in 1%–10% BHI CM condition when compared to cells expressing MTS-GFP fusion protein. ∗p < 0.05 by two-way Student’s t-test. (C) Densitometric analysis shows that mitochondrial Ca2+ buffering did not reduce αSyn expression induced by 1/10% BHI CM condition when compared to cells expressing MTS-GFP fusion protein. ∗p < 0.05 by two-way Student’s t-test. (D) Confocal images of STC-1 cells co-transfected with PV-MTS-GFP and αSyn-mCherry tagged construct show reduced number of intracellular αSyn aggregates after 48 h incubation with 1%–10% BHI CM. (scale bar: 10μM). (E) Quantification of the number of GFP-positive cells containing mCherry-tagged αSyn aggregates. Data are expressed as percentage of total GFP-positive cells per image. ∗p < 0.05; Ns, not significant by unpaired Student’s t-test. Densitometric analysis of western blot (B) and (C) are derived from triplicates of three different experiments. Data in (E) represented as the mean ± SEM of at least three independent experiments in which at least six individual slides were analyzed.
Figure 8
Figure 8
Commensal gut Akkermansia muciniphila induces α-synuclein aggregation in enteroendocrine cells (A) Aggregate-specific aSyn dot blots derived from total ileum homogenate of aged mice. Each dot is representative of a piece of tissue from one animal. (B) Densitometry quantification of dot blots in (A). (C) 3D z stack image of a 150μm section of the ileum of aged mice treated with PBS or with mucin-free cultivated A. muciniphila (AKK) for 28 days. CCK-positive EECs are stained for anti-CCK (white), specific antibody for αSyn-aggregates (green), actin cytoskeleton (phalloidin, red), and DAPI. (D) Quantification of αSyn aggregates and fibrils fluorescence (% of control). (E) Quantification of the number of CCK-positive cells containing αSyn aggregates and fibrils in control and AKK-treated mice. Data are represented as mean ± SEM Each dot represents the mean fluorescence of at least 15 cells per slice (at least three slices of five individual animals). Scale bar = 10 μm. See also Figure S9.

References

    1. Abbott R.D., Petrovitch H., White L.R., Masaki K.H., Tanner C.M., Curb J.D., Grandinetti A., Blanchette P.L., Popper J.S., Ross G.W. Frequency of bowel movements and the future risk of Parkinson's disease. Neurology. 2001;57:456–462. - PubMed
    1. Adams-Carr K.L., Bestwick J.P., Shribman S., Lees A., Schrag A., Noyce A.J. Constipation preceding Parkinson's disease: a systematic review and meta-analysis. J. Neurol. Neurosurg. Psychiatry. 2016;87:710–716. - PubMed
    1. Alvarenga E.C., Fonseca M.C., Carvalho C.C., Florentino R.M., Franca A., Matias E., Guimaraes P.B., Batista C., Freire V., Carmona A.K., et al. Angiotensin converting enzyme regulates cell proliferation and migration. PLoS ONE. 2016;11:e0165371. - PMC - PubMed
    1. Baldini F., Hertel J., Sandt E., Thinnes C.C., Neuberger-Castillo L., Pavelka L., Betsou F., Kruger R., Thiele I., Consortium N.-P. Parkinson's disease-associated alterations of the gut microbiome predict disease-relevant changes in metabolic functions. BMC Biol. 2020;18:62. - PMC - PubMed
    1. Bedarf J.R., Hildebrand F., Coelho L.P., Sunagawa S., Bahram M., Goeser F., Bork P., Wullner U. Functional implications of microbial and viral gut metagenome changes in early stage L-DOPA-naive Parkinson's disease patients. Genome Med. 2017;9:39. - PMC - PubMed

LinkOut - more resources