. 2022 Feb 15:13:100218.
doi: 10.1016/j.mtbio.2022.100218. eCollection 2022 Jan.

Nanomaterial-based biosensor developing as a route toward in vitro diagnosis of early ovarian cancer

Affiliations

Nanomaterial-based biosensor developing as a route toward in vitro diagnosis of early ovarian cancer

Yuqi Yang et al. Mater Today Bio. .

Abstract

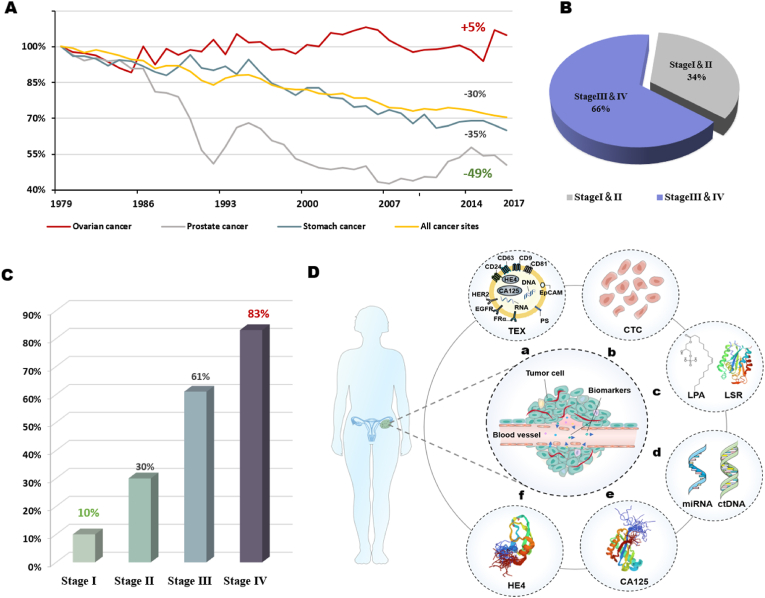
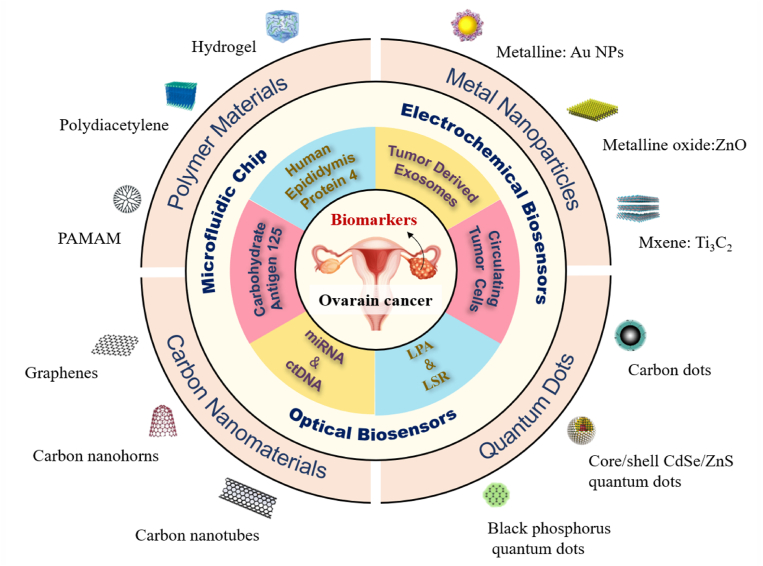
The grand challenges of ovarian cancer early diagnosis have led to an alarmingly high mortality rate from ovarian cancer (OC) in the past half century. In vitro diagnosis (IVD) has great potential in the early diagnosis of OC through non-invasive and dynamic analysis of biomarkers. However, common IVDs often fail to provide reliable test results due to lack of sensitivity, specificity, and convenience. In recent years, the discovery of new biomarkers and the progress of nanomaterials can solve the shortcomings of traditional IVD for early OC. These emerging biosensors based on nanomaterials offer great improvements in convenience, speed, selectivity, and sensitivity of IVD. In this review, we firstly systematically summarized the limits of commercial IVD biosensors of OC and the latest discovery of new biomarkers for OC. The representative optimization strategies for six potential ovarian cancer biomarkers are systematically discussed with emphasis on nanomaterial selection and the design of detection principles. Then, various strategies adopted by emerging biosensors based on nanomaterials are also introduced in detail, including optical, electrochemical, microfluidic, and surface plasmon sensors. Finally, current challenges of early OC IVD are proposed, and future research directions on this promising field are also discussed.

Keywords: Biomarker; Early diagnosis; Immunosensor; In vitro diagnosis; Nanomaterials; Ovarian cancer.


Conflict of interest statement

The authors declare that they have no known competing financial interests or personal relationships that could have appeared to influence the work reported in this paper.

Figures

Image 1
Graphical abstract
Fig. 1
Fig. 1
(A) Changes in mortality of all sites, prostate, stomach and ovarian cancer. (B) Stage of ovarian cancer at diagnosis. (C) Mortality of different stages of ovarian cancer. (D) Biomarkers of research value in the blood of patients with ovarian cancer. Including emerging biomarkers: (a) TEX (b) CTC (c) LPA and LSR (d) miRNA and ctDNA, and classic markers: (e) CA125 (f) HE4.
Fig. 2
Fig. 2
The scope and focus of this article. OC is one of the most common cancers in women all over the world. The stage at the time of the diagnosis seriously affects the survival rate of ovarian cancer patients. IVD of biomarkers related to OC has become a breakthrough in the diagnosis of OC. Emerging biomarkers (TEX, CTC, LPA, LSR, metabolites, miRNA and ctDNA) and classic biomarkers (CA125 and HE4) show considerable potential. Various excellent detection technologies (such as microfluidic chip, optical biosensors and electrochemical biosensors) combined with nano materials (polymer materials, carbon nanomaterials, quantum dots (QDs) and metal nanoparticles) improve the detection performance of these biomarkers.
Fig. 3
Fig. 3
Types of nanomaterials and sensors in the in vitro diagnosis of ovarian cancer. (A) The principle of capturing tested-biomarkers in the blood sample on the biosensors. (B) Types of nanomaterials in the in vitro diagnosis of ovarian cancer. (C) Types of sensors used in the in vitro diagnosis of ovarian cancer. (D) Large-scale commercialized IVD instrument.
Fig. 4
Fig. 4
(A) The workflow for fabricating a 3D nano-HB chip. (B) The SEM images of HB array patterned on a glass substrate with a crystalline nanoporous structure. (C) Simulation of mixing two streams of 50-nm nanoparticles (NPs) and water co-flowing in a flat-channel, solid-HB, or nano-HB device. (D) Simulation results show the transverse flow profiles across the channel width and the streamwise flow profiles along the channel length. (E) Representative 2D confocal microscopic images of the nano-HB (top) and solid-HB structures (bottom). (F) Representative 2D confocal microscopic images of the nano-HB (top) and solid-HB structures (bottom). (G) Comparison of standard UC isolation and the nano-HB capture of fluorescently stained exosomes of various cancer cell lines spiked in healthy plasma (106 ​μL−1). (H) Comparing the nano-HB chip and a standard microplate kit for ELISA detection of six proteins in SKOV3 and OVCAR3 exosomes. Reprinted with permission from Ref. [38]. Copyright 2019, Springer Nature.
Fig. 5
Fig. 5
Biosensor for LSR detection. (A) The illustration of the construction process of PEC biosensor. (B) Photocurrent generation mechanism in Anatase/Rutile TiO2 mesocrystals junction. (C) The excited electrons transfer regulation in MMMJ. (D) Sensitive mechanism of CuNCs. (E) Photocurrent responses of the PEC biosensor toward different concentrations of LSR. (F) Color variations in leuco-MB functionalized colorimetric PVA films of the colorimetric biosensor. Reprinted with permission from Ref. [72]. Copyright 2019 Elsevier B.V.
Fig. 6
Fig. 6
Colorimetric observation and electrochemical detection of HOTAIR. (A) Schematic representation of the amplification free colorimetric detection of lncRNA. (B)–(C) Specificity of the assay. Bar diagrams indicate absorbance and current densities obtained in response to 1.0 pM of miR-486, miR-891, and HOTAIR sequences, respectively. (D)–(F) Sensitivity of the assay. They show visual inspection images, absorbance at 652 ​nm and amperometric current density of HOTAIR from a range of synthetic lncRNA sequences (1 ​fM), respectively. Reprinted with permission from Ref. [97]. Copyright 2020 by the authors.
Fig. 7
Fig. 7
(A)Schematic illustrations of synthetic route of FeOOH@ZIF-8 core-satellite nanocomposites and LDI-MS extraction of serum metabolic fingerprints. (B) Mass spectra of small metabolites mixture and (C) the mean intensities of their Na-adducted signals in 5 ​mg ​mL−1 BSA when using ZIF-8, FeOOH/ZIF-8, FeOOH, and FeOOH@ZIF-8 as matrix. (D) Orthogonal partial least-squares discrimination analysis score plots showing the global metabolic difference between 29 OC and 30 controls. (E) S-plots of OC vs. control. (F) Blind test based on the established models to differentiate 10 OC patients from 10 controls. Reprinted with permission from Ref. [101]. Copyright 2020 Wiley-VCH Verlag GmbH & Co. KGaA, Weinheim.
Fig. 8
Fig. 8
GMR multiplex detection sensor system. (A)Detection mechanism and assay sequence. (Green-CA125, purple-HE4, blue-IL6 and gray-BSA.) (B) Real-time multiplex tests on GMR sensors. (C) Schematic representation of Wheatstone Bridge circuit on the multiplexing board. (D) Simplified schematic of Wheatstone Bridge. (E) Signal decomposed into a center tone and two mixed frequency components (side tones). (F) Benchtop GMR base station, with an overall size of 20 ​cm ​× ​20 ​cm ​× ​20 ​cm. (G) Design inside the base station. (H) Pin array aligning and moving close with the electrode pads of the GMR chip. (I) Reaction-well attached GMR chip on the chip holder. Reprinted with permission from Ref. [115]. Copyright 2018 Elsevier B.V.
Fig. 9
Fig. 9
(A) Scheme for the preparation of Nb3@nPCN-224 and fabrication of PEC HE4 immunosensor. (B) Calibration plot of the PEC immunoassay for the detection of different concentrations of HE4. Inset: photocurrent responses of the PEC immunosensor. (C) Photocurrent responses of the proposed immunosensor for 10.0 ng/mLHE4 compared to those for 1.00 ​mg/mL interferents (CEA, AFP, L-Cys, HSA) and the mixture of them in 10 ​mM PBS solution. Reprinted with permission from Ref. [126]. Copyright 2020 Elsevier B.V.

References

    1. Siegel R.L., Miller K.D., Fuchs H.E., et al. Cancer statistics, 2021[J] CA Canc. J. Clin. 2021;71(1):7–33. - PubMed
    1. Sung H., Ferlay J., Siegel R.L., et al. Global cancer statistics 2020: GLOBOCAN estimates of incidence and mortality worldwide for 36 cancers in 185 countries[J] CA Canc. J. Clin. 2021;71(3):209–249. - PubMed
    1. Ferlay J., Colombet M., Soerjomataram I., et al. Cancer statistics for the year 2020: an overview[J] Int. J. Cancer. 2021 - PubMed
    1. Islami F., Ward E.M., Sung H., et al. Annual report to the nation on the status of cancer, Part 1: national cancer statistics[J] J. Natl. Canc. Inst. 2021 - PMC - PubMed
    1. Kensler K.H., Pernar C.H., Mahal B.A., et al. Racial and ethnic variation in PSA testing and prostate cancer incidence following the 2012 USPSTF recommendation[J] J. Natl. Canc. Inst. 2021;113(6):719–726. - PMC - PubMed

LinkOut - more resources