. 2022 Feb 15;3(2):100525.
doi: 10.1016/j.xcrm.2022.100525.

An omic and multidimensional spatial atlas from serial biopsies of an evolving metastatic breast cancer

Affiliations

An omic and multidimensional spatial atlas from serial biopsies of an evolving metastatic breast cancer

Brett E Johnson et al. Cell Rep Med. .

Abstract

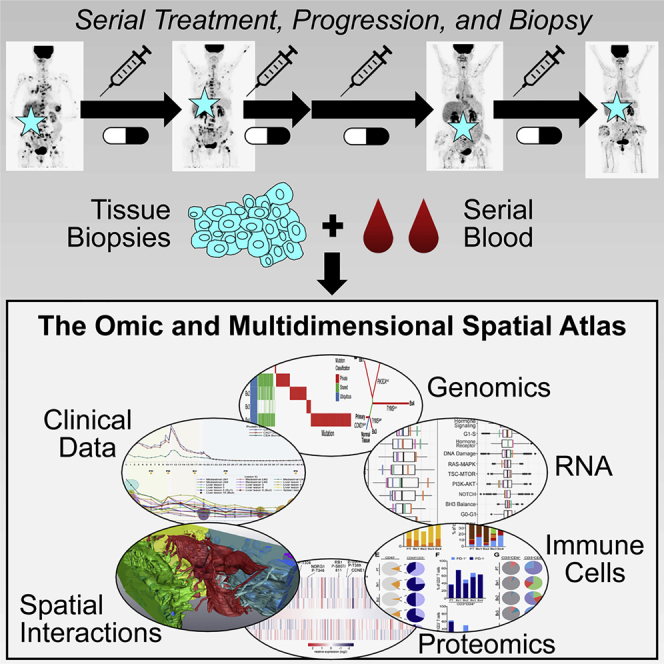
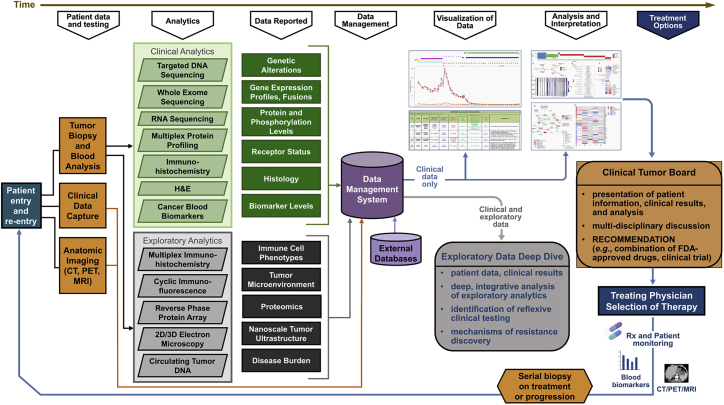
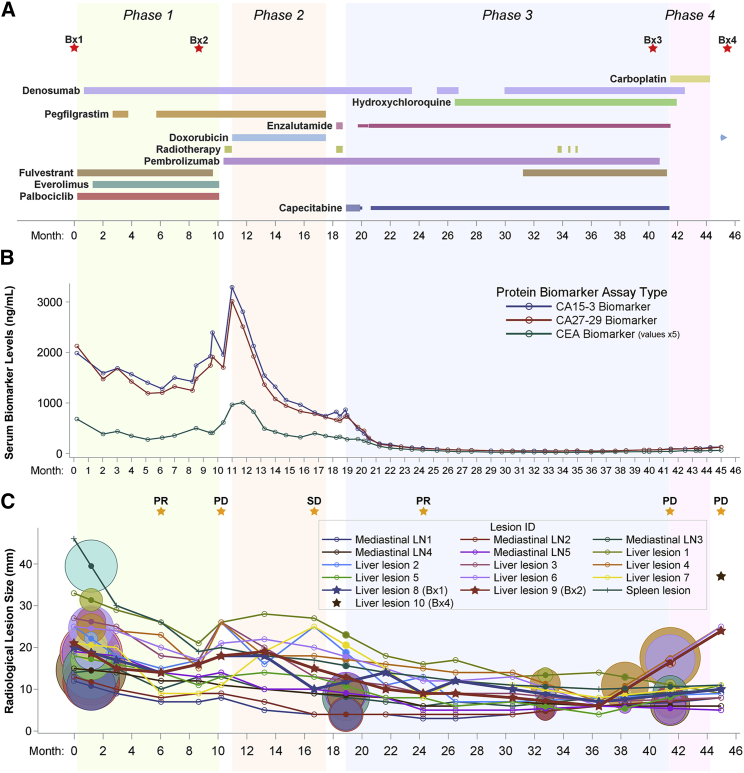
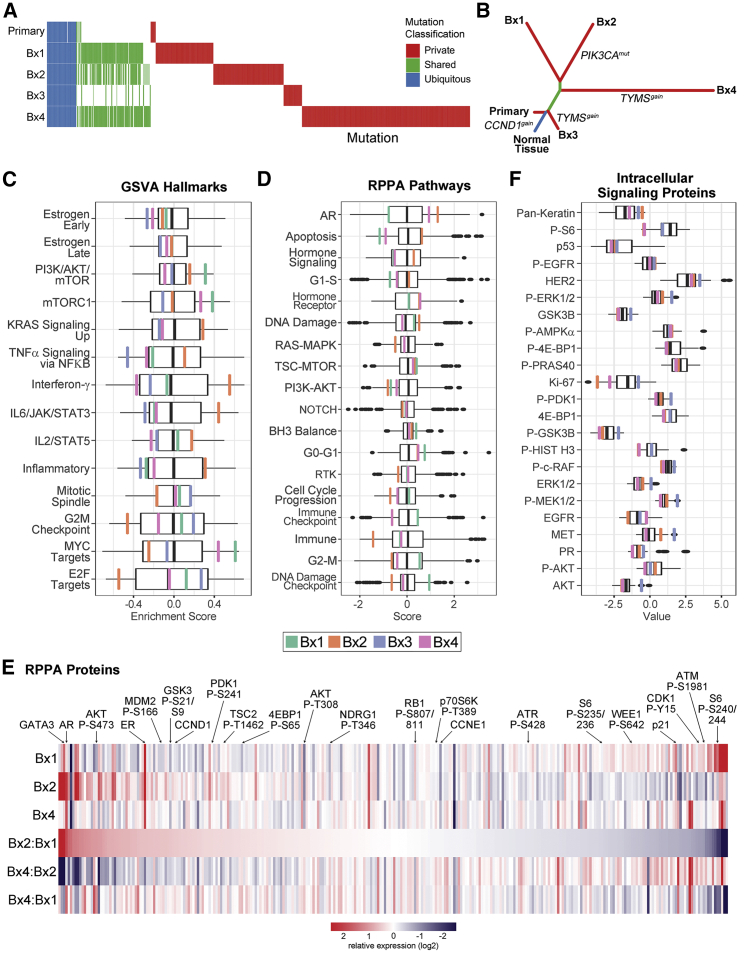
Mechanisms of therapeutic resistance and vulnerability evolve in metastatic cancers as tumor cells and extrinsic microenvironmental influences change during treatment. To support the development of methods for identifying these mechanisms in individual people, here we present an omic and multidimensional spatial (OMS) atlas generated from four serial biopsies of an individual with metastatic breast cancer during 3.5 years of therapy. This resource links detailed, longitudinal clinical metadata that includes treatment times and doses, anatomic imaging, and blood-based response measurements to clinical and exploratory analyses, which includes comprehensive DNA, RNA, and protein profiles; images of multiplexed immunostaining; and 2- and 3-dimensional scanning electron micrographs. These data report aspects of heterogeneity and evolution of the cancer genome, signaling pathways, immune microenvironment, cellular composition and organization, and ultrastructure. We present illustrative examples of how integrative analyses of these data reveal potential mechanisms of response and resistance and suggest novel therapeutic vulnerabilities.

Keywords: human tumor atlas; metastatic breast cancer; personalized medicine; precision oncology.


Conflict of interest statement

D.S. is employed by Quantitative Imaging Systems. L.M.C. is a paid consultant for Cell Signaling Technologies, Shasqi, and AbbVie; received reagent and/or research support from Plexxikon, Pharmacyclics, Acerta Pharma, Deciphera Pharmaceuticals, Genentech, Roche Glycart AG, Syndax Pharmaceuticals, Innate Pharma, and NanoString Technologies; and is a member of the scientific advisory boards of Syndax Pharmaceuticals, Carisma Therapeutics, Zymeworks, Verseau Therapeutics, Cytomix Therapeutics, and Kineta. G.B.M. has licensed technologies to Myriad Genetics and NanoString; is on the SAB or is a consultant to Amphista, AstraZeneca, Chrysallis Biotechnology, GSK, ImmunoMET, Ionis, Lilly, PDX Pharmaceuticals, Signalchem Lifesciences, Symphogen, Tarveda, Turbine, and Zentalis Pharmaceuticals; and has stock/options/financial interests in Catena Pharmaceuticals, ImmunoMet, SignalChem, and Tarveda. J.W.G. has licensed technologies to Abbott Diagnostics, Zorro Bio, and PDX Pharmaceuticals; has ownership positions in Convergent Genomics, Health Technology Innovations, Zorro Bio, and PDX Pharmaceuticals; serves as a paid consultant to New Leaf Ventures; has received research support from Thermo Fisher Scientific (formerly FEI), Zeiss, Miltenyi Biotech, Cepheid (Danaher), Quantitative Imaging, Health Technology Innovations, and Micron Technologies; and owns stock in Abbott Diagnostics, AbbVie, Alphabet, Amazon, Amgen, Apple, General Electric, Gilead, Intel, Microsoft, Nvidia, and Zimmer Biomet.

Figures

None
Graphical abstract
Figure 1
Figure 1
Workflows and analytical platforms used to generate the OMS atlas
Figure 2
Figure 2
Timeline of clinical treatment and response metrics (A) Treatment schedule and biopsy timing (red stars) over four phases of treatment (green, orange, blue, and pink areas). The timeline is sectioned into 28-day months. The duration and relative dose for each drug is indicated by the extent and width of a horizontal bar. Drug continuation after the end of phase 4 is indicated by a right arrow. (B) Clinically reported serum levels of tumor protein biomarkers. CEA values were multiplied by 5 to ease visualization. (C) RECIST 1.1 assessment of tumor response (orange stars) indicating partial response (PR), progressive disease (PD), or stable disease (SD). Shown are longitudinal tracking and variation in the longest-axis size of 16 representative metastatic lesions measured from serial CT images. Targets of metastatic biopsies are bolded and marked with stars. Circles represent FDG-PET imaging results, colored and centered on the lines of their corresponding lesion at interpolated lesion sizes. The diameter of each circle is proportional to the background-normalized maximum standardized uptake value (SUVmax).
Figure 3
Figure 3
Genomic, transcriptomic, and proteomic profiles reveal spatiotemporal heterogeneity and evolution (A) Comparison of somatic mutations. Columns represent individual, non-silent SNVs or indels identified from WES in at least one tissue sample and classified as ubiquitous (present in all samples, blue), shared (present in at least two samples, green), or private (present in only a single sample, red). Mutational status in each sample is indicated as independently called (colored), detected in at least 2 sequencing reads but not independently called (reduced opacity), or absent (white). (B) Phylogenetic tree showing the evolutionary relationship between the PT and four metastases. (C) Transcriptomic gene set variation analysis (GSVA) of cancer hallmark pathways. The boxplot represents the distribution (upper and lower quartiles and median) of GSVA scores for the TCGA luminal breast cancer cohort. Enrichment scores are shown for each of the biopsy samples: Bx1 (green), Bx2 (orange), Bx3 (blue), and Bx4 (pink). (D) RPPA protein pathway activity assessment using pathway scores. The boxplots represent the distribution of the pathway activity of the TCGA breast cancer cohort. The pathway activities of three biopsy samples are marked as in (D). (E) Total and phosphoprotein levels from RPPA normalized within the TCGA breast cancer cohort. The heatmap shows relative protein levels for three biopsies and the fold change between sample pairs. Proteins are ordered based on the fold change difference between Bx2 relative to Bx1. Selected proteins are highlighted. (F) ISPP measurements of total and phosphoprotein levels. The boxplots represent the distribution of protein levels of 57 metastatic breast cancers. The protein levels of three biopsy samples are marked as in (D). See also Figure S3 and Table S2.
Figure 4
Figure 4
Monitoring response to therapy with deep in situ immune phenotyping by mIHC (A) Primary tumor (PT) and Bx1–Bx4 were subjected to multiplex immunohistochemistry (mIHC) analyses measuring immune (CD45+) and epithelial (PanCK+) cells in tumor compartments as a percentage of total nucleated cells. (B) Representation of tissue composition, showing density (number of cells per square millimeter of tissue analyzed) of PanCK+ (cytokeratin), CD45+, and PanCK CD45 (other) nucleated cells. (C) Immune composition of seven major leukocyte lineages, as a percentage of total CD45+ cells. (D) Deeper auditing of leukocyte lineages in Bx1 and Bx2, measuring 12 immune cell populations and functional states. (E) CD3+ T cell proportions of total CD45+ cell populations (orange, left), and CD4+ (blue) and CD8+ T cells (periwinkle) proportions within CD45+CD3+ T cells (right). (F) PD-1+ cells as a percentage of total CD3+T cells in the CD3+CD4+ (top) and CD3+CD8+ (bottom) T cell populations. (G) Differentiation state of CD3+CD4+ T cells, reflected by regulatory T (Treg), Th1, and Th2, Th17, and Th0/γδ subsets (left) and CD3+CD8+ T cells, as reflected by expression of PD-1 and EOMES. (H) Differentiation state of CD3+CD4+ T cells reflected by Treg, Th17, Th1, Th2, and Th0/γδ subsets in Bx1 and Bx2. See also Figure S4 and Table S2.
Figure 5
Figure 5
Monitoring tumor and stromal responses to therapy using CycIF and FIB-SEM (A) Example images of antibody staining overlaid with segmentation borders, colored by cell type. Scale bar, 50 μm. (B) Heatmap of mean Z-scored intensity of unsupervised Leiden clustering (resolution, 0.45) on single-cell mean intensity of biopsies and control tissues and cell lines, with annotations on the right. Lum, luminal; Mes, mesenchymal; Fibro, fibroblast. Colored row labels indicate which biopsy was most dominant for each cluster: Bx2 (orange), Bx3 (blue), or Bx4 (pink). Cluster 16 is evenly split between Bx3 and Bx4. (C) Single-cell mean intensity distributions of ER and PCNA staining of cells 0–25, 25–50, and 50–75 μm from positive collagen staining. Asterisks indicate significant (p < 0.001) differences in mean intensity between distances (ANOVA). (D) Two views of reconstructed 3D FIB-SEM data from Bx1 showing the relationship between cancer cells (red and pink), stromal cells (blue and turquoise), and collagen (green). A full-volume view (left) shows nanoscale cell-cell interactions of stromal cells surrounding a tumor nest (collagen is not rendered in this image), whereas the close-up view (right) shows a fibroblast-like cell interposed between the tumor and collagen. Scale bars, 5 μm. See also Figure S5 and Table S5.
Figure 6
Figure 6
Inter- and intracellular compositions and interactions revealed using FIB-SEM (A) 2D SEM image from Bx4 showing the relationship between tumor cell nests and stromal collagen, along with a high density of extracted lysosomes. Scale bar, 10 μm. The selected insets show these features at high magnification. Scale bars, 3 μm. (B) A side view of an elongated tumor cell from 3D FIB-SEM of Bx2 showing FLPs (red) and alignment of the internal mitochondria (fuchsia). Scale bar, 1 μm. (C) Additional cells from Bx2 (the same red cell as in B) showing paddle-shaped lamellipodia (green cell) and long FLPs (red and blue cells) extending into the stroma and interacting with neighboring cells. Scale bar, 500 nm. (D) Reconstructed 3D FIB-SEM data from Bx1 showing FLPs selectively extending toward neighboring cells and extracellular debris. Scale bar, 1 μm. (E and F) Additional detail from Bx2 (E) and Bx1 (F) of the nuclear invaginations (blue), showing the organization of mitochondria (fuchsia) and macropinosomes (yellow) with respect to nuclear folds. Scale bars, 1 μm. (G) 3D FIB-SEM volume of Bx2 showing large electron-dense lysosomal granules (green) dispersed between macropinosomes (red). Scale bar, 900 nm. (H) Qualitative summary of ultrastructural feature prevalence within each biopsy. Bx4 scoring of lamellipodia is not available. See also Figure S6 and Videos S1, S2, S3, and S4.
Figure 7
Figure 7
Mechanisms of therapeutic resistance and response suggested by RPPA (A) Phosphorylation and inferred activation of the PI3K/AKT/mTOR pathway affected by everolimus in Bx2. Decreased phosphorylation of S6 downstream of mTORC1 likely resulted from everolimus inhibition, but increased phosphorylation of proteins downstream of PI3K and AKT, possibly through mutant PI3K E542K activity and/or feedback signaling to mTORC2, may have provided continued oncogenic signaling in the presence of this drug. Proteins are noted as increased activating phosphorylation (>1.4×, red), increased inhibitory phosphorylation (>1.4×, pink), decreased activating phosphorylation (<0.7×, green), or unchanged/unknown phosphorylation (yellow). Changes in phosphorylation in Bx2 versus Bx1: PDK1 = 1.45×, AKT T308 = 1.20×, AKT S473 = 2.69×, TSC2 = 1.43×, GSK3A/B = 1.71×, MDM2 = 1.75×, p70S6K1 = 0.92×, 4EBP1 = 1.37×, S6 S235/236 = 0.69×, S240/244 = 0.14×. (B) Activation status for cell cycle regulatory pathways affected by palbociclib in Bx2, as inferred from total and phosphoprotein levels. Palbociclib blocks cell division in responsive cells by inhibiting CDK4/6 phosphorylation of RB1, but Bx2 had continued high levels of phospho-RB1 and cell proliferation under treatment with this drug (RB1 P-S807/811 = 0.98× versus pre-treatment Bx1). This is possibly due to degradation of the CDK2 inhibitor p21 (0.50× versus Bx1) by activated PI3K/AKT signaling (see A), which would activate canonical cyclin E/CDK2 complexes to drive cells through G1-S. Alternatively, cell division might be proceeding through the formation of non-canonical cyclin D1/CDK2 complexes because of amplified CCND1 (Figure S3B), high levels of cyclin D1 protein (1.67× versus Bx1), and low p21. CDK2 activation can be countered with the broad-spectrum CDK inhibitor abemaciclib. Inferred activation status is based on total protein levels or phosphorylation and is designated as relative increases (red), decreases (green), or unchanged/unknown (yellow). See also Figure 3E and Table S2.

Comment in

References

    1. Von Hoff D.D., Stephenson J.J., Jr., Rosen P., Loesch D.M., Borad M.J., Anthony S., Jameson G., Brown S., Cantafio N., Richards D.A., et al. Pilot study using molecular profiling of patients' tumors to find potential targets and select treatments for their refractory cancers. J. Clin. Oncol. 2010;28:4877–4883. - PubMed
    1. Schwaederle M., Zhao M., Lee J.J., Eggermont A.M., Schilsky R.L., Mendelsohn J., Lazar V., Kurzrock R. Impact of precision medicine in diverse cancers: a meta-analysis of phase II clinical trials. J. Clin. Oncol. 2015;33:3817–3825. - PMC - PubMed
    1. Sanchez N.S., Mills G.B., Mills Shaw K.R. Precision oncology: neither a silver bullet nor a dream. Pharmacogenomics. 2017;18:1525–1539. - PubMed
    1. Mitri Z.I., Parmar S., Johnson B., Kolodzie A., Keck J.M., Morris M., Guimaraes A.R., Beckett B.R., Borate U., Lopez C.D., et al. Implementing a comprehensive translational oncology platform: from molecular testing to actionability. J. Transl. Med. 2018;16:358. - PMC - PubMed
    1. Rozenblatt-Rosen O., Regev A., Oberdoerffer P., Nawy T., Hupalowska A., Rood J.E., Ashenberg O., Cerami E., Coffey R.J., Demir E., et al. The human tumor atlas network: charting tumor transitions across space and time at single-cell resolution. Cell. 2020;181:236–249. - PMC - PubMed

Publication types