Solution speciation and human serum protein binding of indium(III) complexes of 8-hydroxyquinoline, deferiprone and maltol
- PMID: 35243522
- PMCID: PMC8960621
- DOI: 10.1007/s00775-022-01935-6
Solution speciation and human serum protein binding of indium(III) complexes of 8-hydroxyquinoline, deferiprone and maltol
Abstract
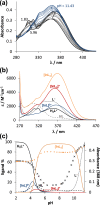
Solution speciation and serum protein binding of selected In(III) complexes bearing O,O and O,N donor sets were studied to provide comparative data for In(III) and analogous Ga(III) complexes. Aqueous stability of the In(III) complexes of maltol, deferiprone, 8-hydroxyquinoline (HQ) and 8-hydroxyquinoline-5-sulfonate (HQS) was characterized by a combined pH-potentiometric and UV-visible spectrophotometric approach. Formation of mono, bis and tris-ligand complexes was observed. The tris-ligand complexes of HQ (InQ3) and deferiprone (InD3) are present in solution in ca. 90% at 10 µM concentration at pH = 7.4, while the tris-maltolato complex (InM3) displays insufficient stability under these conditions. Binding towards human serum albumin (HSA) and (apo)transferrin ((apo)Tf) of InQ3, InD3 and InM3 complexes and Ga(III) analogue of InQ3 (GaQ3) together with InCl3 was investigated by a panel of methods: steady-state and time-resolved spectrofluorometry, UV-visible spectrophotometry and membrane ultrafiltration. Moderate binding of InQ3 to HSA was found (log K' = 5.0-5.1). InD3 binds to HSA to a much lower extent in comparison to InQ3. ApoTf is able to displace HQ, deferiprone and maltol effectively from their In(III) complexes. Protein binding of non-dissociated InQ3 was also observed at high complex-to-apoTf ratios. Studies conducted with the InQ3/GaQ3 - HSA - Tf ternary systems revealed the more pronounced Tf binding of In(III) via ligand release, while the original GaQ3 scaffold is preferably retained upon protein interactions and significant albumin binding occurs. Significant dissociation of InQ3 was detected in human blood serum as well.
Keywords: Albumin; Fluorescence; Stability constant; Transferrin; Ultrafiltration.
© 2022. The Author(s).
Conflict of interest statement
There are no conflicts to declare.
Figures


Similar articles
-
Interaction of the anticancer gallium(III) complexes of 8-hydroxyquinoline and maltol with human serum proteins.J Biol Inorg Chem. 2015 Jan;20(1):77-88. doi: 10.1007/s00775-014-1211-9. Epub 2014 Nov 15. J Biol Inorg Chem. 2015. PMID: 25398250
-
Comparative solution equilibrium studies of anticancer gallium(III) complexes of 8-hydroxyquinoline and hydroxy(thio)pyrone ligands.J Inorg Biochem. 2012 Dec;117:189-97. doi: 10.1016/j.jinorgbio.2012.08.005. Epub 2012 Aug 24. J Inorg Biochem. 2012. PMID: 23089600
-
New insights into the interactions of serum proteins with bis(maltolato)oxovanadium(IV): transport and biotransformation of insulin-enhancing vanadium pharmaceuticals.J Am Chem Soc. 2005 Apr 13;127(14):5104-15. doi: 10.1021/ja043944n. J Am Chem Soc. 2005. PMID: 15810845
-
Comparative solution equilibrium studies on pentamethylcyclopentadienyl rhodium complexes of 2,2'-bipyridine and ethylenediamine and their interaction with human serum albumin.J Inorg Biochem. 2015 Nov;152:93-103. doi: 10.1016/j.jinorgbio.2015.08.025. Epub 2015 Sep 2. J Inorg Biochem. 2015. PMID: 26364131
-
Binding mechanisms of half-sandwich Rh(III) and Ru(II) arene complexes on human serum albumin: a comparative study.J Biol Inorg Chem. 2019 Aug;24(5):703-719. doi: 10.1007/s00775-019-01683-0. Epub 2019 Jul 12. J Biol Inorg Chem. 2019. PMID: 31300922 Free PMC article.
References
-
- Dilworth JR, Pascu SI. The radiopharmaceutical chemistry of Gallium(III) and Indium(III) for SPECT imaging. In: Long N, Wong WT, editors. The chemistry of molecular imaging. Wiley; 2014. pp. 165–178.
-
- Blower JE, Cooper MS, Imberti C, Ma MT, Marshall C, Young JD, Blower PJ. The radiopharmaceutical chemistry of the radionuclides of gallium and indium. In: Lewis JS, Windhorst AD, Zeglis BM, editors. The radiopharmaceutical chemistry of the radionuclides. Springer; 2019. pp. 255–271.
Publication types
MeSH terms
Substances
Grants and funding
LinkOut - more resources
Full Text Sources
Miscellaneous

