Review
. 2022 Jun;28(12):3795-3811.
doi: 10.1111/gcb.16152. Epub 2022 Mar 17.

Responsible agriculture must adapt to the wetland character of mid-latitude peatlands

Affiliations
Review

Responsible agriculture must adapt to the wetland character of mid-latitude peatlands

Benjamin W J Freeman et al. Glob Chang Biol. 2022 Jun.

Abstract

Drained, lowland agricultural peatlands are greenhouse gas (GHG) emission hotspots and a large but vulnerable store of irrecoverable carbon. They exhibit soil loss rates of ~2.0 cm yr-1 and are estimated to account for 32% of global cropland emissions while producing only 1.1% of crop kilocalories. Carbon dioxide emissions account for >80% of their terrestrial GHG emissions and are largely controlled by water table depth. Reducing drainage depths is, therefore, essential for responsible peatland management. Peatland restoration can substantially reduce emissions. However, this may conflict with societal needs to maintain productive use, to protect food security and livelihoods. Wetland agriculture strategies will, therefore, be required to adapt agriculture to the wetland character of peatlands, and balance GHG mitigation against productivity, where halting emissions is not immediately possible. Paludiculture may substantially reduce GHG emissions but will not always be viable in the current economic landscape. Reduced drainage intensity systems may deliver partial reductions in the rate of emissions, with smaller modifications to existing systems. These compromise systems may face fewer hurdles to adoption and minimize environmental harm until societal conditions favour strategies that can halt emissions. Wetland agriculture will face agronomic, socio-economic and water management challenges, and careful implementation will be required. Diversity of values and priorities among stakeholders creates the potential for conflict. Successful implementation will require participatory research approaches and co-creation of workable solutions. Policymakers, private sector funders and researchers have key roles to play but adoption risks would fall predominantly on land managers. Development of a robust wetland agriculture paradigm is essential to deliver resilient production systems and wider environmental benefits. The challenge of responsible use presents an opportunity to rethink peatland management and create thriving, innovative and green wetland landscapes for everyone's future benefit, while making a vital contribution to global climate change mitigation.

Keywords: carbon; climate change mitigation; greenhouse gases; hydrology; paludiculture; peatlands; soil loss; wetland agriculture.


Figures

FIGURE 1
FIGURE 1
Impacts of drainage for agriculture on fundamental peatland processes. Blue dashed lines indicate the average water table depth (WTD) with fluctuation around this level assumed. Semi‐natural peatlands are approximately carbon neutral but can be slight net sinks or sources of greenhouse gas (GHG) emissions depending on methane emissions. Drained peatlands are strong sources of GHG emissions from both fields and ditches. The acrotelm is the partially aerated upper layer of semi‐natural peatlands, while the catotelm is the submerged, anaerobic, lower peat layer. Fluctuations in the WTD produce a dynamic mesotelm layer between these, which has been omitted for clarity. Additions of fertiliser and livestock excreta increase labile carbon (C) and nitrogen (N) stocks in agricultural peatlands, exacerbating changes in C and N cycling. The fate of dissolved organic material leached from semi‐natural peatlands to streams and rivers is similar to that shown for drained peatlands and is omitted from the diagram in the interest of space. CH4, methane; CO2, carbon dioxide; DOC, dissolved organic carbon; N2O, nitrous oxide; OM, organic matter; POC, particulate organic carbon; SOM, soil organic matter
FIGURE 2
FIGURE 2
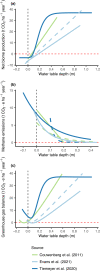
Relationships between peatland water table depth (WTD) and carbon‐derived greenhouse gas emissions. (a) Net biome production (NBP; sum of ecosystem respiration, gross primary productivity and carbon import/export). Dashed and solid light blue lines represent UK and global relationships, respectively, in Evans et al. (2021). (b) Terrestrial methane emissions (CH4; excluding ditch emissions and converted to CO2 equivalent using a 100‐year global warming potential of 28). Dashed and solid dark blue lines represent relationships for agricultural and rewetted sites, respectively, in Tiemeyer et al. (2020). Solid and dashed green lines indicate the published relationship from Couwenberg et al. (2011) and an exponential function fitted to a digitized subset of these data (see S4 for detailed description). (c) Terrestrial GHG balance of CO2 (NBP) and CH4. Functions for Tiemeyer et al. (2020) and Couwenberg et al. (2011) produced using rewetted site and exponential CH4 functions, respectively. Dashed and solid light blue lines as for (a). Vertical dashed black lines indicate the peat surface (WTD = 0 m). More positive WTD values indicate deeper drainage and negative values indicate inundation. Horizontal red dashed lines indicate emission values of zero
FIGURE 3
FIGURE 3
Nitrous oxide emission factors for selected land‐use categories. Error bars indicate 95% confidence intervals (CIs). The horizontal red dashed line indicates zero emissions and is included to highlight that the CIs for cropland and grassland sites exclude zero, while the CIs for semi‐natural and rewetted sites include zero. N2O was converted to CO2 equivalent using a 100‐year global warming potential of 265 (Myhre et al., 2013) to aid comparison with carbon‐derived greenhouse gas emissions. Land‐use categories are presented in approximate order of decreasing water table depth (WTD), with deeper drained agricultural sites on the left and near‐surface WTDs on the right. NR, nutrient‐rich and NP, nutrient‐poor. Tier 1 (Default) emissions factors (EFs) were sourced from Drösler et al. (2014), Tier 2 (Germany; DE) EFs from Tiemeyer et al. (2020) and Tier 2 (United Kingdom; UK) EFs from Evans et al. (2017)
FIGURE 4
FIGURE 4
Seasonal water management in agricultural lowland peatlands. (a) Field water table conditions with drainage ditches alone, (b) Theoretical field water table conditions with submerged drains, (c) Drainage management on agricultural peatlands subject to extensive subsidence. In winter, water is pumped from ditches up to rivers, to drain the fields and limit flood risk. In summer, water is allowed to flow down from rivers to ditches to aid irrigation of the crop/sward. Sub‐images (a) and (b) developed from Hoving et al. (2015)
FIGURE 5
FIGURE 5
Example decision‐making tree for wetland agriculture adoption. This is based on the approach of Kekkonen et al. (2019), who demonstrated that accurate spatial data combined with an appropriate decision‐making tree could provide a practical tool for land‐use planning. In practice, the decision criteria selected and boundaries between classifications (e.g. deep/shallow peat) would need to be defined appropriately for the physical and socio‐economic conditions of the nation/region in question. Those chosen here, along with the options presented in the right hand column of boxes do not represent an exhaustive list and are presented for illustrative purposes only. Bold text indicates decision criteria. Italics indicate wetland agriculture sub‐categories. Peatland restoration (not shown) would also be an essential component of wider responsible peatland management strategies

References

    1. Abel, S. (2016). Edible and medical plants from paludiculture. In Wichtmann W., Schroder C., & Joosten H. (Eds.), Paludiculture—productive use of wet peatlands: Climate protection—biodiversity—regional economic benefits. Schweizerbart Science Publishers.
    1. Alexandratos, N. , & Bruinsma, J. (2012). World agriculture towards 2030/2050: The 2012 revision. ESA working paper no. 12‐03. FAO.
    1. Anthony, T. L. , & Silver, W. L. (2021). Hot moments drive extreme nitrous oxide and methane emissions from agricultural peatlands. Global Change Biology, 27, 5141–5153. 10.1111/gcb.15802 - DOI - PubMed
    1. Beetz, S. , Liebersbach, H. , Glatzel, S. , Jurasinski, G. , Buczko, U. , & Höper, H. (2013). Effects of land use intensity on the full greenhouse gas balance in an Atlantic peat bog. Biogeosciences, 10, 1067–1082. 10.5194/bg-10-1067-2013 - DOI
    1. Bennetzen, E. H. , Smith, P. , & Porter, J. R. (2016). Decoupling of greenhouse gas emissions from global agricultural production: 1970–2050. Global Change Biology, 22, 763–781. 10.1111/gcb.13120 - DOI - PubMed