. 2022 Mar 4:11:e76494.
doi: 10.7554/eLife.76494.

Assembly of recombinant tau into filaments identical to those of Alzheimer's disease and chronic traumatic encephalopathy

Affiliations

Assembly of recombinant tau into filaments identical to those of Alzheimer's disease and chronic traumatic encephalopathy

Sofia Lövestam et al. Elife. .

Abstract

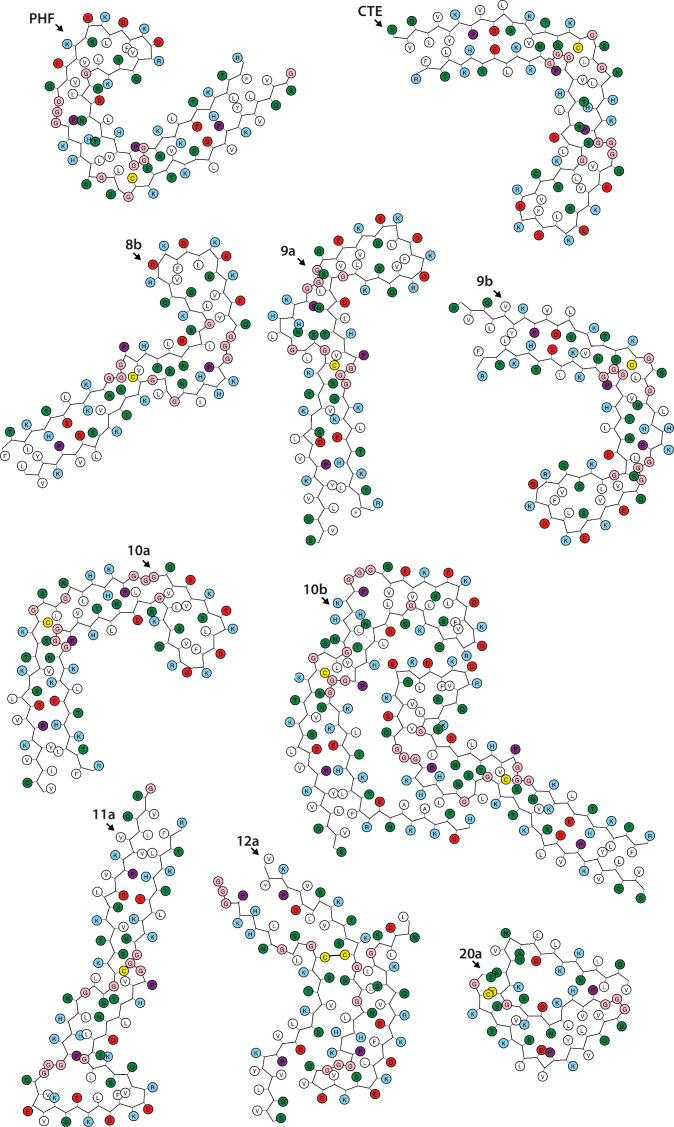
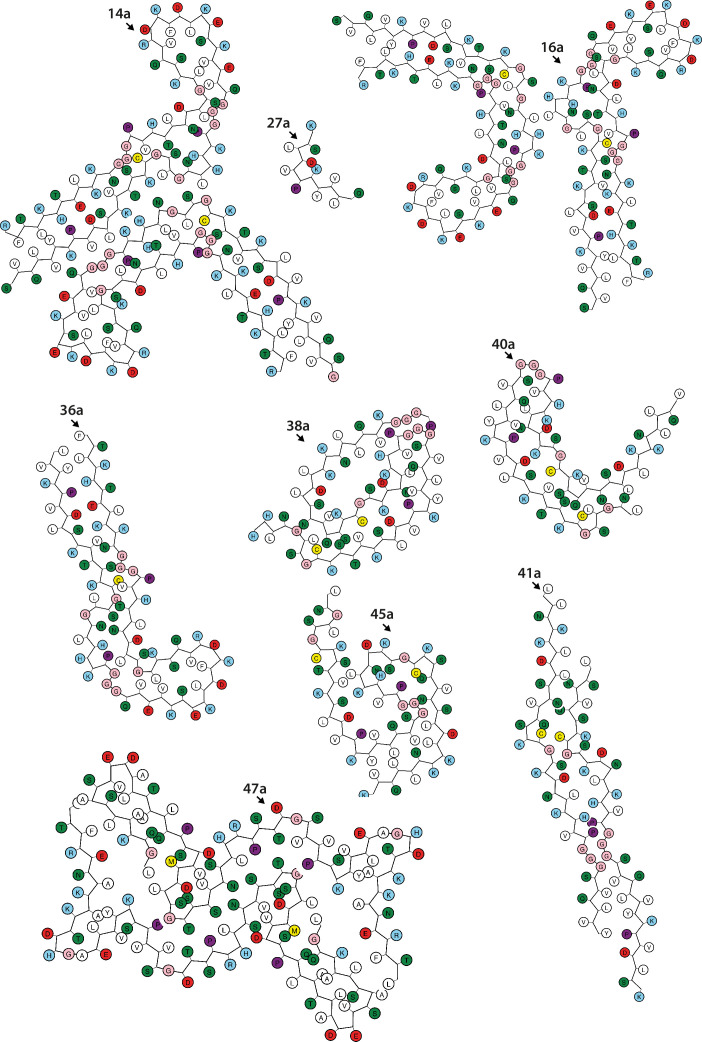
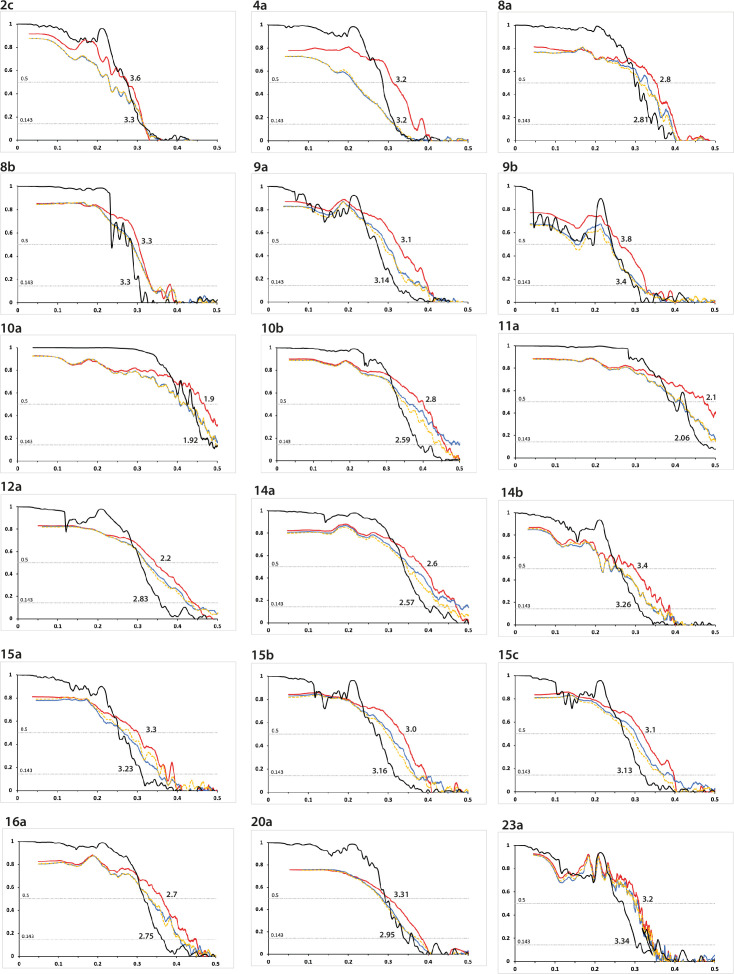
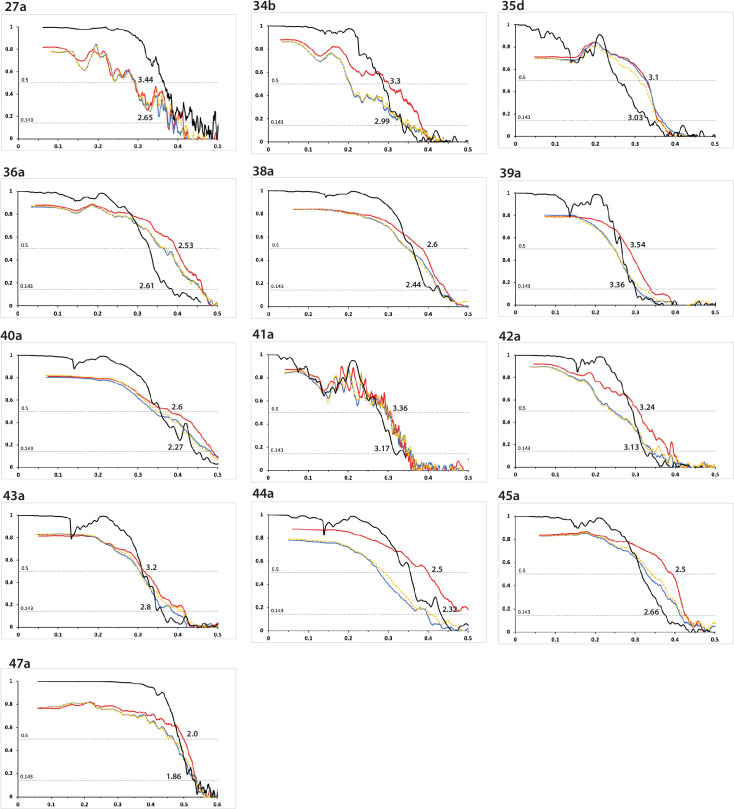
Abundant filamentous inclusions of tau are characteristic of more than 20 neurodegenerative diseases that are collectively termed tauopathies. Electron cryo-microscopy (cryo-EM) structures of tau amyloid filaments from human brain revealed that distinct tau folds characterise many different diseases. A lack of laboratory-based model systems to generate these structures has hampered efforts to uncover the molecular mechanisms that underlie tauopathies. Here, we report in vitro assembly conditions with recombinant tau that replicate the structures of filaments from both Alzheimer's disease (AD) and chronic traumatic encephalopathy (CTE), as determined by cryo-EM. Our results suggest that post-translational modifications of tau modulate filament assembly, and that previously observed additional densities in AD and CTE filaments may arise from the presence of inorganic salts, like phosphates and sodium chloride. In vitro assembly of tau into disease-relevant filaments will facilitate studies to determine their roles in different diseases, as well as the development of compounds that specifically bind to these structures or prevent their formation.

Keywords: E. coli; amyloids; cryo-EM; human; molecular biophysics; neuroscience; structural biology; tauopathies.

Plain language summary

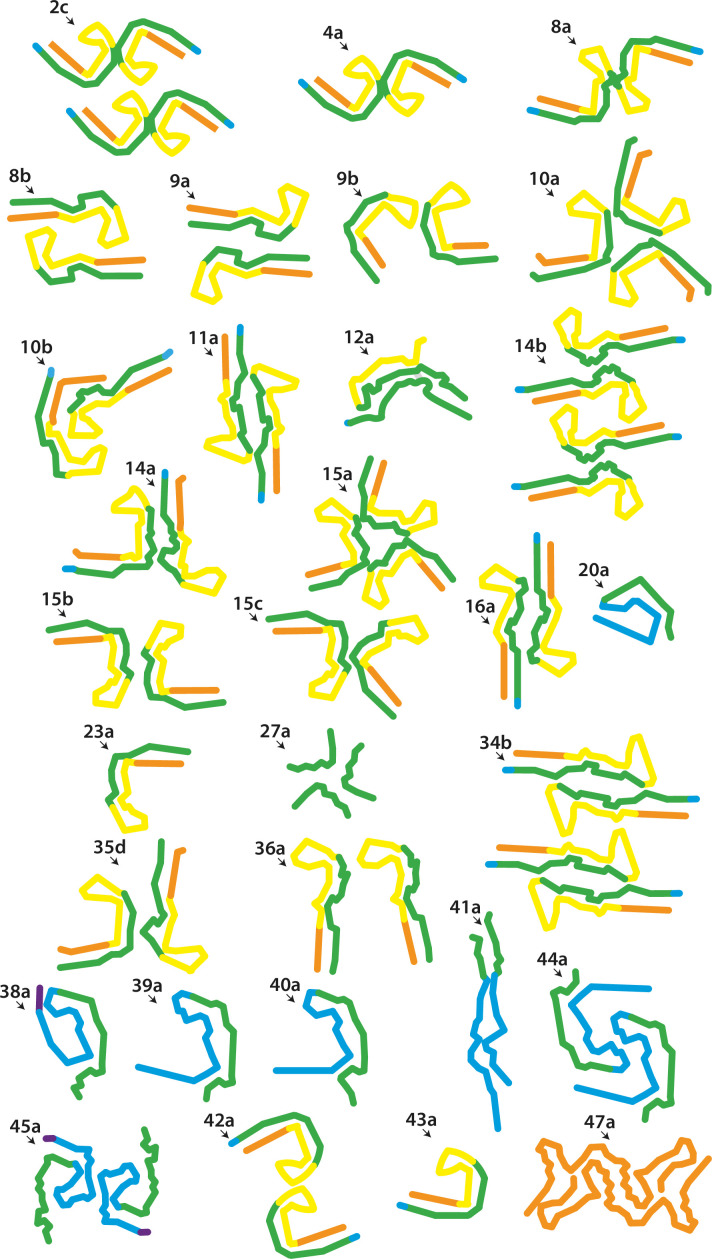
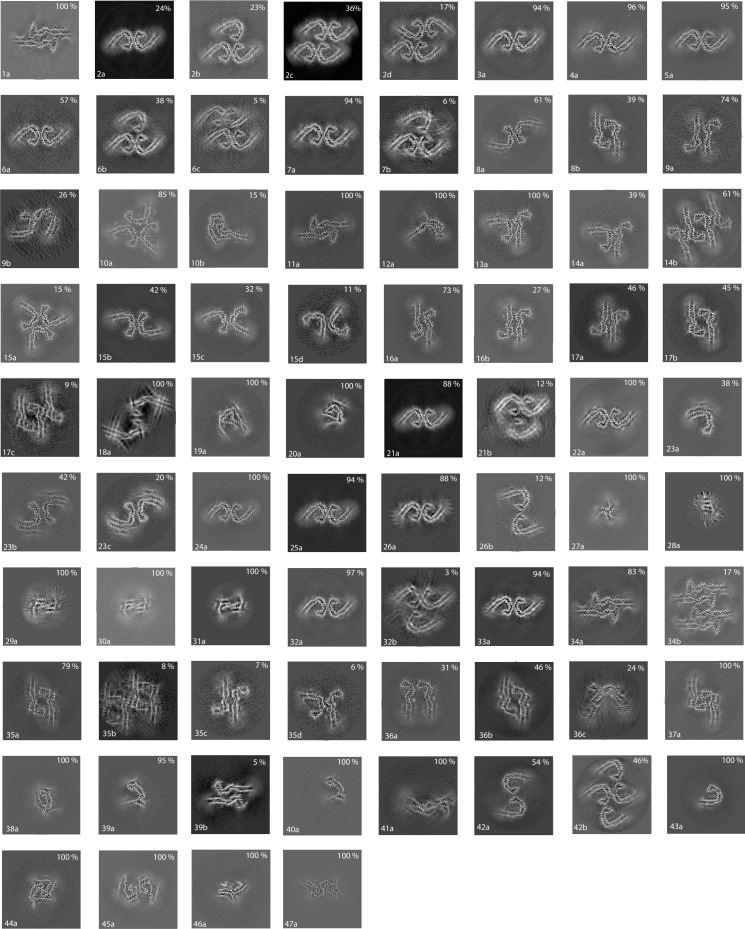
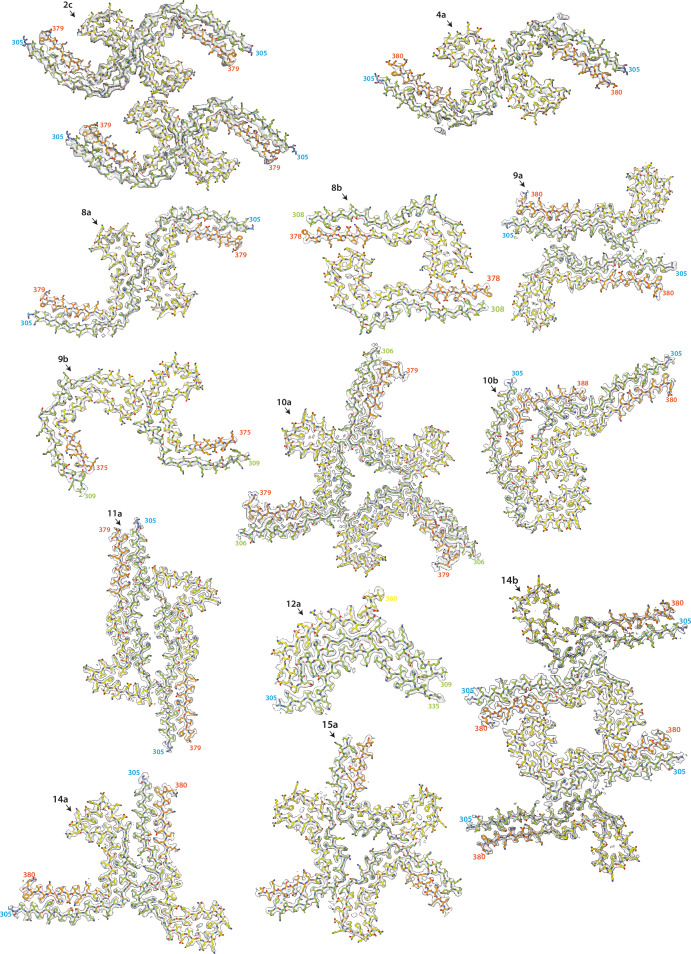
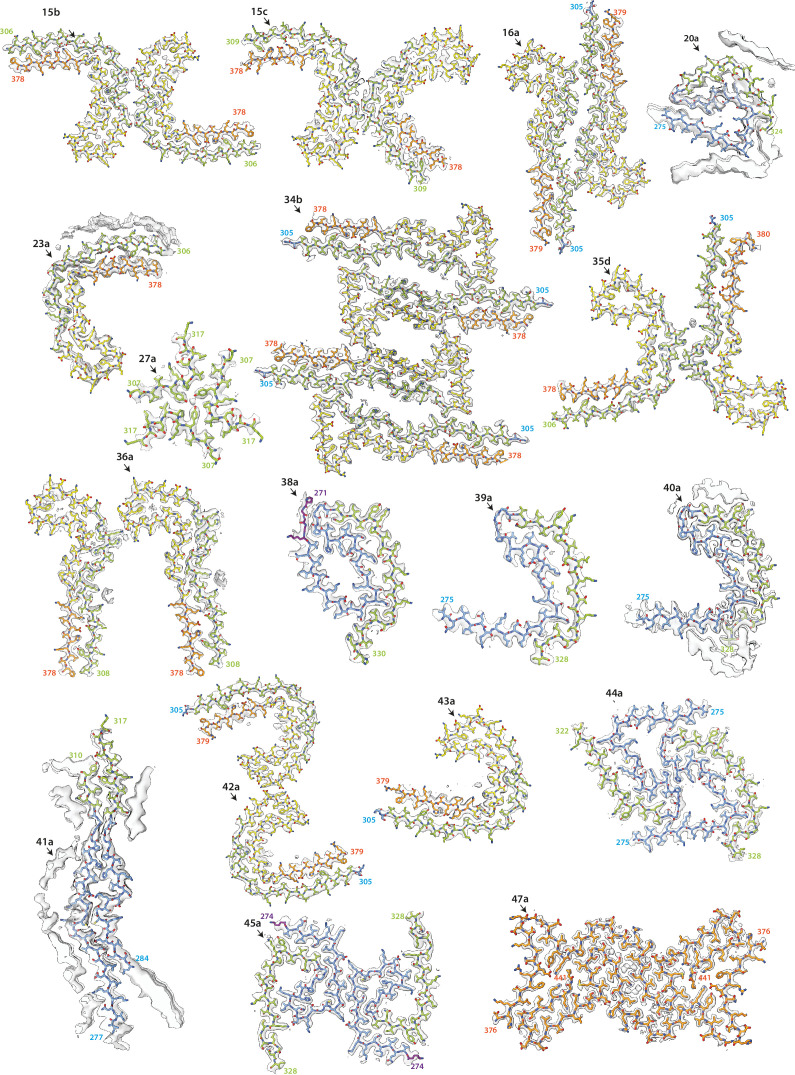
Many neurodegenerative diseases, including Alzheimer’s disease, the most common form of dementia, are characterised by knotted clumps of a protein called tau. In these diseases, tau misfolds, stacks together and forms abnormal filaments, which have a structured core and fuzzy coat. These sticky, misfolded proteins are thought to be toxic to brain cells, the loss of which ultimately causes problems with how people move, think, feel or behave. Reconstructing the shape of tau filaments using an atomic-level imaging technique called electron cryo-microscopy, or cryo-EM, researchers have found distinct types of tau filaments present in certain diseases. In Alzheimer’s disease, for example, a mixture of paired helical and straight filaments is found. Different tau filaments are seen again in chronic traumatic encephalopathy (CTE), a condition associated with repetitive brain trauma. It remains unclear, however, how tau folds into these distinct shapes and under what conditions it forms certain types of filaments. The role that distinct tau folds play in different diseases is also poorly understood. This is largely because researchers making tau proteins in the lab have yet to replicate the exact structure of tau filaments found in diseased brain tissue. Lövestam et al. describe the conditions for making tau filaments in the lab identical to those isolated from the brains of people who died from Alzheimer’s disease and CTE. Lövestam et al. instructed bacteria to make tau protein, optimised filament assembly conditions, including shaking time and speed, and found that bona fide filaments formed from shortened versions of tau. On cryo-EM imaging, the lab-produced filaments had the same left-handed twist and helical symmetry as filaments characteristic of Alzheimer’s disease. Adding salts, however, changed the shape of tau filaments. In the presence of sodium chloride, otherwise known as kitchen salt, tau formed filaments with a filled cavity at the core, identical to tau filaments observed in CTE. Again, this structure was confirmed on cryo-EM imaging. Being able to make tau filaments identical to those found in human tauopathies will allow scientists to study how these filaments form and elucidate what role they play in disease. Ultimately, a better understanding of tau filament formation could lead to improved diagnostics and treatments for neurodegenerative diseases involving tau.


Conflict of interest statement

SL, AM, MG No competing interests declared, FK, Bv, AK is affiliated with Thermo Fisher Scientific. The author has no financial interests to declare, SS Reviewing editor, eLife

Figures

Figure 1.
Figure 1.. New electron cryo-microscopy (cryo-EM) structures.
Backbone traces for filaments with previously unobserved structures. Residues 244–274 (R1) are shown in purple; residues 275–305 (R2) are shown in blue; residues 306–336 (R3) are shown in green; residues 337–368 (R4) are shown in yellow; residues 369–441 (C-terminal domain) are shown in orange. The filament types (as defined in Table 1) are shown at the top left of each structure.
Figure 1—figure supplement 1.
Figure 1—figure supplement 1.. Cross-sections of electron cryo-microscopy (cryo-EM) reconstructions.
Projected slices perpendicular to the helical axis, and with a thickness of approximately 4.7 Å, are shown for all cryo-EM structures described in this paper. For each structure, the filament type (as defined in Table 1) is displayed in the bottom left, and the percentage of a given type in the cryo-EM data set is shown in the top right.
Figure 1—figure supplement 2.
Figure 1—figure supplement 2.. Electron cryo-microscopy (cryo-EM) maps and models of new structures (part 1).
Cryo-EM density maps (grey transparent) and atomic models are shown for filaments with previously unobserved structures. Residues 244–274 (R1) are shown in purple; residues 275–305 (R2) are shown in blue; residues 306–336 (R3) are shown in green; residues 337–368 (R4) are shown in yellow; residues 369–441 (C-terminal domain) are shown in orange. The filament types (as defined in Table 1) are shown at the top left of each structure.
Figure 1—figure supplement 3.
Figure 1—figure supplement 3.. Electron cryo-microscopy (cryo-EM) maps and models of new structures (part 2).
Cryo-EM density maps (grey transparent) and atomic models are shown for filaments with previously unobserved structures. Residues 244–274 (R1) are shown in purple; residues 275–305 (R2) are shown in blue; residues 306–336 (R3) are shown in green; residues 337–368 (R4) are shown in yellow; residues 369–441 (C-terminal domain) are shown in orange. The filament types (as defined in Table 1) are shown at the top left of each structure.
Figure 1—figure supplement 4.
Figure 1—figure supplement 4.. Schematics of the tau folds (part 1).
Negatively charged residues are shown in red, positively charged residues in blue, polar residues in green, non-polar residues in white, sulphur-containing residues in yellow, prolines in purple, and glycines in pink. PHF, paired helical filament; CTE, chronic traumatic encephalopathy.
Figure 1—figure supplement 5.
Figure 1—figure supplement 5.. Schematics of the tau folds (part 2).
Negatively charged residues are shown in red, positively charged residues in blue, polar residues in green, non-polar residues in white, sulphur-containing residues in yellow, prolines in purple, and glycines in pink.
Figure 1—figure supplement 6.
Figure 1—figure supplement 6.. Fourier shell correlation curves (part 1).
FSC curves are shown for two independently refined cryo-microscopy (cryo-EM) half-maps (black); for the final refined atomic model against the final cryo-EM map (red); for the atomic model refined in the first half-map against that half-map (blue); and for the refined atomic model in the first half-map against the second half-map (yellow). The resolutions where the black line drops below 0.143 and the red line drops below 0.5 are indicated. The corresponding filament type (as defined in Table 1) is shown at the top left of each graph. See Supplementary file 1 - Tables 1–25 for further details on data processing.
Figure 1—figure supplement 7.
Figure 1—figure supplement 7.. Fourier shell correlation curves (part 2).
Figure 1—figure supplement 8.
Figure 1—figure supplement 8.. Handedness of structure 41a.
(A) Fourier shell correlation curves for the final refined atomic model against the left-handed map (green) and against the right-handed map (orange). (B) Cryo-microscopy density maps (grey transparent) and atomic models are shown for the left- and right-handed options. (C) Close-up of carbonyls showing a better map-model fit for the left-handed map.
Figure 2.
Figure 2.. Assembly of recombinant tau into filaments like Alzheimer’s disease paired helical filaments (AD PHFs).
(A) Schematic of 2N4R tau sequence with domains highlighted. The regions 1N (44–73), 2N (74–102), P1 (151–197), and P2 (198–243) are shown in increasingly lighter greys; R1 (244–274) is shown in purple; R2 (275–305) is shown in blue; R3 (306–336) is shown in green; R4 (337–368) is shown in yellow; the C-terminal domain (369-441) is shown in orange. (B) Amino acid sequence of residues 244–441 of tau, with the same colour scheme as in A. (C–E:) Projected slices, with a thickness of approximately 4.7 Å, orthogonal to the helical axis for several cryo-microscopy (cryo-EM) reconstructions. The filament types (as defined in Table 1) are shown at the bottom left and the percentages of types for each cryo-EM data set are given at the top right of the images. (C) Conditions of Al-Hilaly et al., 2017, with shaking at 700 rpm. (D) Our adapted protocol, using 200 rpm shaking. From left to right; paired helical filament (PHF), triple helical filament, quadruple helical filament type 1, and quadruple helical filament type 2. (E) Our optimised conditions for in vitro assembly of relatively pure PHFs.( F) Cryo-EM density map (grey transparent) of in vitro assembled tau filaments of type 4a and the atomic model colour coded according as in A. (G) Backbone ribbon of in vitro PHF (grey) overlaid with AD PHF (blue).
Figure 2—figure supplement 1.
Figure 2—figure supplement 1.. Electron cryo-microscopy (cryo-EM) micrographs and density maps comparing in vitro assembled paired helical filaments (PHFs) and Alzheimer’s disease paired helical filaments (AD PHFs).
(A) Cryo-EM micrographs with filaments from in vitro assembly conditions 1 (left), 2 (middle), and 4 (right). Scale bar represents 100 Å.( B) Cryo-EM density maps of in vitro PHF (filament type 4a, EMDB-14063) as top view (top) and side view (bottom). (C). Cryo-EM density maps of AD PHF (EMDB:0259) as top view (top) and side view (bottom). The black arrows point to densities in front of lysines 317 and 321; the green and pink arrows point to densities inside the C-shape.
Figure 3.
Figure 3.. Assembly of recombinant tau into filaments like chronic traumatic encephalopathy (CTE) type II filaments.
(A) Projected slices, with a thickness of approximately 4.7 Å, orthogonal to the helical axis are shown for different assembly conditions and filament types (as defined in Table 1), which are indicated in the bottom left. The percentages of types are shown in the top right of each panel. ( B) Cryo-EM density map (grey transparent) of filament type 8a and the corresponding atomic model with the same colour scheme as in Figure 1. (C–E) Backbone ribbon views of protofilament and filament folds. (C) In vitro NaCl filament type 8a (grey) overlaid with CTE type II (orange). (D) Extended and C-shaped protofilaments aligned at residues 338–354 for LiCl, filament types 9a and 9b (left) and NaCl, filament types 8a and 8b (right). (E) Filament types 8b (NaCl), 9a (LiCl), 10a (KCl), and 4a (MgCl2) aligned at residues 356–364. (F) Atomic view of residues 334–358. The distance between the Cα of L344 and I354 is indicated. Filament types 8a, 8b, 9a, 9b, and 10a are shown in light purple, dark purple, dark orange, light orange, and blue, respectively.
Figure 3—figure supplement 1.
Figure 3—figure supplement 1.. Extended and C-shaped NaCl protofilaments.
(A) Backbone ribbon view of C-shaped (filament type 8a) and extended (filament type 8b) protofilaments formed with NaCl, aligned at residues 338–354. (B–D) Close-up atomic view of regions highlighted in A. (E) Cryo-microscopy density map (transparent grey) and the atomic model at residues 338–354. Filament types 8a and 8b are shown in dark and light orange, respectively.
Figure 3—figure supplement 2.
Figure 3—figure supplement 2.. Extended and C-shaped LiCl protofilaments.
(A) Backbone ribbon view of extended (filament type 9a) and C-shaped (filament type 9b) protofilaments formed with LiCl, aligned at residues 338–354.( B–D) Close-up atomic view of regions highlighted in A. (E) Cryo-microscopy density map (transparent grey) and the atomic model at residues 338–354. Filament types 9a and 9b are shown in light and dark purple, respectively.
Figure 3—figure supplement 3.
Figure 3—figure supplement 3.. Cryo-microscopy (cryo-EM) densities inside the cavities of KCl and NaCl filaments.
(A–H) Cryo-EM density map (transparent grey) and the corresponding atomic models for filament types 7a (assembled with NaCl) and 8a (assembled with KCl) are shown in orange and green, respectively.( A) Cryo-EM density at the tip of the protofilament of 8a with additional non-proteinaceous densities highlighted by arrows. Blue arrows represent putative water molecules; pink arrows represent putative K+ or Cl ions. K+ ions are shown in pink; Cl ions are shown in cyan. (B–D) Close-up view of putative K+ and Cl ion pairs. Distances between K+ and Cl ions, and Oγ of S341 or the carbonyl oxygen of G335 are indicated. (E) Cryo-EM density of the tip of the protofilament of 8a with putative Na+ and Cl ions fitted into the density. Purple arrow represents putative Na+ or Cl ions; Na+ ions are shown in purple; Cl ions are shown in cyan. (F–G) Close-up view of putative Na+ and Cl ions. Distances between the Na+ and Cl ions and the Oγ of S341 are indicated. (H) Cryo-EM density of chronic traumatic encephalopathy type I (EMD:0527), with putative Na+ and Cl ions modelled inside the additional density.
Figure 4.
Figure 4.. The effects of protein length on tau filament assembly.
(A) Schematic representation of 2N4R tau and the constructs used in this study. A red cross indicates that no filaments were formed; an orange dash indicates that filaments with structures distinct from Alzheimer’s disease paired helical filaments (AD PHFs) were formed; a blue circle indicates that the AD protofilament fold was formed; a green tick indicates that AD PHFs were formed. Resulting filament types (as defined in Table 1) are indicated for each experiment. (B) Projected slices, with a thickness of approximately 4.7 Å, orthogonal to the helical axis for the filaments formed with the constructs in A. Filament types are indicated at the bottom left; percentages of filament types in each cryo-EM data set are shown in the top right. (*) 50:50 ratio of 266–391 (3R) and 297–391 (4R) tau.
Figure 4—figure supplement 1.
Figure 4—figure supplement 1.. Comparison of in vitro assembled tau filaments with the globular glial tauopathy (GGT) fold.
(A) Backbone ribbon view of GGT type 1 (PDB:7p66) and tau filaments from in vitro assembled filament types 27a, 28a, 29a, 32a protofilament (PF)1, and 32a PF2, aligned at residues 288–322. (B) Close-up atomic view. 7p66 is shown in grey, 27a in green, 28a in pink, 29a in orange, 32a PF-1 in blue, and 32a PF-2 in purple.
Figure 4—figure supplement 2.
Figure 4—figure supplement 2.. Coomassie stained sodium dodecyl-sulfate polyacrylamide gel electrophoresis (SDS-PAGE) gel for constructs 297–391, 297–408, and 296–441 before and after filament assembly.
About 3.5 μg of protein was loaded into each well. f: after filament assembly; *: constructs with the four-phospho-mimetic mutations: S396D, S400D, T403D, and S404D.

Similar articles

Cited by

References

    1. Abraha A, Ghoshal N, Gamblin TC, Cryns V, Berry RW, Kuret J, Binder LI. C-terminal inhibition of tau assembly in vitro and in Alzheimer’s disease. Journal of Cell Science. 2000;113:3737–3745. doi: 10.1242/jcs.113.21.3737. - DOI - PubMed
    1. Al-Hilaly YK, Pollack SJ, Vadukul DM, Citossi F, Rickard JE, Simpson M, Storey JMD, Harrington CR, Wischik CM, Serpell LC. Alzheimer’s Disease-like Paired Helical Filament Assembly from Truncated Tau Protein Is Independent of Disulfide Crosslinking. Journal of Molecular Biology. 2017;429:3650–3665. doi: 10.1016/j.jmb.2017.09.007. - DOI - PubMed
    1. Al-Hilaly YK, Foster BE, Biasetti L, Lutter L, Pollack SJ, Rickard JE, Storey JMD, Harrington CR, Xue WF, Wischik CM, Serpell LC. Tau (297-391) forms filaments that structurally mimic the core of paired helical filaments in Alzheimer’s disease brain. FEBS Letters. 2020;594:944–950. doi: 10.1002/1873-3468.13675. - DOI - PMC - PubMed
    1. Arakhamia T, Lee CE, Carlomagno Y, Kumar M, Duong DM, Wesseling H, Kundinger SR, Wang K, Williams D, DeTure M, Dickson DW, Cook CN, Seyfried NT, Petrucelli L, Steen JA, Fitzpatrick AWP. Posttranslational Modifications Mediate the Structural Diversity of Tauopathy Strains. Cell. 2021;184:6207–6210. doi: 10.1016/j.cell.2021.11.029. - DOI - PMC - PubMed
    1. Arseni D, Hasegawa M, Murzin AG, Kametani F, Arai M, Yoshida M, Ryskeldi-Falcon B. Structure of pathological TDP-43 filaments from ALS with FTLD. Nature. 2022;601:139–143. doi: 10.1038/s41586-021-04199-3. - DOI - PMC - PubMed

Publication types

MeSH terms