. 2022 Mar 4:11:e73093.
doi: 10.7554/eLife.73093.

Structural dynamics determine voltage and pH gating in human voltage-gated proton channel

Affiliations

Structural dynamics determine voltage and pH gating in human voltage-gated proton channel

Shuo Han et al. Elife. .

Abstract

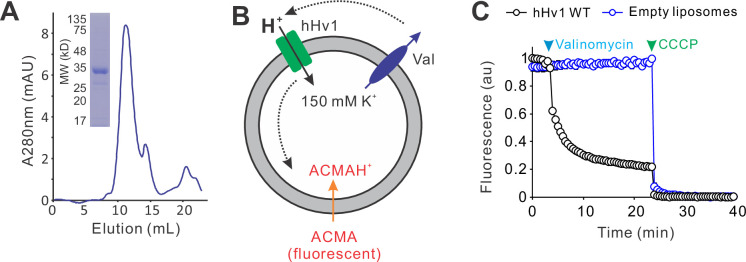
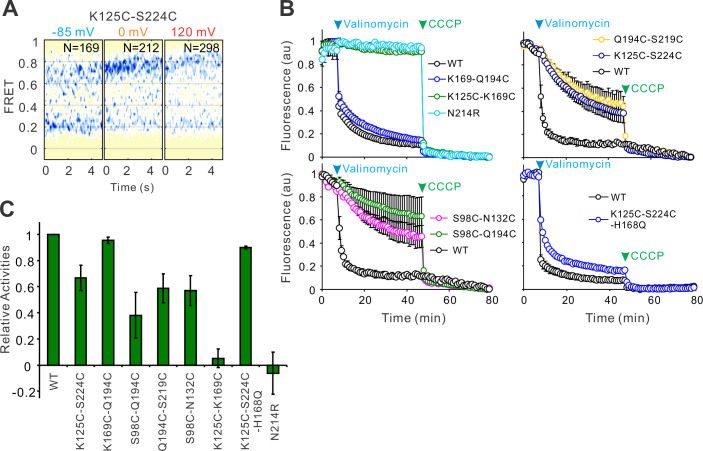
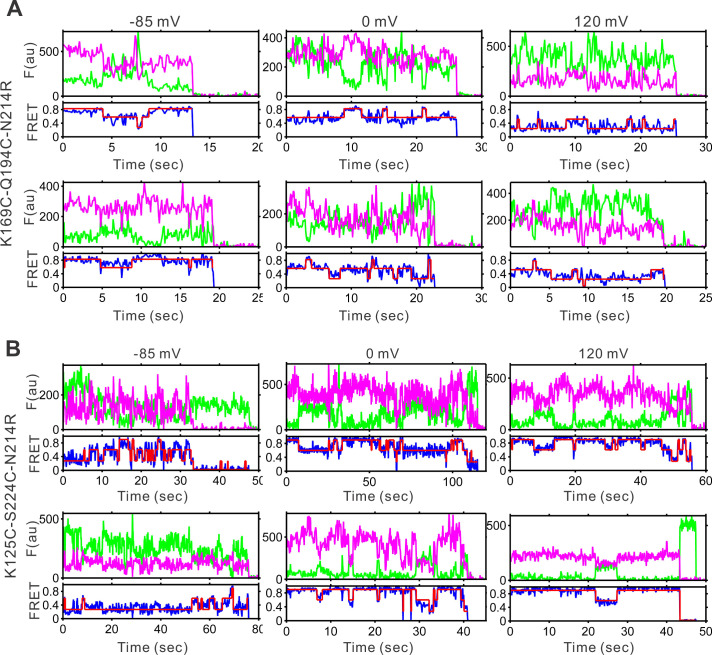
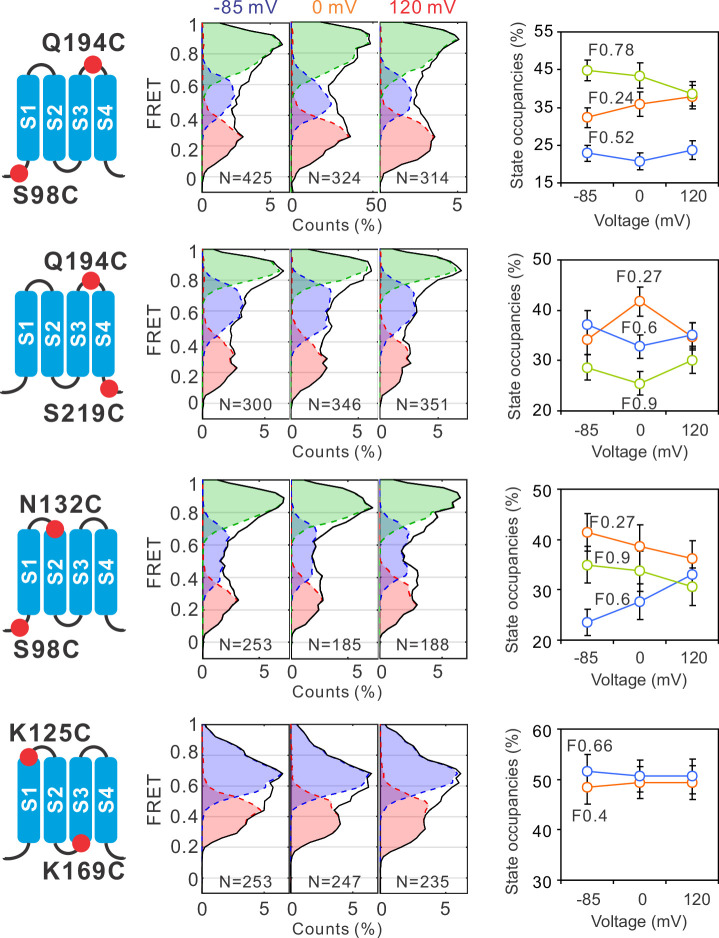
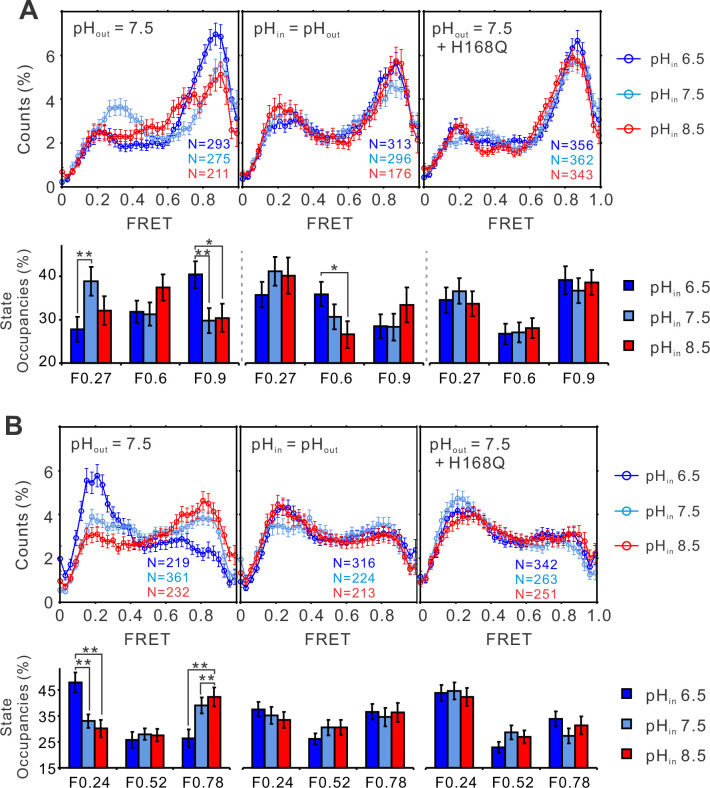
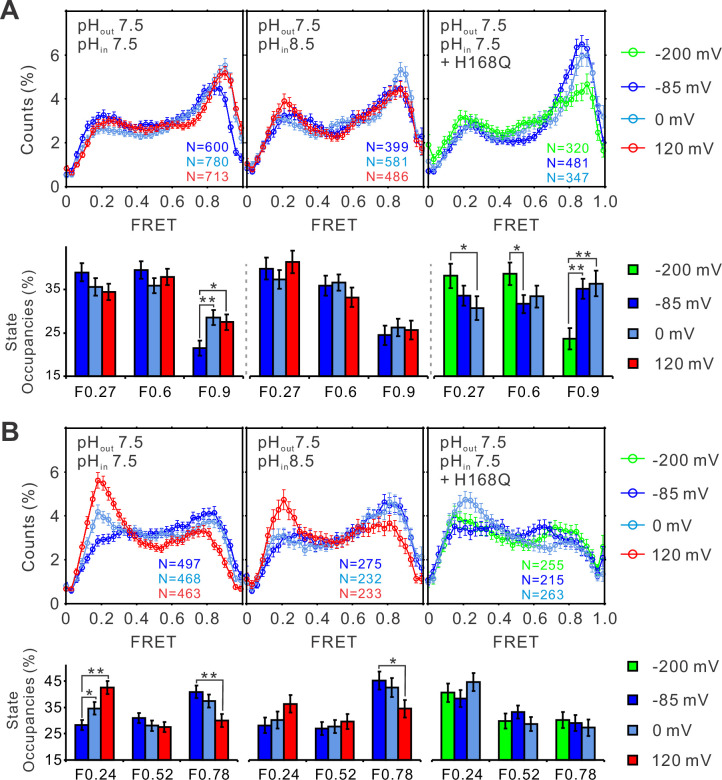
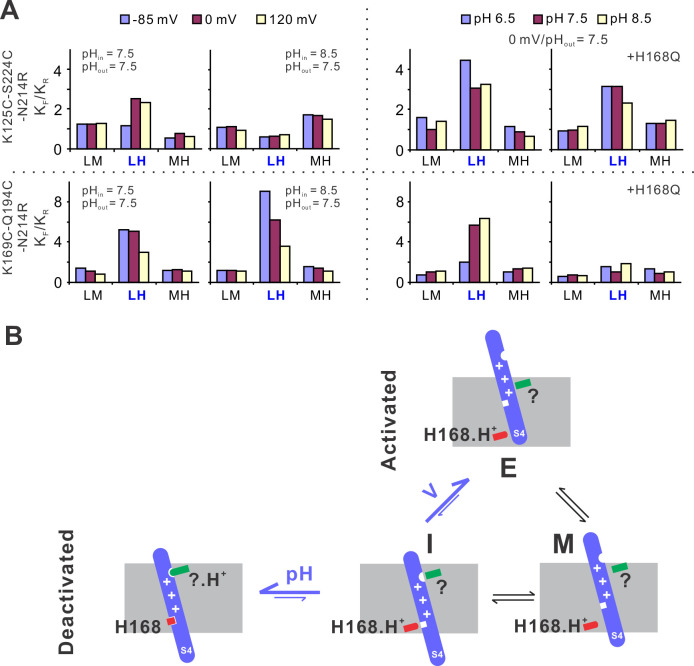
Voltage-gated proton (Hv) channels are standalone voltage sensors without separate ion conductive pores. They are gated by both voltage and transmembrane proton gradient (i.e., ∆pH), serving as acid extruders in most cells. Like the canonical voltage sensors, Hv channels are a bundle of four helices (named S1 -S4), with the S4 segment carrying three positively charged Arg residues. Extensive structural and electrophysiological studies on voltage-gated ion channels, in general, agree on an outwards movement of the S4 segment upon activating voltage, but the real-time conformational transitions are still unattainable. With purified human voltage-gated proton (hHv1) channels reconstituted in liposomes, we have examined its conformational dynamics, including the S4 segment at different voltage and pHs using single-molecule fluorescence resonance energy transfer (smFRET). Here, we provide the first glimpse of real-time conformational trajectories of the hHv1 voltage sensor and show that both voltage and pH gradient shift the conformational dynamics of the S4 segment to control channel gating. Our results indicate that the S4 segment transits among three major conformational states and only the transitions between the inward and outward conformations are highly dependent on voltage and pH. Altogether, we propose a kinetic model that explains the mechanisms underlying voltage and pH gating in Hv channels, which may also serve as a general framework for understanding the voltage sensing and gating in other voltage-gated ion channels.

Keywords: E. coli; human; ion channel; membrane protein; molecular biophysics; proton channel; single-molecule FRET; structural biology; structural dynamics; voltage gating.


Conflict of interest statement

SH, SP, JV, KT, ND, NB, ZG, SW No competing interests declared

Figures

Figure 1.
Figure 1.. The voltage-dependent conformation dynamics of the hHv1 channel S4 segment revealed by smFRET.
(A) Left panel, the cartoon of the hHv1 NMR structure (5oqk). The K125-S224 (blue) and K169-Q194C (red) labeling sites were highlighted by spheres; right panel, the sample immobilization configuration for smFRET imaging. The PEG passivated surface with 2% PEG-biotin (Btn-Peg) binds the biotinylated anti-Histag antibodies (Btn-HisAb) via neutravidin (NA), then the hHv1 liposomes with N-terminal 6*Histag (6×His) facing the outside were selectively retained for smFRET imaging. The liposome voltages were controlled by the K+ gradient across liposomes in the presence of K+ ionophore valinomycin (Val). Representative smFRET traces between the K169C-Q194C (B) and K125C-224C (D) labeling sites under −85 mV (resting), 0 mV (weak), and 120 mV (strong activating) voltages. The green and pink lines are donor and acceptor fluorescence intensities; the blue and red lines are the real and idealized FRET. FRET histograms and state occupancies of the smFRET data from the K169C-Q194C (C) and K125C-224C (E) labeling sites under different voltages. State occupancy data presented as mean ± SE, N is the number of smFRET traces. Unpaired t-tests were performed to examine significance levels of voltage-induced FRET state occupancy changes, in comparison to the occupancy of the same FRET state at −85 mV, with * and ** indicating p < 0.05 and p < 0.01. (F) The structure model used for kinetic analysis of smFRET traces, contains four FRET states, including low (FL), medium (FM), high (FH), and bleaching/blinking states (FB). However, the occupancies of the FB state are extremely low and the transitions to the FB state are very rare at all labeling sites and voltage/pH conditions, therefore the FB state was ignored in the following kinetic analyses. Transition density plots from the smFRET data at the K169C-Q194C (G) and K125C-224C (H) labeling sites under different voltages.
Figure 1—figure supplement 1.
Figure 1—figure supplement 1.. The purified hHv1 protein functions as a proton channel.
(A) Sodium dodecyl sulfate–polyacrylamide gel electrophoresis (SDS–PAGE) and size-exclusion chromatography profiles of the hHv1 channel WT protein expressed and purified from E. coli host cells. (B) The liposome fluorescence flux assay to determine channel activities of the hHv1 channel. The liposome voltage is generated by the K+ gradient across the liposomes in the presence of K+ ionophore valinomycin (Val). Proton uptake through the hHv1 channel into liposomes quenches the ACMA fluorescences. (C) Liposome flux assay of the proton uptake mediated by hHv1 channel reconstituted into liposomes (POPE/POPG = 3/1, protein/lipid = 1/200, wt/wt). Data presented as mean ± SE, n = 3. The arrows mark the time points when 0.45 µM valinomycin (blue) and 1 µM CCCP (green) were added.
Figure 1—figure supplement 2.
Figure 1—figure supplement 2.. The N214R mutation abolishes hHv1 channel proton inhibition by preventing proton uptake into the liposomes.
(A) Contour maps of the single-molecule fluorescence resonance energy transfer (smFRET) data between the hHv1 K125C-S224C sites on the WT background at different voltages. (B) The liposome flux assays of hHv1 protein samples for smFRET studies. The fluorophore-labeled protein samples for smFRET studies, except for WT and N214R mutant, were reconstituted into liposomes (POPE/POPG = 3/1) at a protein lipid ratio of 1:200 (wt/wt). The arrows mark the time points when the 0.45 µM valinomycin (blue) and 1 µM CCCP (green) were added. Data presented as mean ± SE, n = 3. (C) Relative channel activities of the fluorophore-labeled hHv1 mutant proteins subjected to smFRET studies, without the N214R mutation, determined by liposome flux assay. All liposome flux assay data were normalized by the WT hHv1 liposome samples of the same batch. Data presented as mean ± SE, n = 3.
Figure 1—figure supplement 3.
Figure 1—figure supplement 3.. The voltage-induced conformational changes of the hHv1 channels revealed by single-molecule fluorescence resonance energy transfer (smFRET).
(A) FRET contour maps of the K169C-Q194C and K125C-S224C labeling sites on the N214R mutation background at different voltages. N is the number of traces. (B) SSE (sum of squared errors) for 1–5 Gaussian fits to FRET histograms of the K169C-Q194C and K125C-S224C labeling sites.
Figure 1—figure supplement 4.
Figure 1—figure supplement 4.. Representative single-molecule fluorescence resonance energy transfer (smFRET) traces of the K169C-Q194C.
(A) And K125C-S224C (B) Labeling sites on the N214R mutation background at different voltages. The green and pink lines are donor and acceptor fluorescence intensities, the blue and red lines are the real and idealized FRET.
Figure 2.
Figure 2.. Global conformational changes of hHv1 channels driven by voltages.
FRET histograms and state occupancies were calculated from the single-molecule fluorescence resonance energy transfer (smFRET) data at the S98C-Q194C, Q194C-S219C, S98C-N132C, and K125C-K169C labe−ling sites on the N214R background. All data were analyzed with the four state kinetic model as shown in Figure 1F, except for the K125C-K169C sites with a three state kinetic model containing F0.66, F0.4, and the FB state for bleaching/blinking events. The state occupancy data presented as mean ± SE, N is the number of smFRET traces. Unpaired t-tests were performed to examine the significance levels of voltage-induced FRET state occupancy changes, in comparison to the occupancy of the same FRET state at −85 mV, but none of these changes reached the significant level of p<0.05.
Figure 3.
Figure 3.. The structural dynamics of the S4 segment are pH dependent.
FRET histograms and state occupancies of the single-molecule fluorescence resonance energy transfer (smFRET) data from the K125C-S224C (A), K169C-Q194C (B) of the hHv1 channels on the N214R mutation background, in liposomes under 0 mV with asymmetrical (left and right panels), symmetrical (middle) pHs on the WT (left, middle panels), or H168Q mutation backgrounds. State occupancy data presented as mean ± SE, N is the number of smFRET traces. Unpaired t-tests were performed to examine the significance levels of pH-induced FRET state occupancy changes, in comparison to the occupancy of the same FRET state at pH 6.5, with * and ** indicating p < 0.05 and p < 0.01.
Figure 4.
Figure 4.. The structural dynamics of the S4 segment are determined by voltage–pH interplay.
FRET histograms and state occupancies of the single-molecule fluorescence resonance energy transfer (smFRET) data from the K125C-S224C (A) and K169C-Q194C (B) labeling sites of the hHv1 channels with N214R mutation at different voltage/pH conditions on the WT (left, middle panels) and H168Q mutation backgrounds (right panels). State occupancy data presented as mean ± SE, N is the number of smFRET traces. Unpaired t-tests were performed to examine the significance levels of voltage-induced FRET state occupancy changes, in comparison to the occupancy of the same FRET state at −85 or −200 mV on the H168Q mutation background, with * and ** indicating p < 0.05 and p < 0.01.
Figure 5.
Figure 5.. The structural basis underlying voltage–pH gating of hHv1 channels.
(A) Voltage- and pH-dependent changes in equilibrium constants (Keq), as the ratio of forward (KF) and reverse (KR) transition rates. The transition rates were calculated from the single-molecule fluorescence resonance energy transfer (smFRET) traces at different voltage/pH conditions idealized using the Maximum Point Likelihood (MPL) algorithm with the 4 FRET state kinetic model. (B) The structural model to explain the voltage and pH gating in hHv1 channels. The S4 segment of hHv1 channels has three distinct conformations according to their positions in membranes, that is the intracellular (I), middle (M), and extracellular (E) conformations. The I conformation has two populations with one interacting with the intracellular (H168) and/or extracellular pH sensors (?), directly or indirectly, depending on their protonation states. Decoupling of the S4 segment from pH sensors allows the spontaneous transitions toward the M and E conformations, with activating voltage mainly shifting the equilibrium of I–E transitions.
Author response image 1.
Author response image 2.
Author response image 3.

Similar articles

Cited by

References

    1. Aitken CE, Marshall RA, Puglisi JD. An oxygen scavenging system for improvement of dye stability in single-molecule fluorescence experiments. Biophysical Journal. 2008;94:1826–1835. doi: 10.1529/biophysj.107.117689. - DOI - PMC - PubMed
    1. Bayrhuber M, Maslennikov I, Kwiatkowski W, Sobol A, Wierschem C, Eichmann C, Frey L, Riek R. Nuclear Magnetic Resonance Solution Structure and Functional Behavior of the Human Proton Channel. Biochemistry. 2019;58:4017–4027. doi: 10.1021/acs.biochem.9b00471. - DOI - PubMed
    1. Carmona EM, Larsson HP, Neely A, Alvarez O, Latorre R, Gonzalez C. Gating charge displacement in a monomeric voltage-gated proton (Hv1) channel. PNAS. 2018;115:9240–9245. doi: 10.1073/pnas.1809705115. - DOI - PMC - PubMed
    1. Carmona EM. The voltage sensor is responsible for DeltapH dependence in Hv1 channels. PNAS. 2021;118:56118. doi: 10.1073/pnas.2025556118. - DOI - PMC - PubMed
    1. Cherny VV, Markin VS, DeCoursey TE. The voltage-activated hydrogen ion conductance in rat alveolar epithelial cells is determined by the pH gradient. The Journal of General Physiology. 1995;105:861–896. doi: 10.1085/jgp.105.6.861. - DOI - PMC - PubMed

Publication types