

Assessment of Structural Barriers and Racial Group Disparities of COVID-19 Mortality With Spatial Analysis
- PMID: 35244703
- PMCID: PMC8897755
- DOI: 10.1001/jamanetworkopen.2022.0984
Assessment of Structural Barriers and Racial Group Disparities of COVID-19 Mortality With Spatial Analysis
Erratum in
-
Error in the Abstract and Methods.JAMA Netw Open. 2022 Apr 1;5(4):e2212488. doi: 10.1001/jamanetworkopen.2022.12488. JAMA Netw Open. 2022. PMID: 35467739 Free PMC article. No abstract available.
Abstract
Importance: Although social determinants of health (SDOH) are important factors in health inequities, they have not been explicitly associated with COVID-19 mortality rates across racial and ethnic groups and rural, suburban, and urban contexts.
Objectives: To explore the spatial and racial disparities in county-level COVID-19 mortality rates during the first year of the pandemic.
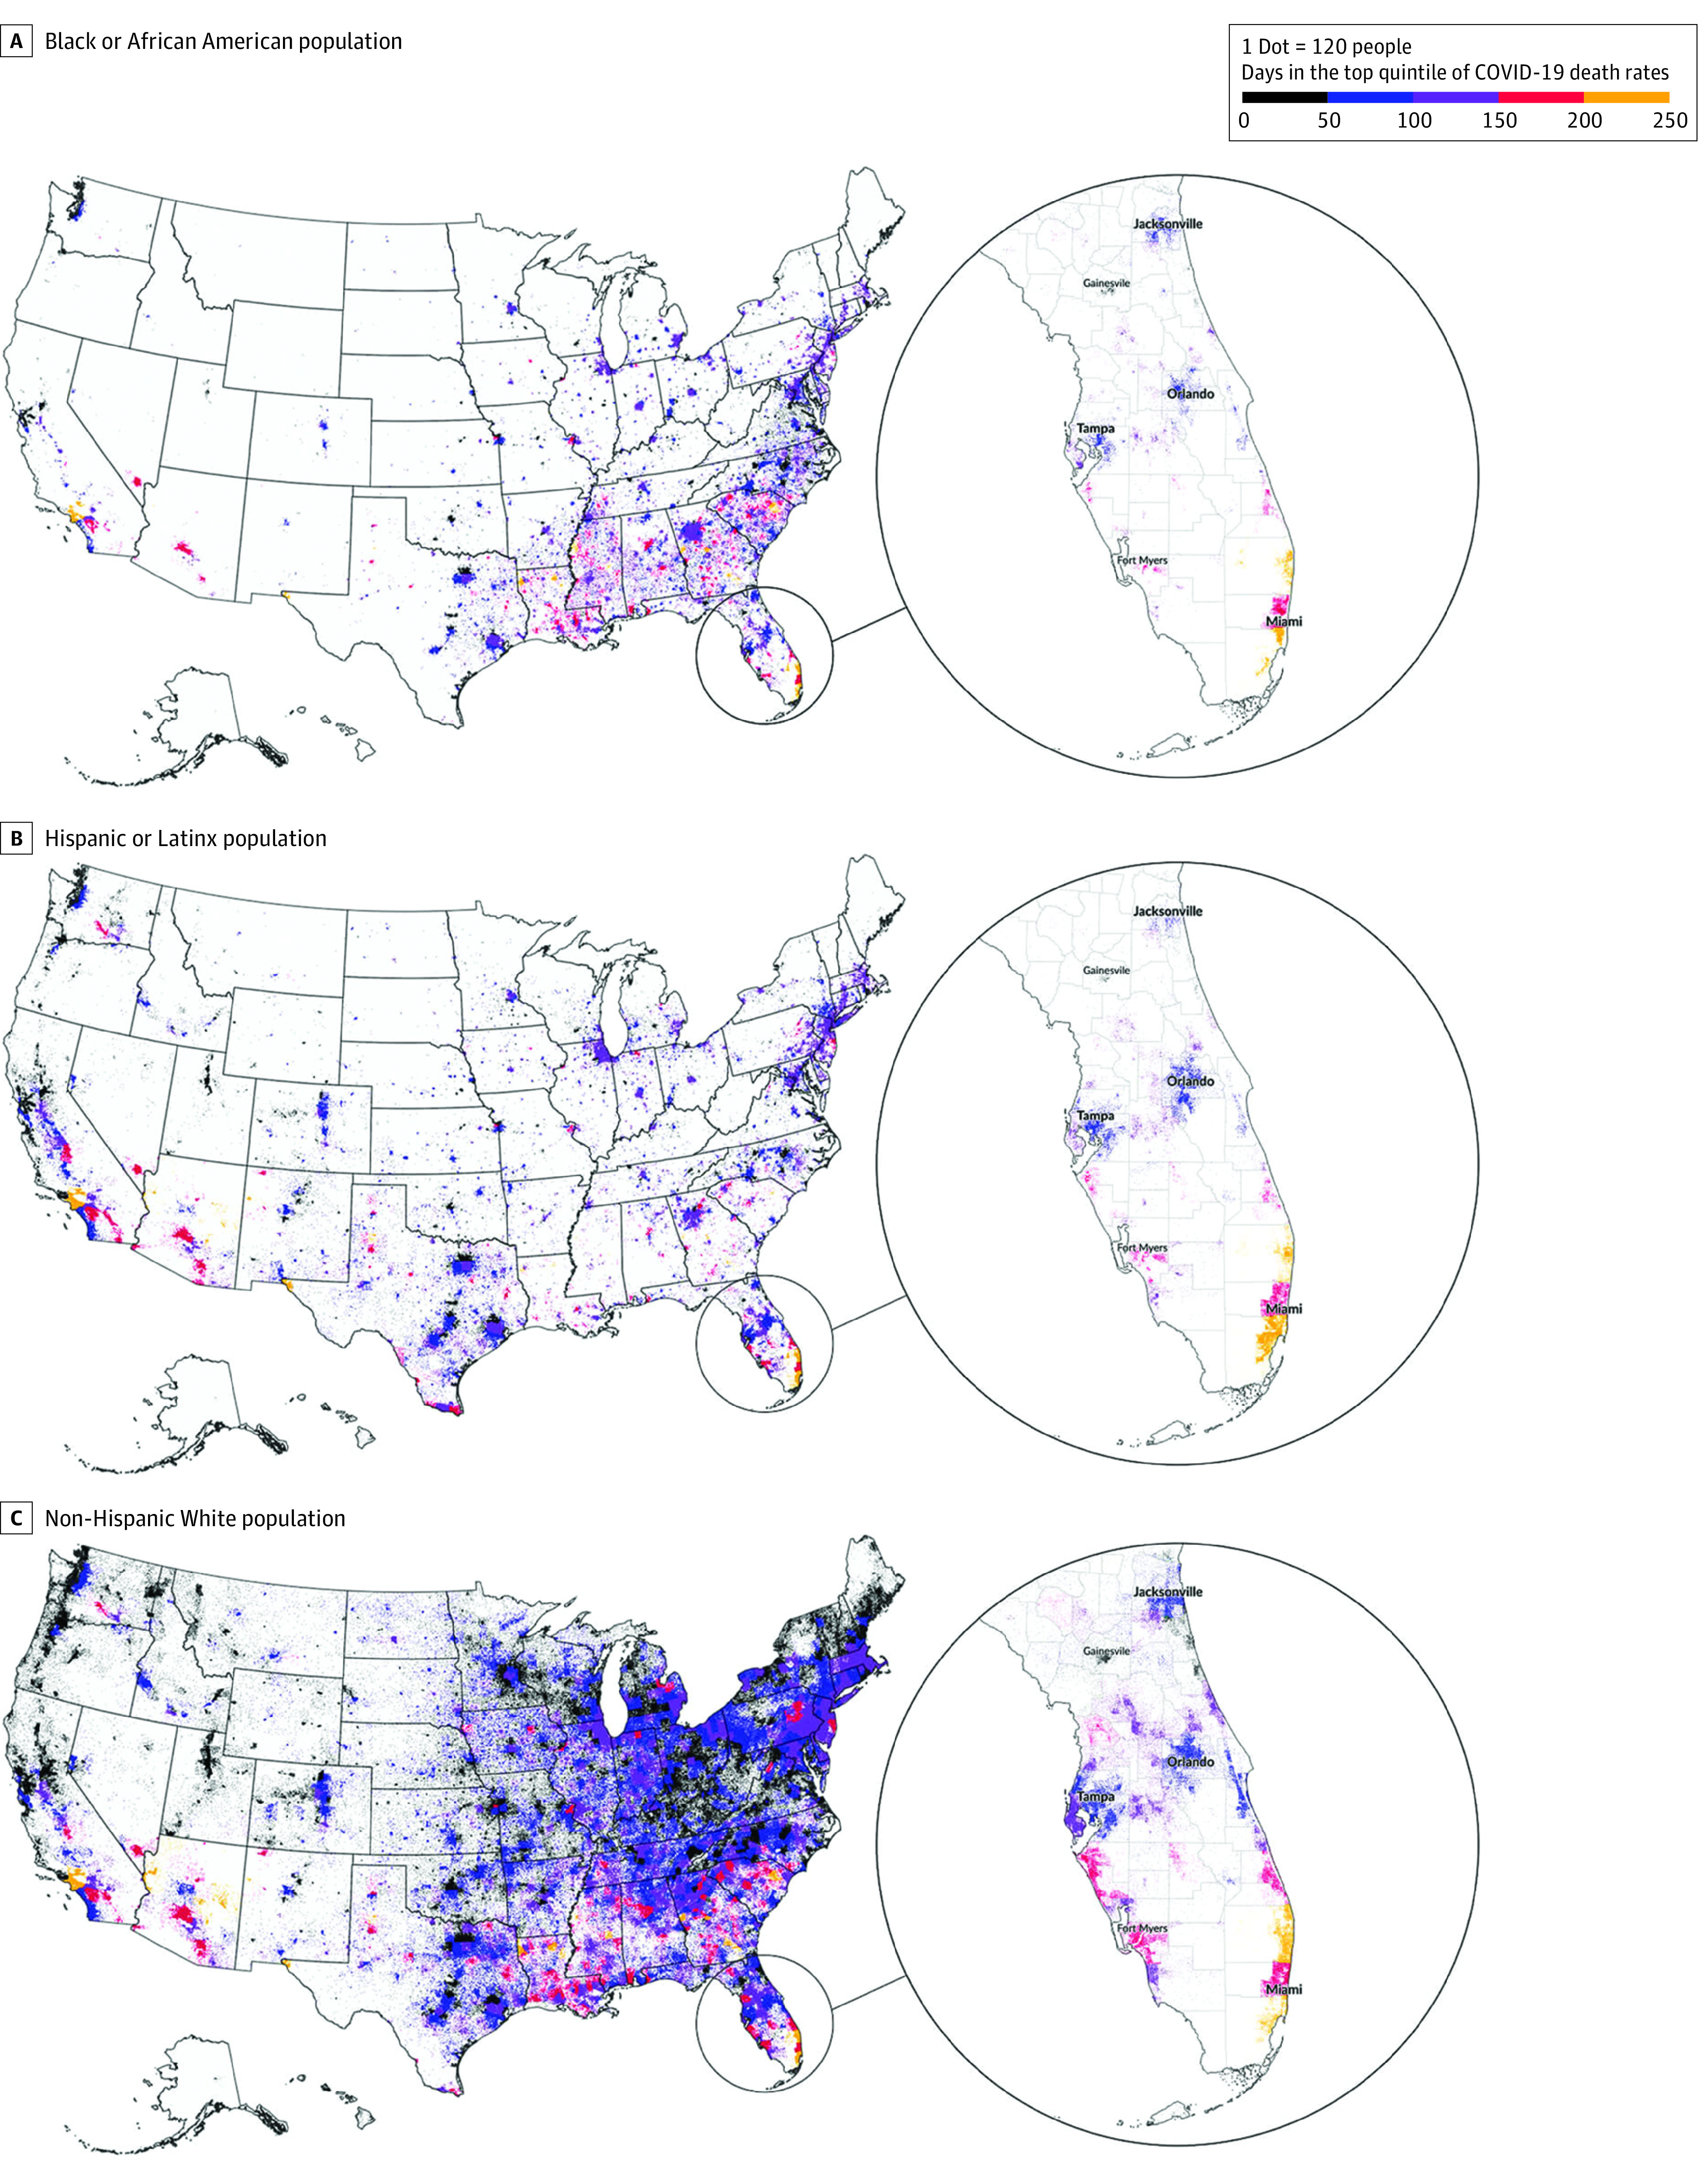
Design, setting, and participants: This cross-sectional study analyzed data for all US counties in 50 states and the District of Columbia for the first full year of the COVID-19 pandemic (January 22, 2020, to February 28, 2021). Counties with a high concentration of a single racial and ethnic population and a high level of COVID-19 mortality rate were identified as concentrated longitudinal-impact counties. The SDOH that may be associated with mortality rate across these counties and in urban, suburban, and rural contexts were examined. The 3 largest racial and ethnic groups in the US were selected: Black or African American, Hispanic or Latinx, and non-Hispanic White populations.
Exposures: County-level characteristics and community health factors (eg, income inequality, uninsured rate, primary care physicians, preventable hospital stays, severe housing problems rate, and access to broadband internet) associated with COVID-19 mortality.
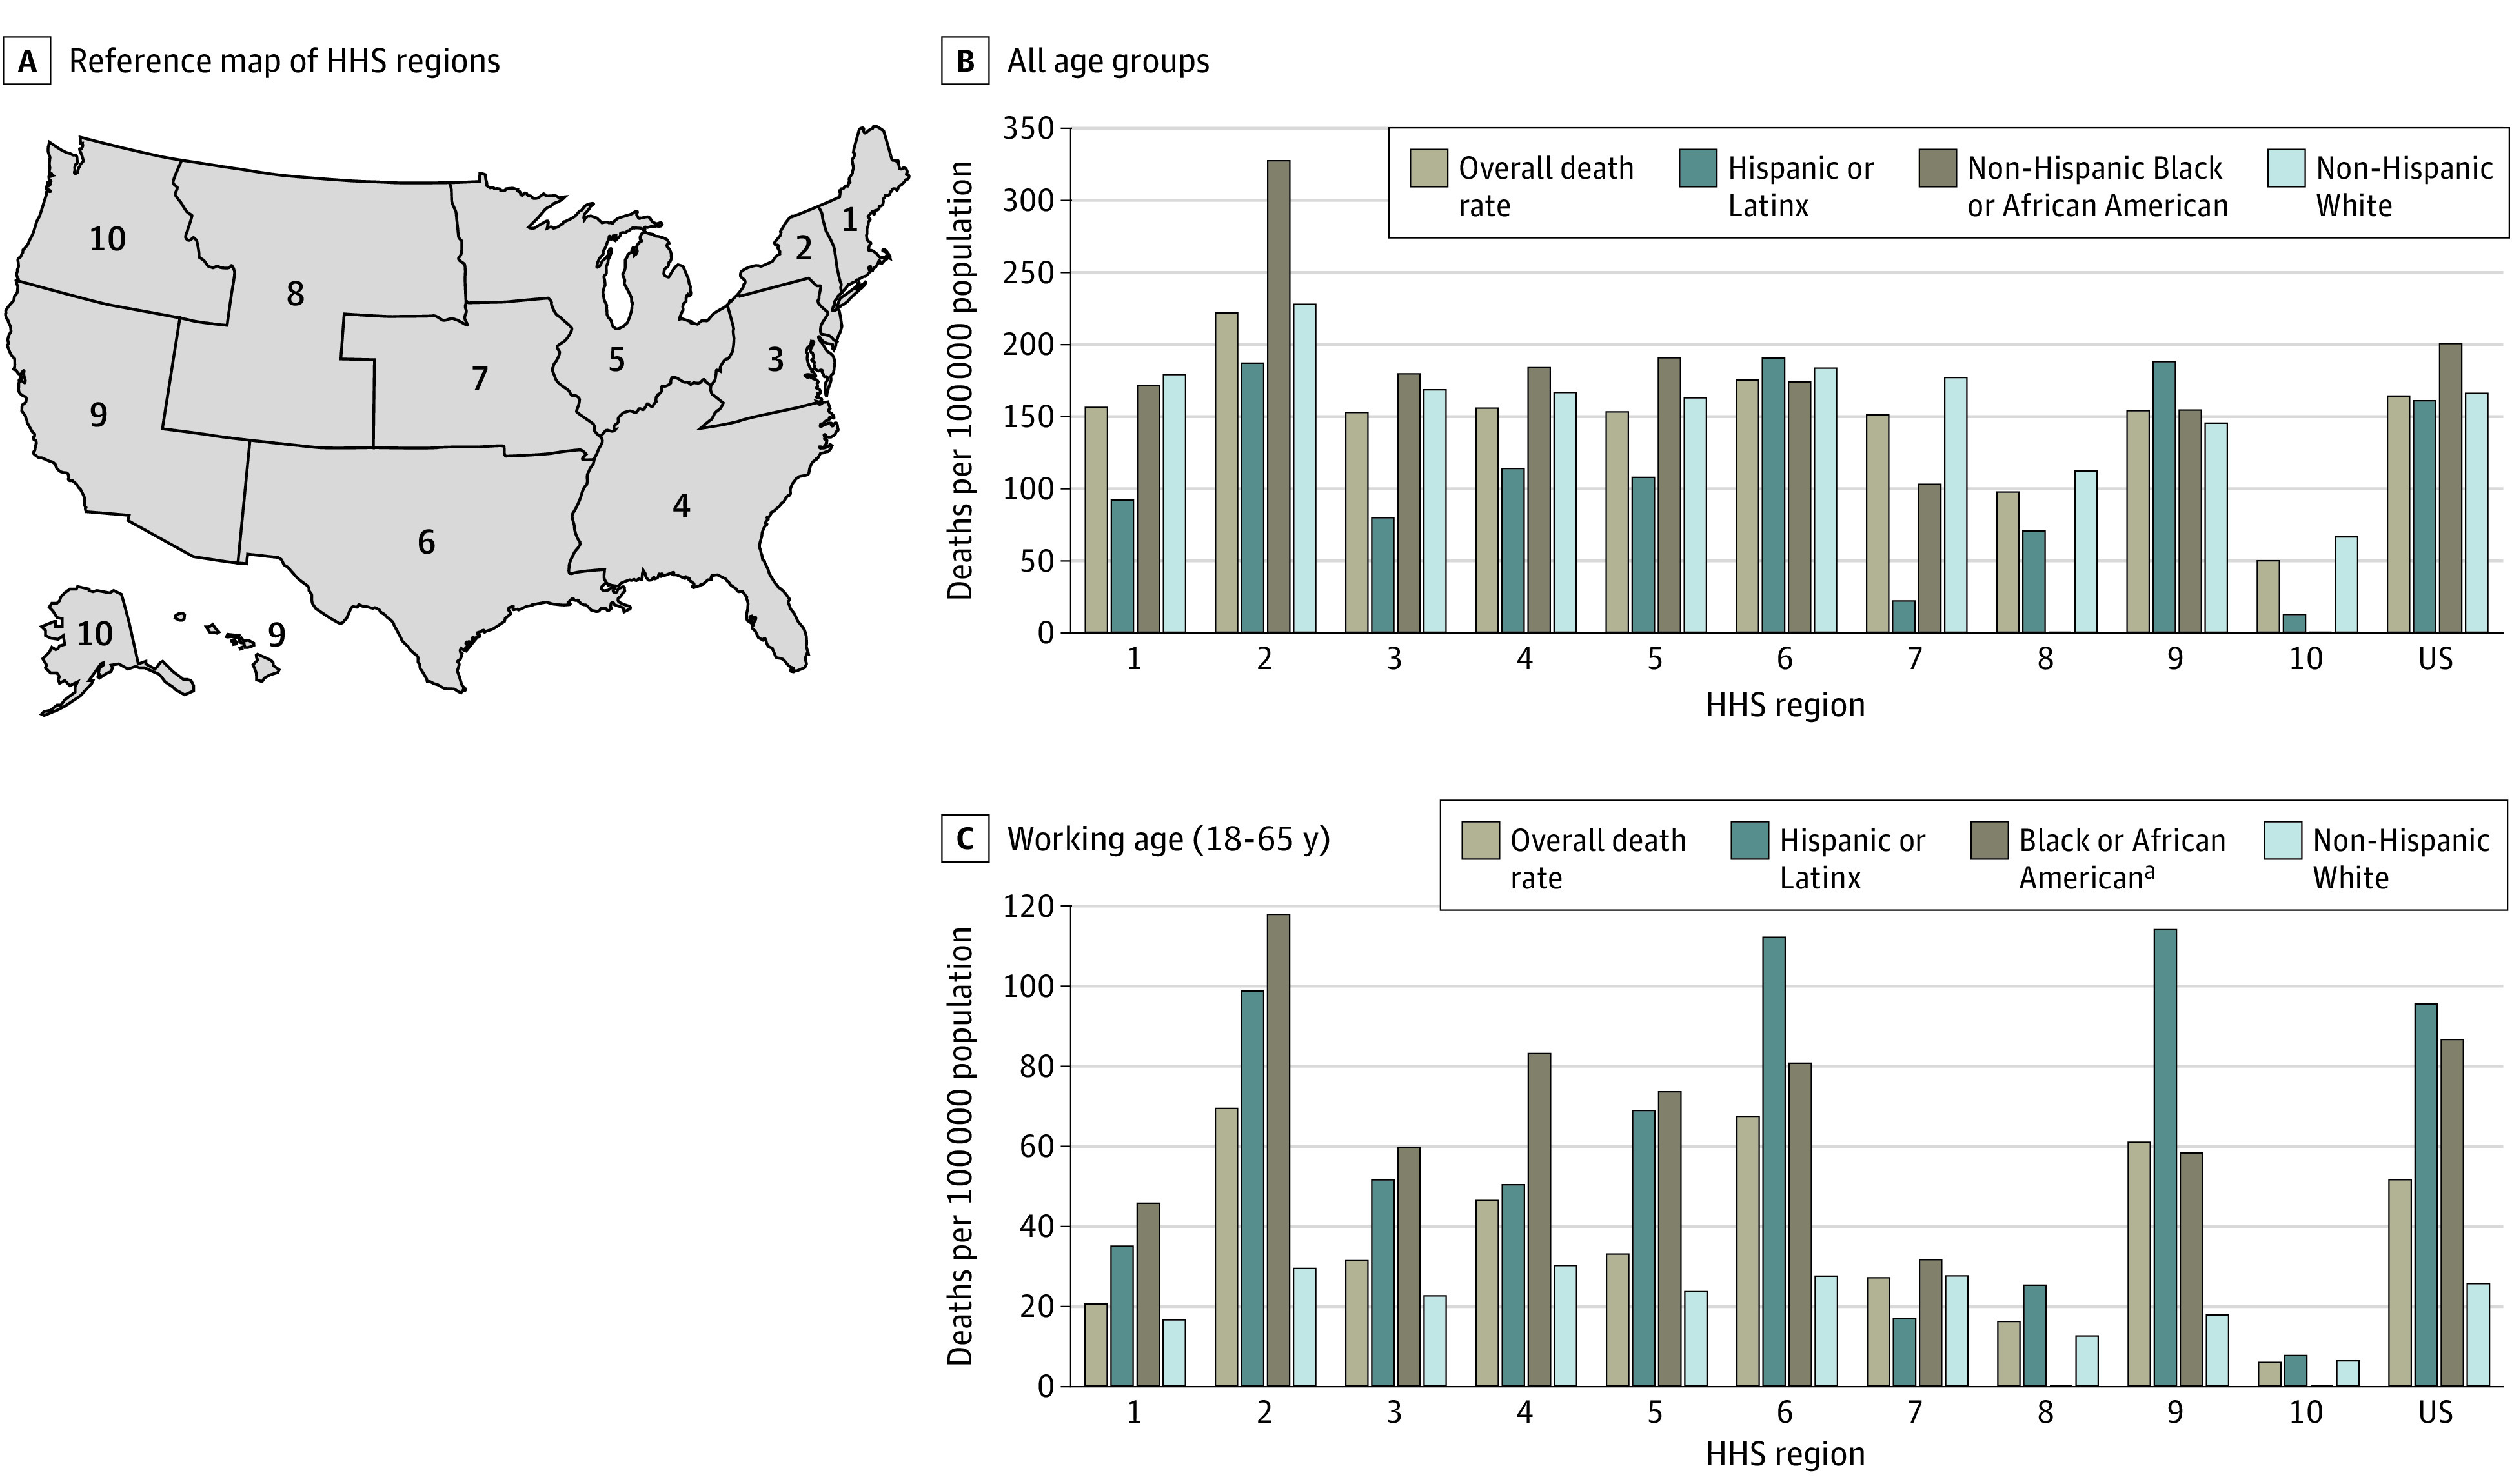
Main outcomes and measures: Data on county-level COVID-19 mortality rates (deaths per 100 000 population) reported by the US Centers for Disease Control and Prevention were analyzed. Four indexes were used to measure multiple dimensions of SDOH: socioeconomic advantage index, limited mobility index, urban core opportunity index, and mixed immigrant cohesion and accessibility index. Spatial regression models were used to examine the associations between SDOH and county-level COVID-19 mortality rate.
Results: Of the 3142 counties included in the study, 531 were identified as concentrated longitudinal-impact counties. Of these counties, 347 (11.0%) had a large Black or African American population compared with other counties, 198 (6.3%) had a large Hispanic or Latinx population compared with other counties, and 33 (1.1%) had a large non-Hispanic White population compared with other counties. A total of 489 254 COVID-19-related deaths were reported. Most concentrated longitudinal-impact counties with a large Black or African American population compared with other counties were spread across urban, suburban, and rural areas and experienced numerous disadvantages, including higher income inequality (297 of 347 [85.6%]) and more preventable hospital stays (281 of 347 [81.0%]). Most concentrated longitudinal-impact counties with a large Hispanic or Latinx population compared with other counties were located in urban areas (114 of 198 [57.6%]), and 130 (65.7%) of these counties had a high percentage of people who lacked health insurance. Most concentrated longitudinal-impact counties with a large non-Hispanic White population compared with other counties were in rural areas (23 of 33 [69.7%]), included a large group of older adults (26 of 33 [78.8%]), and had limited access to quality health care (24 of 33 [72.7%]). In urban areas, the mixed immigrant cohesion and accessibility index was inversely associated with COVID-19 mortality (coefficient [SE], -23.38 [6.06]; P < .001), indicating that mortality rates in urban areas were associated with immigrant communities with traditional family structures, multiple accessibility stressors, and housing overcrowding. Higher COVID-19 mortality rates were also associated with preventable hospital stays in rural areas (coefficient [SE], 0.008 [0.002]; P < .001) and higher socioeconomic status vulnerability in suburban areas (coefficient [SE], -21.60 [3.55]; P < .001). Across all community types, places with limited internet access had higher mortality rates, especially in urban areas (coefficient [SE], 5.83 [0.81]; P < .001).
Conclusions and relevance: This cross-sectional study found an association between different SDOH measures and COVID-19 mortality that varied across racial and ethnic groups and community types. Future research is needed that explores the different dimensions and regional patterns of SDOH to address health inequity and guide policies and programs.
Conflict of interest statement
Figures

References
-
- The Atlantic Monthly Group . The COVID Racial Data Tracker. The COVID Tracking Project. Accessed April 16, 2021. https://covidtracking.com/race
-
- National Center for Health Statistics . Healthy People 2010. final review. Accessed May 11, 2021. https://www.cdc.gov/nchs/healthy_people/hp2010/hp2010_final_review.htm
Publication types
MeSH terms
LinkOut - more resources
Full Text Sources
Medical
